Introduction
Particles are a key concern in single-use bioprocessing because of their potential impact on product quality and patient safety, especially in process steps where filtration is not possible, such as final fill.
In this study, we compared particle generation over time across two widely used single-use mixing technologies: the Magnetic Mixer system and the LevMixer™ 50 L system.
The LevMixer system uses an impeller that levitates during operation, eliminating friction as it rotates. By contrast, the Magnetic Mixer system uses an impeller coupled via magnetic downforce, supported by a bearing assembly underneath. Friction within this bearing assembly can contribute to particle generation and may affect shear-sensitive products in downstream applications.
Materials and methods
Materials and conditions
- 50 L Magnetic Mixer system and LevMixer system cubical tank
- 50 L Magnetic Mixer single-use biocontainer with Allegro™ film
- 50 L LevMixer single-use biocontainer with Allegro film
- Magnetic Mixer system drive unit
- LevMixer system drive unit
- Type-2 ultrapure water (UPW)
- Proprietary automated image analysis system for particle counting
Table 1. Experimental conditions
| Mixers | LevMixer and Magnetic Mixer 50 L systems | ||
| Liquid | Type-2 ultrapure water (prefiltered 0.1 µm) | ||
| Temperature | Room temperature: 21.5 °C ± 0.5 °C | ||
| Mixing speed | Maximum: LevMixer system = 210 rpm; magnetic mixer system = 300 rpm | ||
| Mixing time | 6 h | ||
| Liquid volume | 25 L | ||
| Inflation | Yes | ||
| Sampling time/location | T0 h; T0.5 h; T2 h; T6 h. From the drain port of the mixer in 500 mL 2D biocontainers | ||
| 2D biocontainer flushing | 3 flushes of 200 mL to maximize particle extraction | ||
| Analytical method | Microscopic particle count test (based on USP<788> method 2) | ||
Note: Three biocontainers of each mixer type were tested. Each biocontainer was made with different lots of single-use components.
Method
We set up the mixer hardware and installed the single-use biocontainers according to the instructions for use (IFU). Each biocontainer was inflated through a 0.2 µm vent filter and filled to 25 ± 0.05 kg with UPW using a 0.1 µm liquid filter (preflushed with 2 L of UPW).
After filling, we connected custom sampling manifold to the drain using a Kleenpak™ Presto sterile connector.
We performed mixing at maximum impeller speed for 6 h in a temperature-controlled room.
Sampling
We first analyzed a 500 mL UPW sample to establish the baseline particle level (blank). Following this, we then collected 500 mL samples from each biocontainer at defined time points:
- Sample 1 = T0 h 500 mL (after filling and mixing for 1 min)
- Sample 2 = T0.5 h 500 mL
- Sample 3 = T2 h 500 m
- Sample 4 = T6 h 500 mL
Before each sample, we drained 300 mL (three times the tubing volume) to reduce carryover between samples.
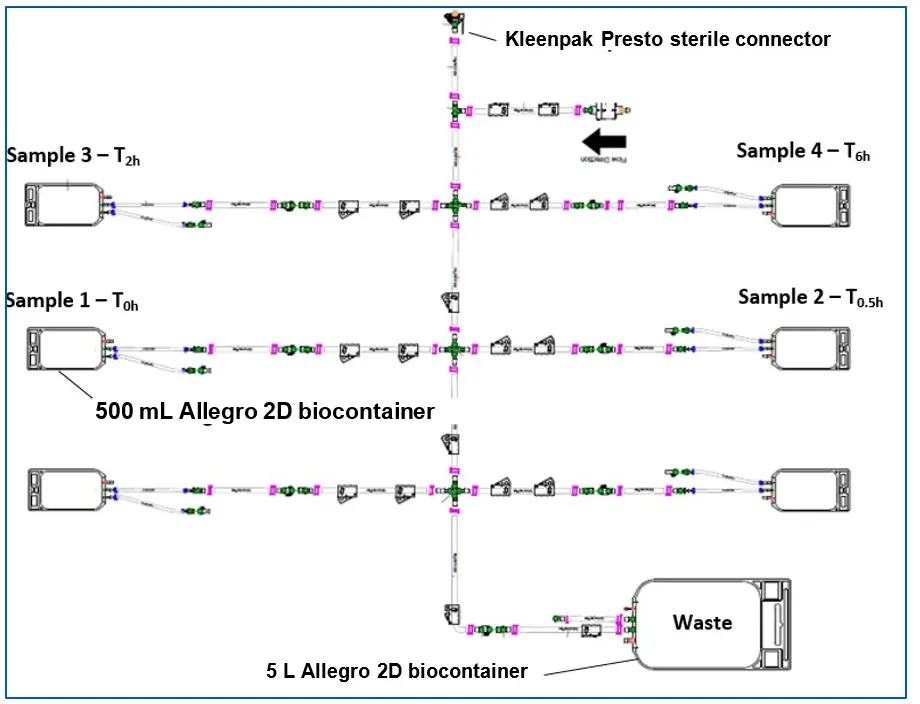
Fig 1. Sampling assembly.
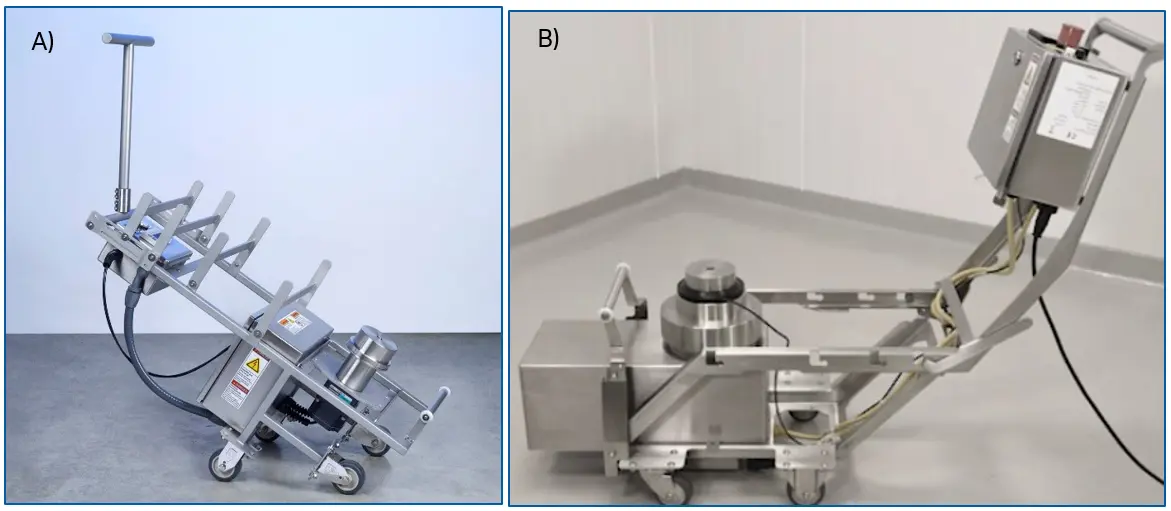
Fig 2. The Magnetic Mixer drive unit (A) and the LevMixer drive unit (B).
Analysis
Water samples, including the blank, were tested for sub-visible and visible particles using the USP<788> method 2 (microscopic particle count test).
Data processing and calculations
We recovered particles by emptying each sample and rinsing with 3 × 200 mL of filtered water.
We calculated a blank value as the mean particle count across six blank samples and subtracted this from each measurement:
Total particles in sample = [(∑ sample + flush 1,2,3) – Average (∑ blanks + flush 1,2,3)]
To compare technologies, we normalized particle counts to the maximum value observed at T6 h for the magnetic mixer system:
Normalized particle count (%) = (Particle count at T0 h, T0.5 h, T2 h, or T6 h ÷ maximum particle count at T6 h for magnetic mixer system) × 100
Results
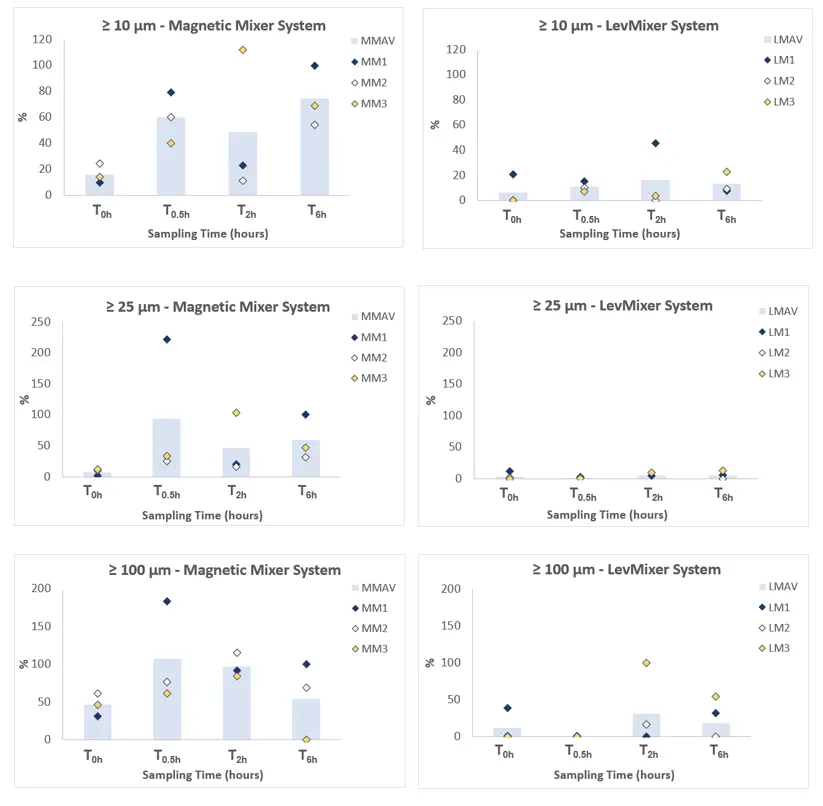
Fig 3. Evolution of sub-visible and visible particles in the LevMixer system and Magnetic Mixer (MM) system over time calculated in % and normalized based on the particles level in the MM samples T6 h. MMAV: Magnetic Mixer average; LMAV: LevMixer average.
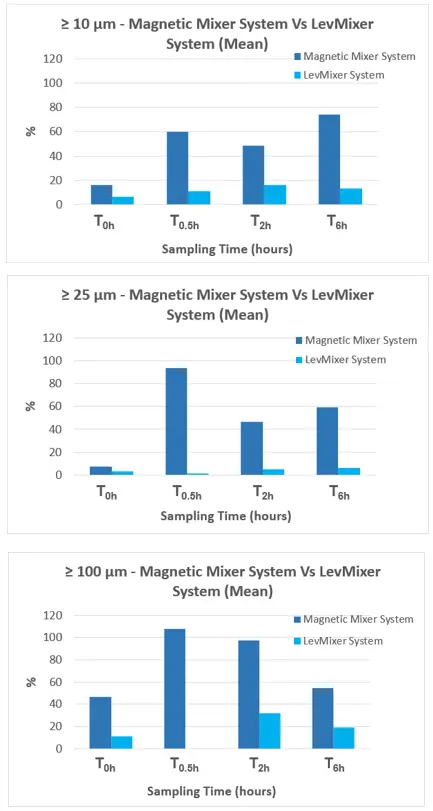
Fig 4. Evolution of sub-visible and visible particles in the LevMixer (LM) and Magnetic Mixer (MM) over time (mean only).
Conclusion
Under comparable process conditions (25 L in a 50 L system, maximum speed, up to 6 h), the LevMixer system generated substantially lower particle levels than the Magnetic Mixer system.
In some particle size ranges, particle counts with the LevMixer system were up to an order of magnitude lower than those observed with the Magnetic Mixer system. We also observed higher particle levels in the Magnetic Mixer system at early time points (T0 h and T0.5 h). This difference likely reflects impeller design and friction within the bearing assembly.
For both systems, particle levels stabilized after 0.5 h, indicating minimal additional particle generation beyond this point. All results remained below internal specifications aligned with USP <788> limits for large-volume parenterals:
- ≥ 10 µm: ≤ 12 particles/mL
- ≥ 25 µm: ≤ 2 particles/mL
Application guidance
- Magnetic mixer system is well-suited for high-shear mixing applications such as buffer and cell culture media preparation, where downstream filtration is in place.
- LevMixer system is well-suited for particle-sensitive applications, including downstream processing and operations without subsequent filtration.
CY59876