This report summarizes the results of an anonymous online survey conducted by The Analytical Scientist (Texere Publishing) on behalf of GE Healthcare. The intent was to learn more about the needs and preferences of individuals who were involved with high-performance liquid chromatography (HPLC) sample preparation. The survey was fielded from 12 February to 14 March 2018. During the time that this survey was open, 383 qualified surveys were collected which served as the basis for this report.
Demographics
Forty-five percent (45%) of the survey respondents were located in Europe, while 39% were located in North America. Eight percent (8%) were in Asia, Australia, Pacific Rim. Very few respondents were located in Central or South America (4%) or in the Middle East or Africa (4%).
Forty-five percent (45%) of the respondents were researchers/scientists. Thirty-one percent (31%) were group leaders, lab supervisors, or lab managers. Twelve percent (12%) of the respondents were department heads/managers or executives.
Two-fifths (39%) of the survey respondents were affiliated with academia, universities. Thirty percent (30%) worked in biotech, pharma, or biopharma companies. Eight percent (8%) worked in environmental testing laboratories, 5% worked for chemicals manufacturers, and 4% worked in food/beverage manufacturing.
The most common work group was research and development, which accounted for 74% of the respondents. Fifteen percent (15%) worked in QA/QC, 5% worked in core facilities, and 2% worked in manufacturing groups.
Key findings: sample preparation methods and issues
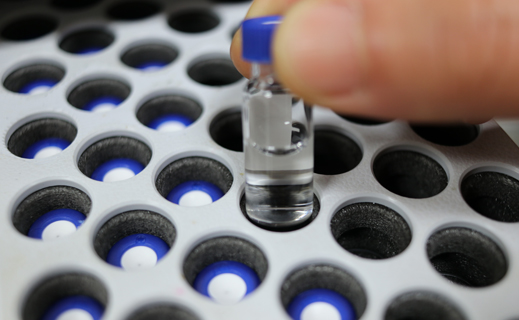
The method used most often for HPLC sample preparation was filtration (78%). Solid phase extraction (66%), centrifugation (62%), and liquid phase extraction (61%) were used somewhat less often.
The most common problems in HPLC sample preparation were a lack of understanding of the sample preparation process (49%), user error (46%), and time constraints not allowing work to be completed (36%). Product failure was considered a common problem for 20% of the respondents.
Survey respondents considered reduced chromatographic separation efficiency (72%) and reduced column life (63%) to be the biggest impacts of problems in HPLC sample preparation. Instrument downtime (38%) and increased service requirements for components (28%) were cited less often.
Key findings: sample filtration
A great majority (91%) of those respondents who used filtration considered the filters that they used for sample preparation to be optimal for their samples. Only 9% felt that the filters they used were not optimal. Those respondents that did not consider the filters they used for sample filtration to be optimal cited reasons such as the pore size not being optimal (58%), the membrane material not being optimal (53%), and the filter diameter not being optimal (47%).
Two-thirds (68%) of these survey respondents used non-sterile filters, 12% used sterile filters, and 20% used both types of filters.
These respondents used PTFE filters most often (28%). Nylon filters (17%), PVDF filters (15%), and cellulose acetate filters (12%) were used less often. The two filter pore sizes used most often were 0.2 microns (40%) and 0.45 microns (51%).
Key findings: automation and sample preparation
One-half (50%) of the respondents were using automated techniques in their HPLC sample preparation process (23%) or were planning to do so in the near future (27%). An equal percentage (50%) were not currently using such techniques and were not planning to do so in the near future.
The most often cited reason for moving towards automation for sample preparation was to improve productivity (85%). Cost savings (40%) and a lack of personnel or to minimize personnel (32%) were cited less often.
Of those survey respondents who used automated sample processing, 16% processed less than 10 samples per day on average. Forty-five percent (45%) processed 10 to 49 samples per day. Twenty-seven percent (27%) processed 50 to 199 samples per day. The remaining 12% processed 200 or more samples per day.
One-third (34%) of those survey respondents who had been using automation for HPLC sample preparation had been doing so for 2 years or less, 21% had been doing so for 3 to 5 years, and 45% had been doing so for more than 5 years.
Those respondents who were not using or planning to use automation for sample preparation cited reasons including not processing a large enough number of samples (65%), cost (51%), because they wanted to have control over sample preparation using manual devices (20%), or they did not see the value of automation (11%).
The issues that survey respondents thought would be the most likely to occur with an automated sample preparation system were system errors or failure (72%) or user errors (54%).
Click here to view the infographic for a summary of these key findings or download the full report now and learn more about key topics discussed in the survey including:
- Sample validation
- Roles in purchasing
- Improving your laboratory environment