Abstract
When thawing frozen cells purchased from a vendor, the quality and content of the cell culture medium directly affects the research results. Therefore, it’s essential to choose a suitable basal medium for your specific cell type and cell culture application. In this study, we purchased ATCC adherent mammalian cell lines originating from different tissues – MDCK, NIH 3T3, HEK 293, MCF 7, and A549. We cultured each cell line in a HyClone™ classical medium containing HyClone™ serum and other supplements based on their requirements as recommended by the vendor. In the first part of the study, we followed cell growth kinetics, cell viability, and cell morphology profiles. Next, we established optimal cell seeding densities and culturing routines after thawing these cell lines directly in HyClone™ medium containing HyClone™ serum. In the second part of the study, we investigated the following in triplicate after freeze-thawing: robustness and reproducibility of cell growth kinetics; cell viability; and cell morphologies. The results showed that all five cell lines have robust cell growth in HyClone™ classical medium containing HyClone™ serum. Further, robust growth was accomplished via direct media adaptation – by direct thaw of cells in the ATCC vial into HyClone™ medium.
Materials and methods
Cell line and media details
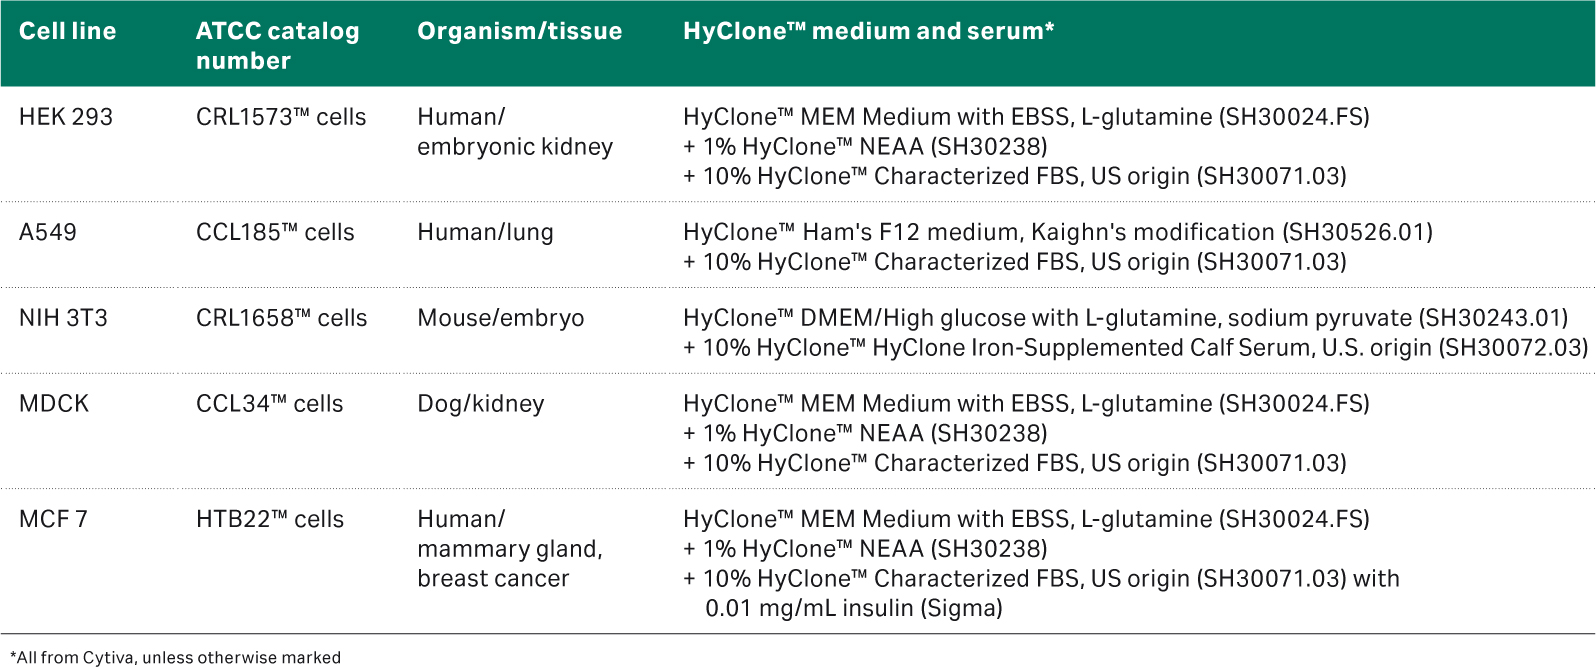
The details for all the cell types are listed in Table 1.
Table 1. Cell line and media details
Part 1: Evaluate direct media adaptation
Thawing cells
Vials of cells were rapidly thawed, and the cell suspension was transferred to a tube containing 9 mL of prewarmed medium, as shown in Table 1 for the respective cell line. The tube was thereafter centrifuged for 7 min at 125 × g, and the cell pellet was resuspended in 5 mL of complete medium and transferred to a T25 flask. The flasks were placed in an incubator at 5% CO2 and 37°C. The recovery after cell thaw was followed by daily microscopic observation to assess the cell morphology and cell confluency until the culture was terminated.
Cell counting and doubling times
Initially, viable cell numbers were determined by a manual trypan blue cell counting method. However, in parallel this method was compared to an automated trypan blue counting method (Vi-CELL™ XR, Beckman Coulter) with settings listed in section Vi-CELL™ XR settings. Automated Vi-CELL™ XR was selected (mostly after passage 3) for viable cell density (VCD) determination for the rest of the study (see section Selecting a cell counting method); these counts were used in the doubling time calculation.
Doubling times of the cells were calculated according to the formula shown in Figure 1.
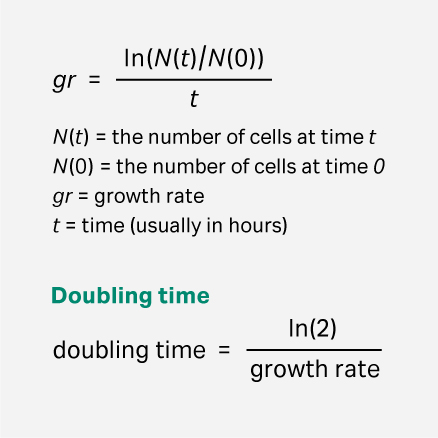
Fig 1. Formula for calculating cell doubling time.
The calculated values were plotted against the passage number. Moreover, the cell morphology was also followed by microscopic observation until the end passage.
Selecting a cell counting method
The viable cell densities (VCD) for mammalian cultures can be determined via several different methods, including trypan blue exclusion. This method is based on the principle that live cells have intact cell membranes that exclude dyes such as trypan blue. In contrast, dead cells lose the integrity of their membranes, and the dye can leak through the membranes to turn dead cells blue. The trypan blue method can be performed via manual (e.g., hemocytometer) or automated method (e.g., Vi-CELL™ XR). Since the sample volume for manual trypan blue method is very low (e.g., 10 µL), it could be used for the first passages when the cell numbers and culture volumes were low. However, the automated method is often preferred since it reduces operator variability, and therefore we chose this method for the following passages when the cells had increased in numbers. It’s important to note that the settings for determining the cell density and viability are crucial to get accurate numbers. Hence, these settings (i.e., cell brightness, sharpness, diameter) must be adjusted for specific cell types.
Vi-CELL™ XR settings
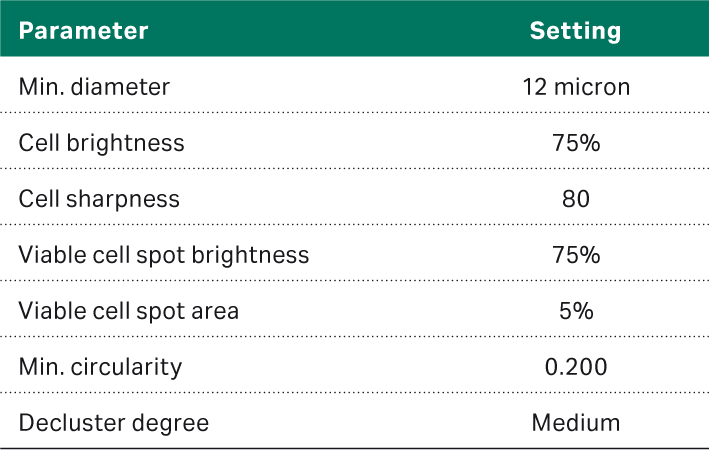
As noted in the previous section, the settings are critical to obtain accurate cell counts. The settings used for this study are listed in Table 2.
Table 2. Vi-CELL™ XR settings
Subculturing routines
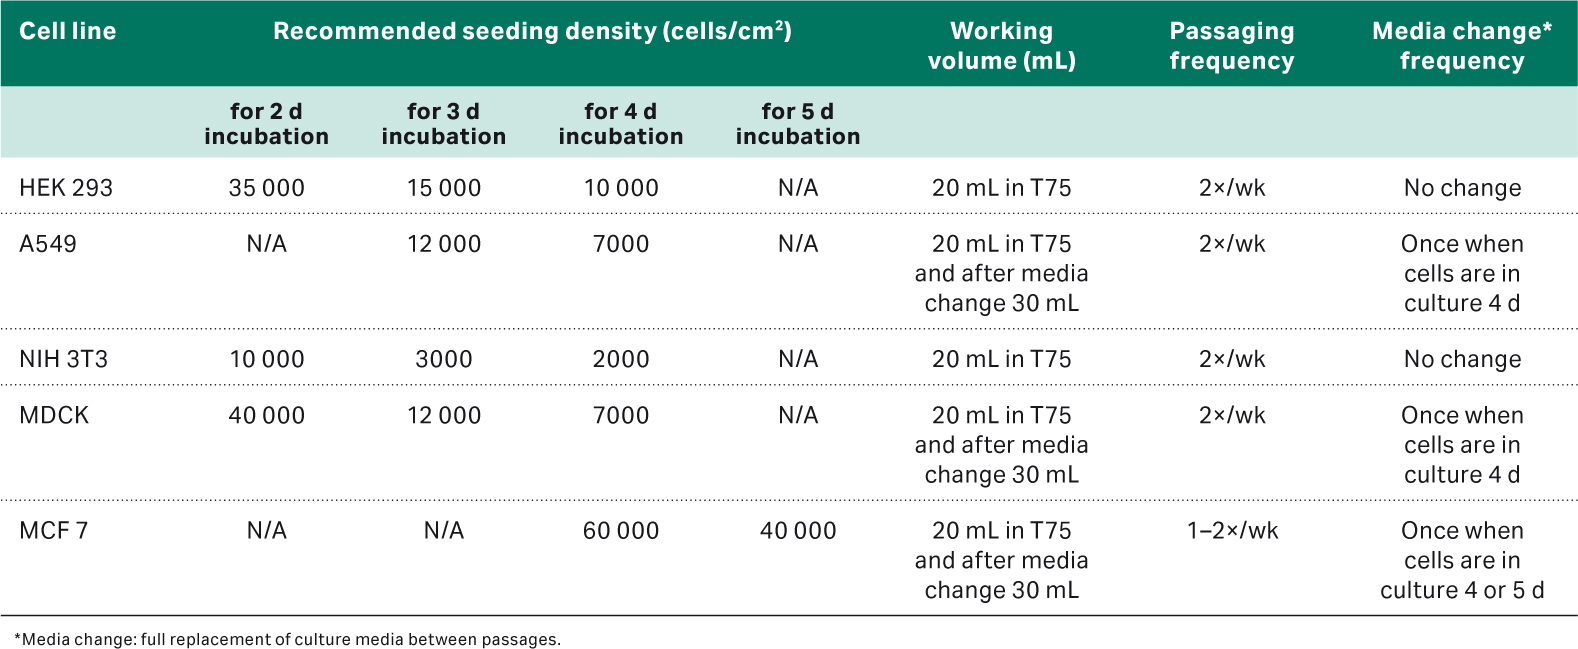
As a result of the first part of the study, optimal culturing routines were established for each cell type and summarized in Table 3. Briefly, the media was removed, and cells were washed with PBS. After removing the PBS, 2 to 4 mL of HyClone™ Trypsin-EDTA (Cytiva; SH30042.02) was added, and cells were placed at 37°C until they detached. New medium was added to the cell suspension, and a sample was taken for a cell count. The cells were seeded in a new flask at the seeding density and working volume recommended in Table 3. For the longer incubation periods, some cell lines benefitted from medium replacement, as marked in Table 3.
Freezing cells
Freezing medium was prepared by adding 5% DMSO to a tube of the respective complete medium (see Table 1). Cells were trypsinized and counted. The appropriate numbers of cells were calculated and centrifuged at 125 × g for 7 min. Cells were resuspended to 2.5 to 5 viable cells/mL in freezing media. The cell suspension was added at 1 mL per cryovial, and vials were placed in a freezing unit and put at -80°C overnight then moved to a -150°C freezer.
Table 3. The cell subculturing routine
Part 2: Evaluate robustness and reproducibility
In this part of the study, the reproducibility of the cell growth, doubling time, viability, and cell morphology for each cell type were investigated further by studying each condition in triplicate, using ATCC recommended media as controls. Following from the first part of the study, the prepared cell stocks and established optimal seeding densities were used (Table 3). Briefly, 3 vials of each cell type were thawed into the designated HyClone™ medium and serum for that cell line. In triplicate conditions, cells were thawed in T75 flasks with 20 to 25 mL working volume and placed in 5% CO2 in a 37°C static incubator. The recovery after cell thaw was followed by daily microscopic observation to assess the cell morphology and cell confluency. Cells were passaged as listed in Table 3.
Results – HEK293
You’ll find results for the other cell types at the bottom of the page.
Part 1: Evaluate direct media adaptation
The first thaw of the HEK 293 cells was performed as described in Materials and methods into HyClone™ MEM Medium with EBSS, L-glutamine (SH30024.FS) + 1% HyClone™ NEAA (SH30238) + 10% HyClone™ Characterized FBS, US origin (SH30071.03). We counted the cells at thaw and could determine 0.48 × 10⁶ viable cells and post-thaw viability of 54%. The recovery after cell thaw was followed by daily microscopic observation to assess the cell morphology and cell confluency (Fig 2). We observed many floating cells on days 1 and 2. For that reason, we changed the medium on day 2. The first passaging was performed on day 3 when the cells reached 80% to 90% confluency.
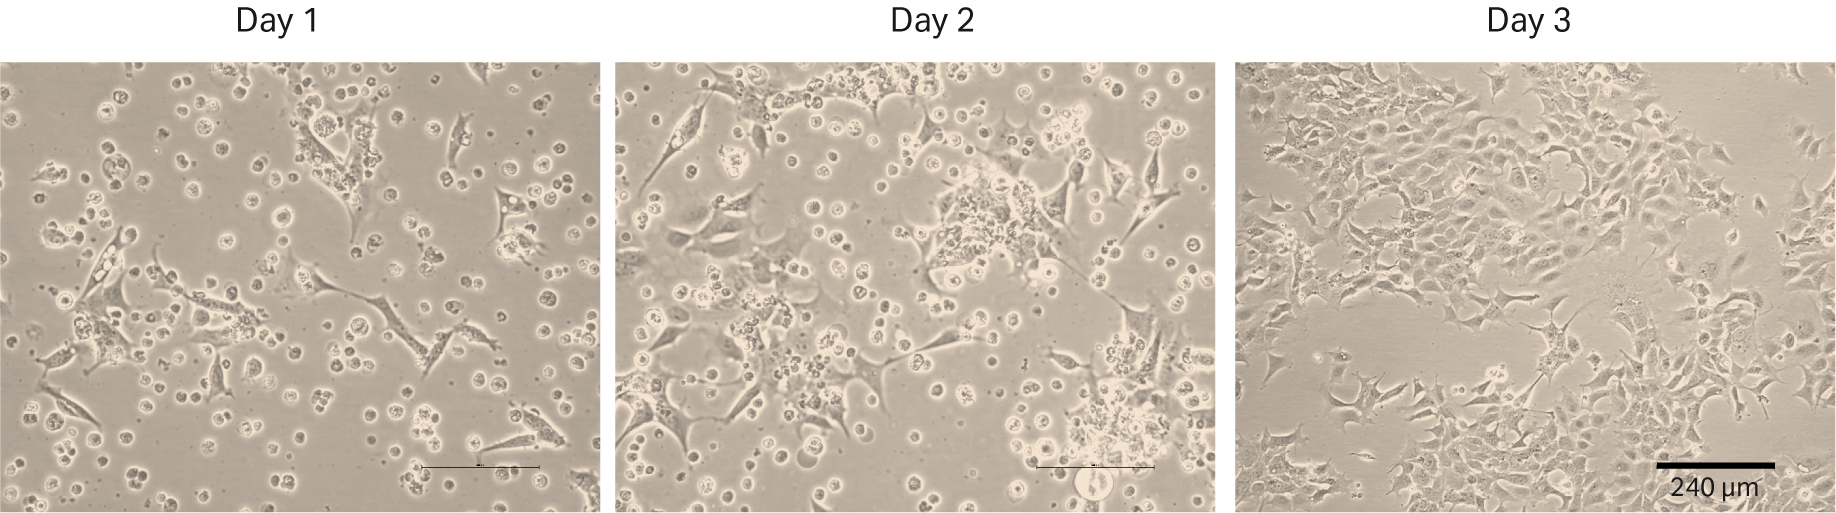
Fig 2. HEK 293 cell morphology and confluency 1, 2 and 3 d after direct thaw in HyClone™ medium with serum.
After thawing, the cells were passaged every 3 to 4 d until passage 14. Doubling time and viability are shown in Figure 3A. When the cells reached passage 8 and generation 15 (note that generation number was considered as 0 upon direct cell thaw from purchased ATCC vial), cell stocks were prepared for the second part of the study with 4 million viable cells (MVC/vial). The cell morphology from representative images are shown in Figure 3B.
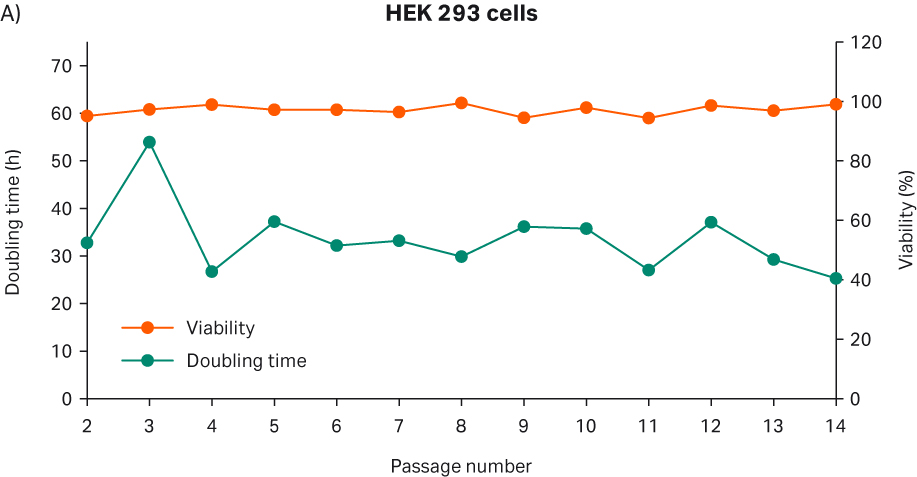
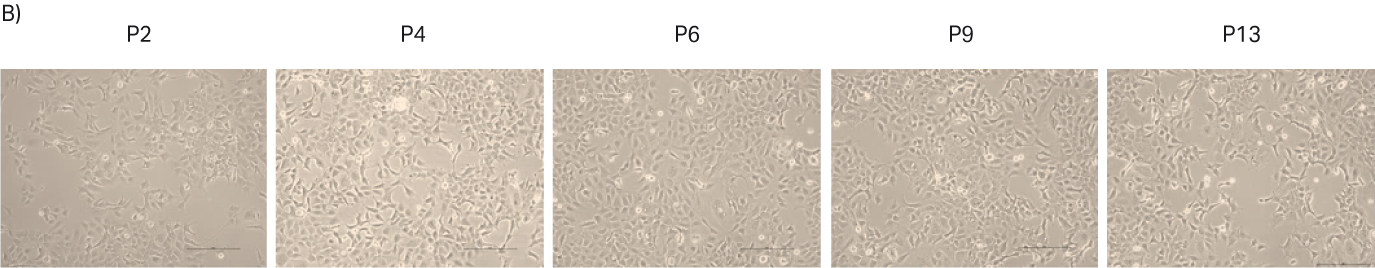
Fig 3. A) Doubling time and viability of HEK 293 cells from thaw to passage 14. B) HEK 293 cell morphology and confluency at different passages. The scale bar is 240 µm for all the images. which were taken with the 10× objective.
The doubling time of passage 1 was excluded from Figure 3A, because determination of the initial seeding density was inaccurate due to floating cells upon cell thaw. When the cells were initially thawed, total VCD was calculated with a manual trypan blue method and based on that count, viable cell seeding density per cm2 was calculated. Three days after the recovery, total viable cell number and viable cell number per cm2 were determined to calculate the doubling time. However, since some of the cells did not attach upon cell thaw and washed away during the medium change, VCD per cm2 after 3 d of recovery was determined as almost the same value as day 0 seeding density. This resulted in a negative doubling time value, and this value did not reflect the cell growth kinetics in a precise manner. As shown in Figure 2, attached cells grew and reached confluency at the end of 3 d after thaw.
Part 2: Evaluate robustness and reproducibility
After cell thawing, HEK 293 cells were kept in culture in triplicate, starting with generation approx. 15 and passage 9, until they reached passage 18 and generation 44. The morphology of the cells was monitored during the whole culture period of approx. 34 d (Fig 4A–C). The viabilities of the triplicate cultures were above 96% (Fig 4D). From passage 10, the cultures had an average doubling time of approx. 28 h (Fig 4D).
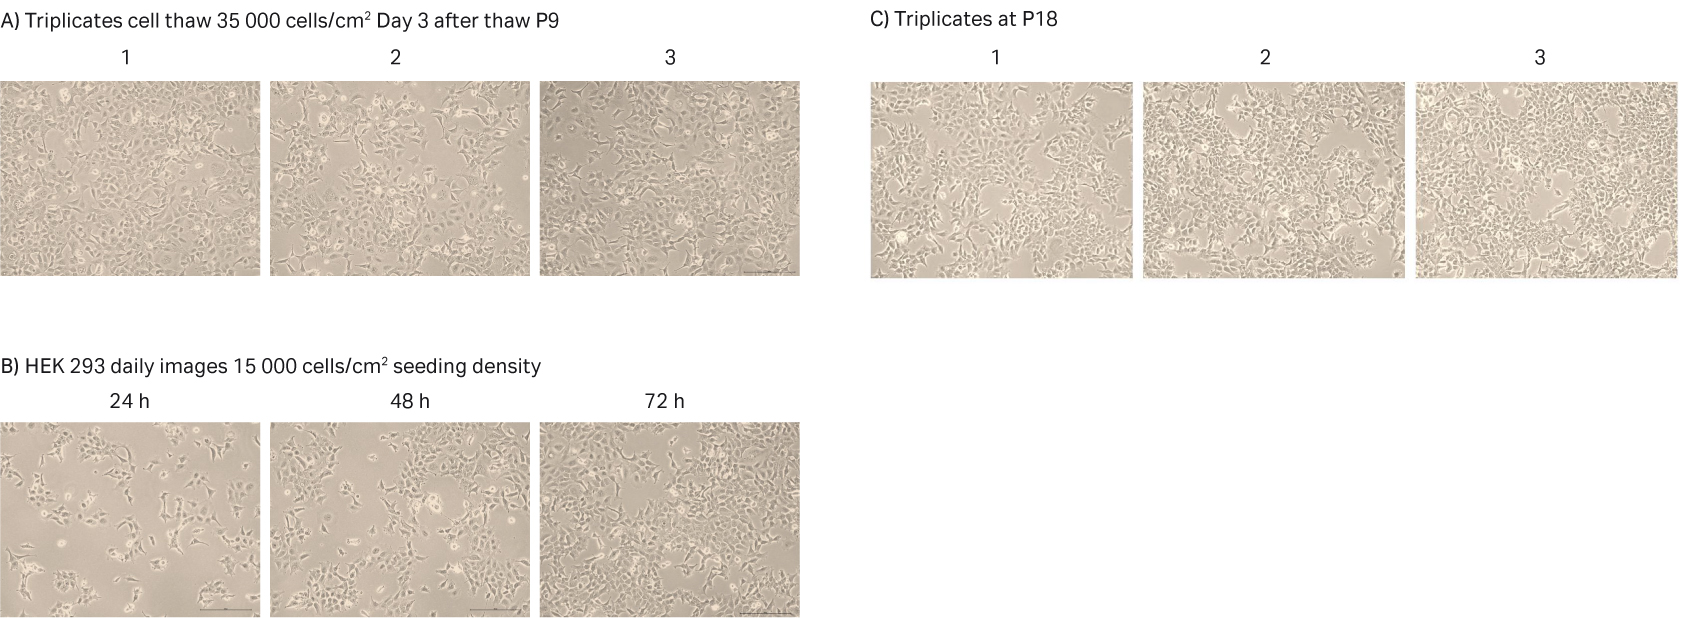
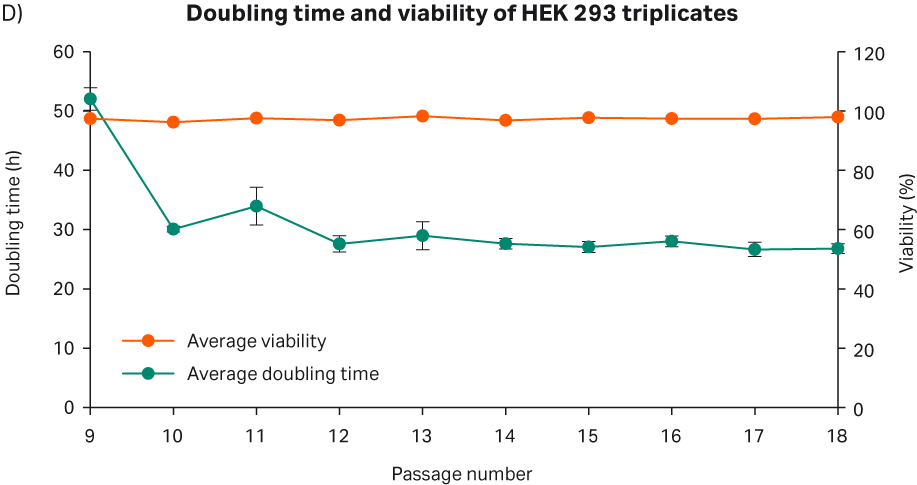
Fig 4. A) HEK 293 cell morphology after cell thaw. B) Daily images of HEK 293 cells with 15 000 cells/cm2 seeding density. C) HEK 293 cell morphology at passage 18. D) The doubling time and viability profile of triplicate HEK 293 cells from passages 9 to 18.
Discussion
In the first part of the study, we established cell culture routines and determined the optimal cell seeding densities for all the cell types. Based on these culture routines, the second part of the study could be performed and the doubling times of the cell lines in their given HyClone™ medium with serum determined, as listed in Table 4.
Table 4. Average doubling times for the different cell lines for the second part of the study
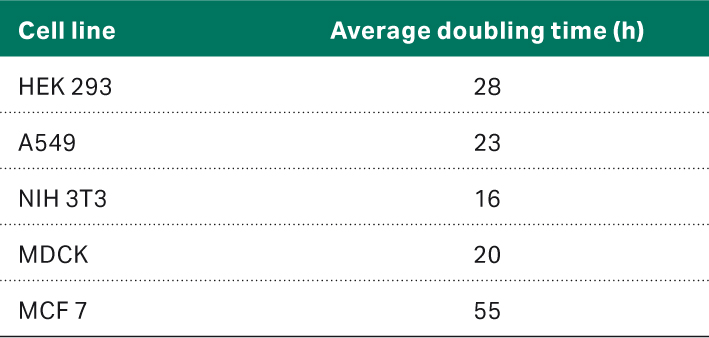
The population doubling times were in line with ATCC website information and/or literature studies (1–6).
Conclusions
- From the second passage on, the doubling times of the cell lines HEK 293, A549, NIH 3T3, MDCK, and MCF 7 were 28, 23, 16, 20, and 55 h, respectively, with the given HyClone™ medium and serum. Furthermore, triplicate study showed that cells have reproducible cell growth kinetics and viability after freeze thaw.
- In conclusion, this study suggests that HyClone™ classical media and serum can be used without prior adaptation for routine cell culture applications of given ATCC mammalian cells.
References
- American Type Culture Collection. SOP: Thawing, Propagating and Cryopreserving of NCI-PBCF-HTB22 (MCF-7), February 27, 2012; Version 1.6
- Leibniz Institute DSMZ-German Collection of Microorganisms and Cell Cultures.Cell line data on MCF7. https://www.dsmz.de/collection/catalogue/details/culture/ACC-115?tx_dsmzresources_pi5%5BreturnPid%5D=192. Accessed November 15, 2021.
- Cho MJ, Thompson DP, Cramer CT, Vidmar TJ, Scieszka JF. The Madin Darby canine kidney (MDCK) epithelial cell monolayer as a model cellular transport barrierPharm Res. 1989 Jan;6(1):71-7. doi: 10.1023/a:1015807904558
- American Type Culture Collection. A549 doubling time Info: https://www.lgcstandards-atcc.org/products/all/CCL-185.aspx?geo_country=gb#specifications. Accessed November 15, 2021.
- CLS Cell Lines Service GmbH. HEK 293 Doubling time info: https://www.clsgmbh.de/pdf/hek293.pdf. Accessed November 15, 2021.
- Leibniz Institute DSMZ-German Collection of Microorganisms and Cell Cultures. Cell line data on NIH 3T3. https://www.dsmz.de/collection/catalogue/details/culture/ACC-59.Accessed November 15, 2021.
- Lugovtsev VY, Melnyk D, Weir JP. Heterogeneity of the MDCK cell line and its applicability for influenza virus research. PLoS One, 2013 Sep 13;8(9):e75014. doi: 10.1371/journal.pone.0075014
- American Type Culture Collection. NIH 3T3 cells. https://www.atcc.org/products/crl-1658.
- Accessed November 18, 2021.Yao T and Asayama Y. Animal-cell culture media: History, characteristics, and current issues. Reprod Med Biol. 2017;16:99–117. doi: 10.1002/rmb2.12024
TR29476099 CY25041
Part 1: Evaluate direct media adaptation
The first thaw of the MDCK cells was performed as described in Material and methods into HyClone™ MEM Medium with EBSS, L-glutamine (SH30024.FS) with 10% HyClone™ Characterized FBS, US origin (SH30071.03), and 1% HyClone™ NEAA. We counted the cells at thaw and could determine 0.39 × 10⁶ viable cells and post-thaw viability of 66%. The recovery after cell thaw was followed by daily microscopic observation to assess the cell morphology and cell confluency (Fig 5). One day after cell thaw, we observed some floating cells. For this reason, we changed the medium on day 2. The first passaging was performed on day 3 when the cells reached confluency.
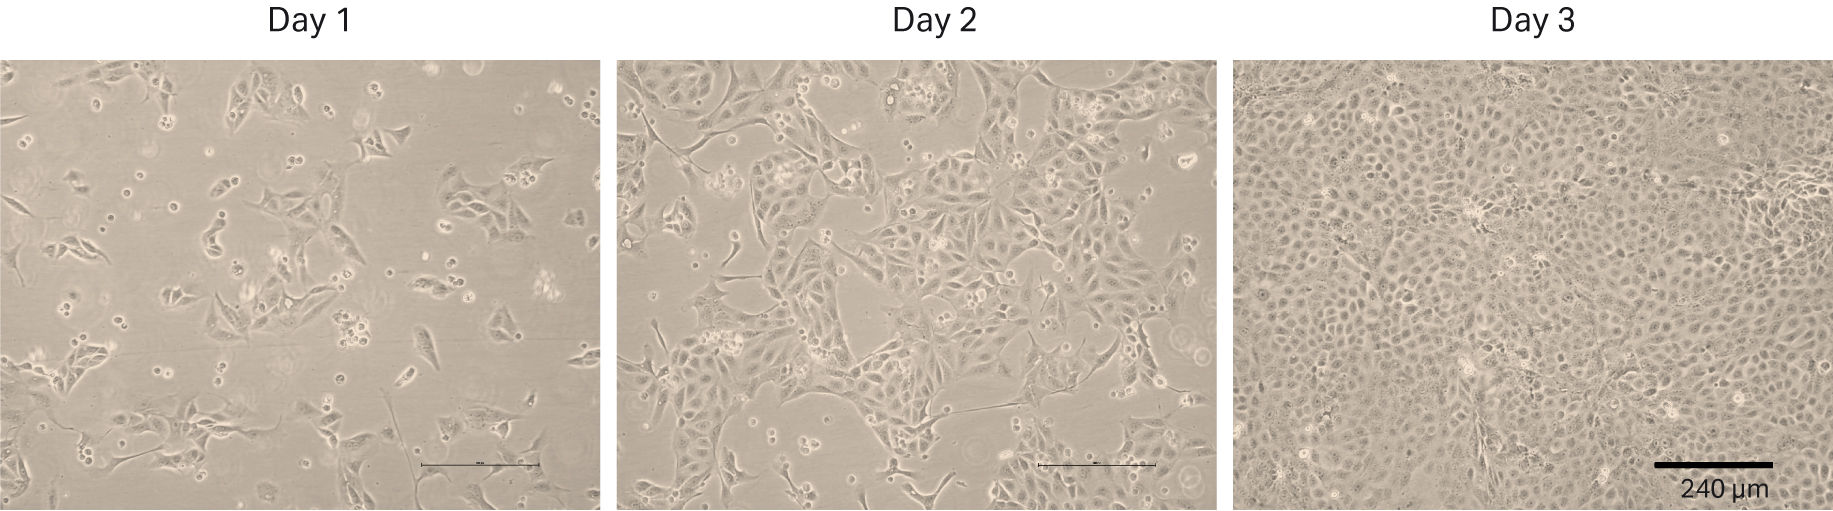
Fig 5. MDCK cell morphology and confluency 1, 2, and 3 days after direct thaw in HyClone™ medium.
After thawing, the cells were passaged every 3 to 4 d until passage 14. Doubling time and viability are shown in Figure 6A. When the cells reached passage 8 and generation 20 to 25, the cell stocks were prepared for the second part of the study with 5 MVC/vial. Also, interim cell banks at passages 2 were prepared with approx. 2 MVC/vial. The cell morphologies from representative images are shown in Figure 6B.

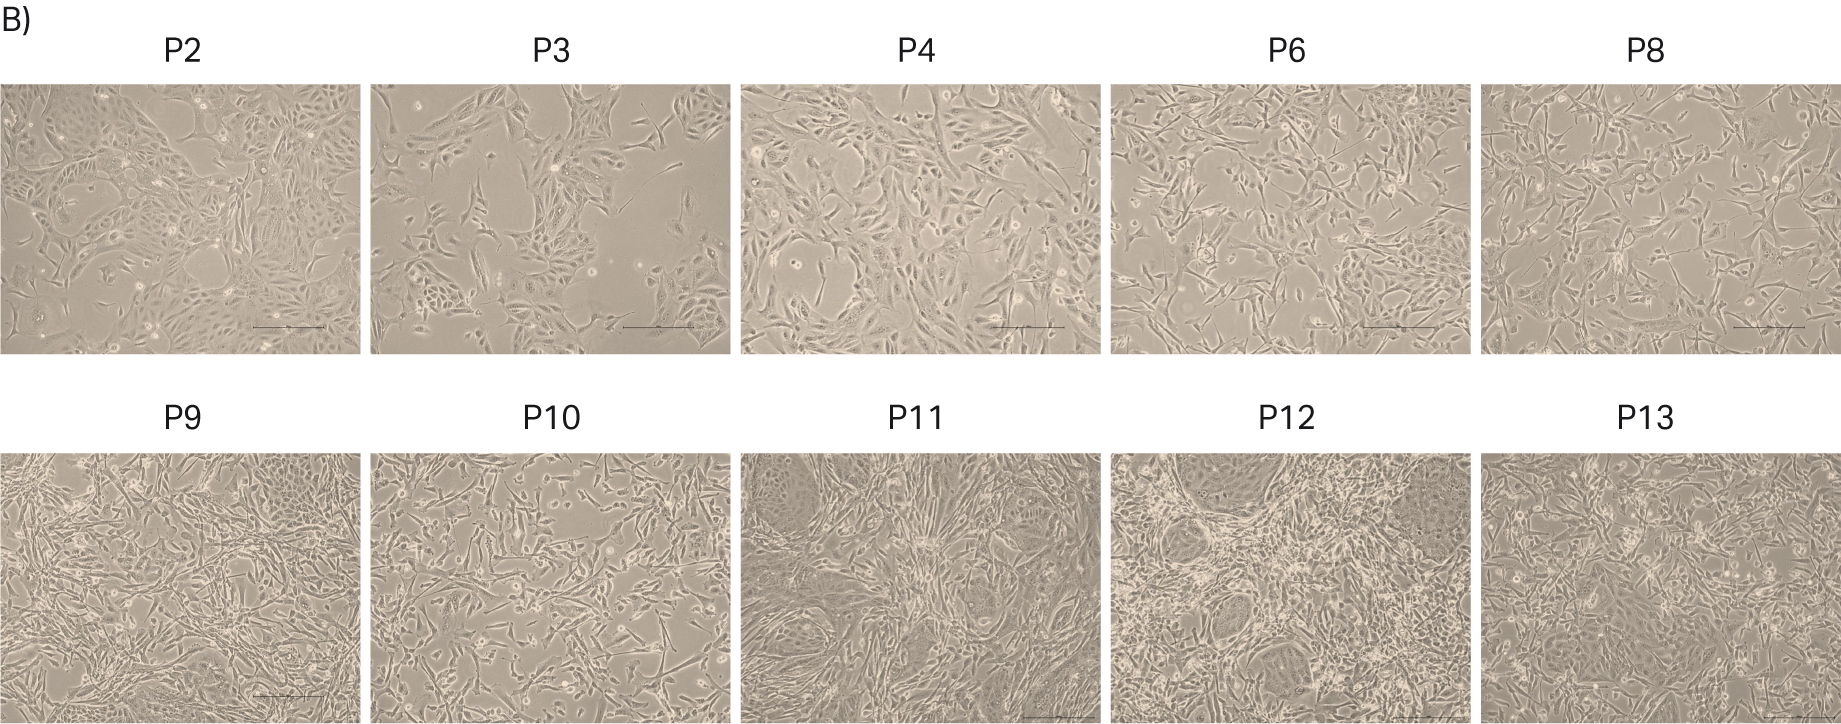
Fig 6. A) Doubling time and viability of MDCK cells from thaw to passage 14. B) MDCK cell morphology and confluency at different passages. The scale bar is 240 µm for all the images. which were taken with the 10× objective.
During the study, the morphology of all the cell lines were observed via light microscopy to follow the patterns over the passages. We noticed that MDCK cells were prone to morphology changes as the cell passage number increased. Normally, MDCK cells have heterogeneous cell morphology with ‘island like’ structures and single cells. However, after passage 5 the island-like cell morphology started decreasing, and the single cell morphology became dominant in the culture (Fig 6B). When the cells reached passage 8, the island-like morphology decreased substantially. The literature also mentioned that MDCK cells are prone to morphology changes (7). In order to investigate this further, we thawed one vial of MDCK cells frozen at an early passage (P2) and followed the cell morphology over several passages. Again, we observed that the MDCK cell morphology went towards more of a single cell population after passage 4 (Fig 7A).
In parallel to the morphology changes, we also noticed that, as the passage number increased, the doubling times of MDCK cells slightly increased and eventually reached approx. 50 h at passages 10 to 11 with the maintenance culture (Figure 6A). It was speculated that the increase in doubling times and morphology changes might be due to the seeding density. Hence, different cell seeding densities were trialed to see if the MDCK cell morphology and doubling times would be affected. First, 40 000 cells/cm2 seeding density was used for 3 d culture (yellow line in Fig 7B) from passages 2 to 4, and then the seeding density of these particular cultures decreased to 10 000 in the follow-up passages 5, 6, and 7. We observed that these cultures had a doubling time of 40 h at passages 3 and 4 whereas from passage 5 onwards, doubling time was decreased to 20 to 25 h (Fig 7B). This experiment demonstrated that 3 d culture indeed required less seeding density such as 10 000 cells/cm2 because with these seeding densities, the doubling times reached the expected doubling times of 20 to 25 h. Furthermore, the cells seeded at 10 000 cells/cm2 from the beginning (Figure 6B green) had the expected doubling times of 20 to 25 h.
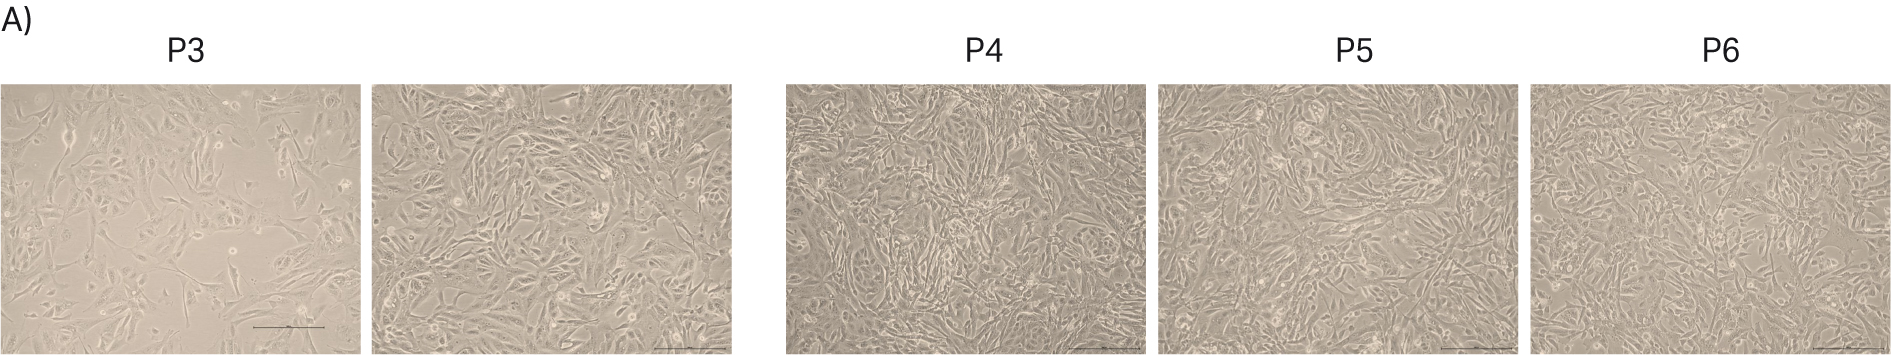
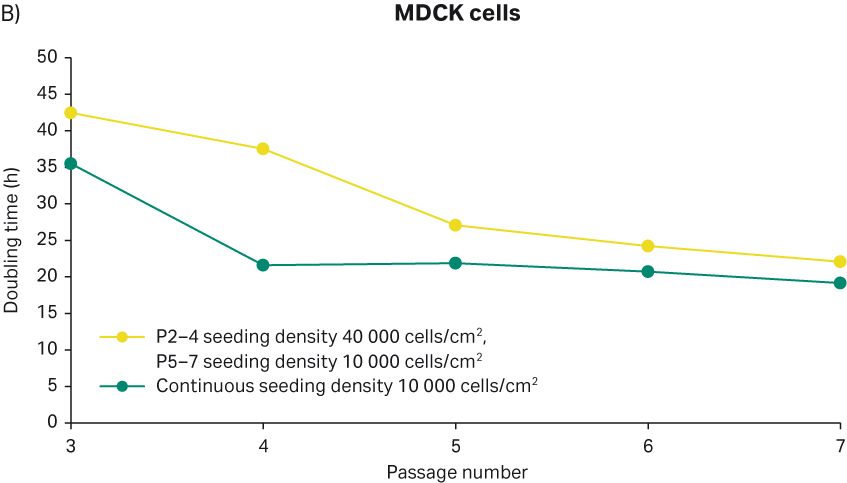
Fig 7. A) MDCK cell morphology upon thawing from P2 cell stocks. B) Doubling time of MDCK cells seeded with different initial seeding density. Green line: continuous seeding density 10 000 cells/cm2. Yellow line: p2-4 seeding density 40 000 cells/cm2, p5-7 seeding density 10 000 cells/cm2
Also, we observed that MDCK cells consumed medium quickly, and the medium color turned orangish-yellow within 4 d in culture (something we didn’t observe with the other cell lines included in this study). In light of this information, we established special culturing routines for the MDCK cells where 7000 cells/cm2 seeding density was used for 4 d with a medium change on day 2, and 12 000 cells/cm2 seeding density was used for 3 d culture without a medium change. With these culturing routines, the cells had a doubling time between 20 to 25 h during passages 12, 13, and 14 (Fig 6A). The cell morphology was also changed where more ‘island like’ cell morphology appeared (Figure 6B passage 12 and 13). These results showed that MDCK cells are prone to morphology change however the change was reversible upon switching to more favorable culturing conditions. Additionally, it was also shown that the optimal cell seeding density was crucial for these cells to have the expected doubling times.
Part 2: Evaluate robustness and reproducibility
After cell thawing, MDCK cells were kept in culture in triplicate, starting with generation approx. 21 and passage 9, until they reached passage 20 and generation 54. The morphology of the cell cultures were monitored during the whole culture period of 40 d (Fig 8A–C). The viabilities of the triplicate cultures were above 99% (Fig 8D). From passage 10, the cultures had an average doubling time of approx. 20 h (Fig 8D).
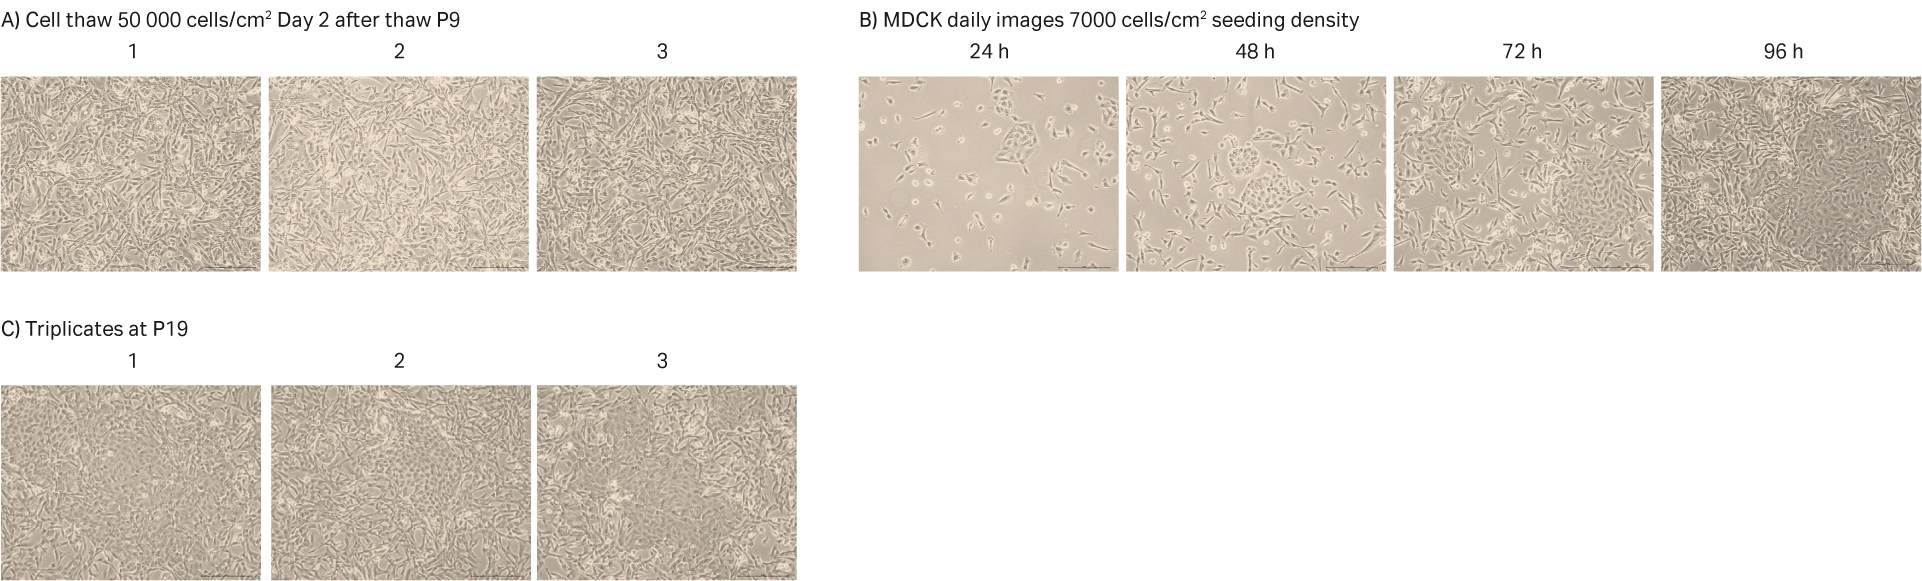
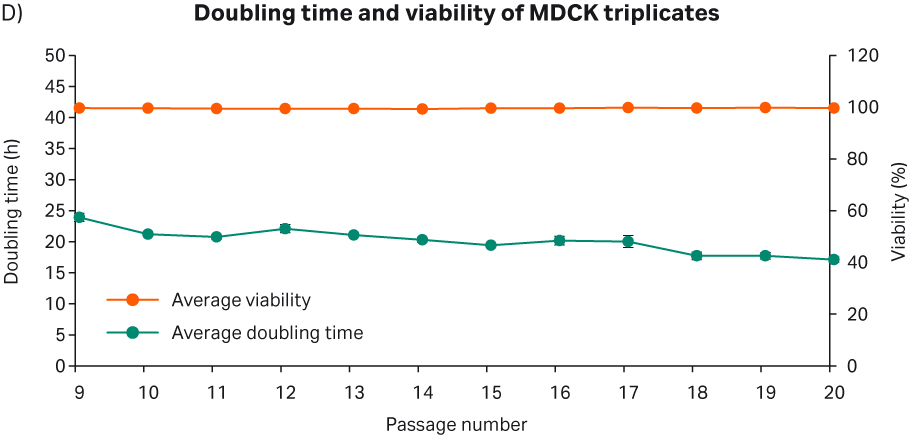
Fig 8. A) MDCK cell morphology after cell thaw. B) Daily images of MDCK cells with 7000 cells/cm2 seeding density. C) MDCK cell morphology at passage 19. D) The doubling time and viability profile of triplicate MDCK cells from passages 9 to 20.
Part 1: Evaluate direct media adaptation
The first thaw of the NIH 3T3 cells was performed as described in Material and methods into HyClone™ DMEM/High glucose with L-glutamine, sodium pyruvate (SH30243.01) with 10% HyClone™ Iron-Supplemented Calf Serum, U.S. origin (SH30072.03). We counted the cells at thaw and could determine 0.07 × 10⁶ viable cells and post-thaw viability of 50%. The recovery after cell thaw was followed by daily microscopic observation to assess the cell morphology and cell confluency (Fig 9). As shown in the images of days 1 to 4, the initial recovery was very slow, most likely due to the low cell numbers (0.5 MVC) in the cell vial. We changed the medium on day 4, and the first passaging was performed on day 6 when the cells reached confluency.
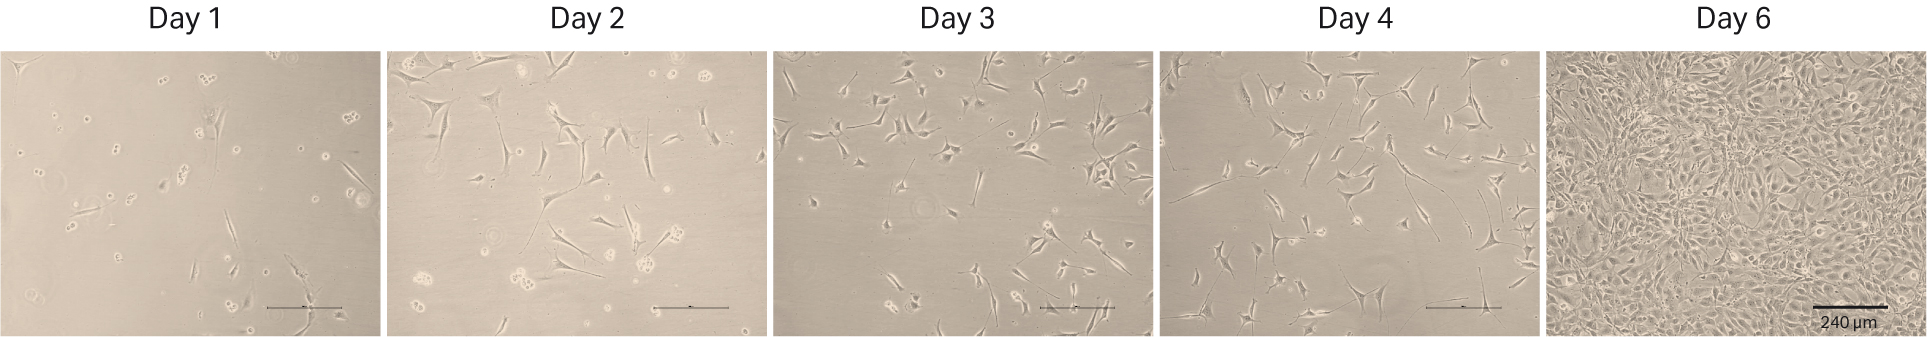
Fig 9. NIH 3T3 cell morphology and confluency 1 to 6 d after direct thaw in HyClone™ medium.
After thawing, the cells were passaged every 3 to 4 d until passage 15. Doubling time and viability are shown in Figure 10A. When the cells reached passage 5 and generation 16, cell stocks with 3 MVC/vial were prepared for the second part of the study. The cell morphology from representative images are shown in Figure 10B. The morphology is consistent with pictures from the vendor’s web site (8).
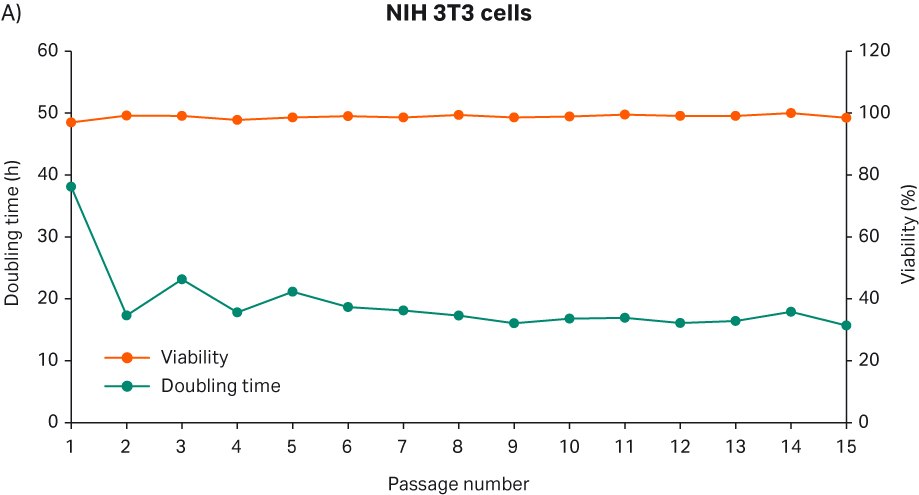
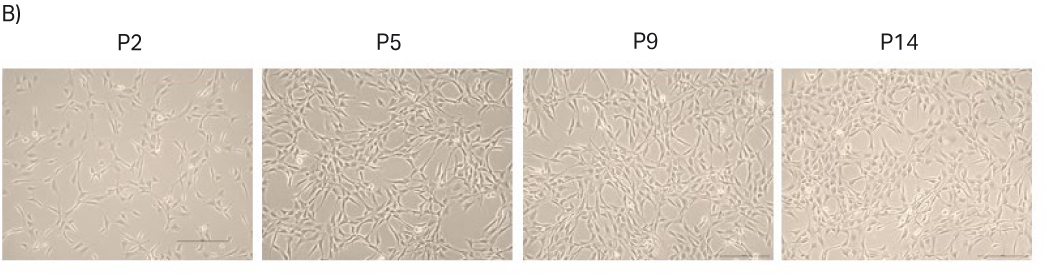
Fig 10. A) Doubling time and viability of NIH 3T3 cells from thaw to passage 15. B) NIH 3T3 cell morphology and confluency at different passages. The scale bar is 240 µm for all the images. which were taken with the 10× objective.
Part 2: Evaluate robustness and reproducibility
After cell thawing, NIH 3T3 cells were kept in culture in triplicate, starting with generation approx. 16 and passage 6, until they reached passage 20 and generation 90. The morphology of the cell cultures were monitored during the whole culture period of 52 days (Fig 11A–C). The viabilities of the triplicate cultures were above 98% (Fig 11D). From passage 6, the cultures had an average doubling time of approx. 16 h (Fig 11D).
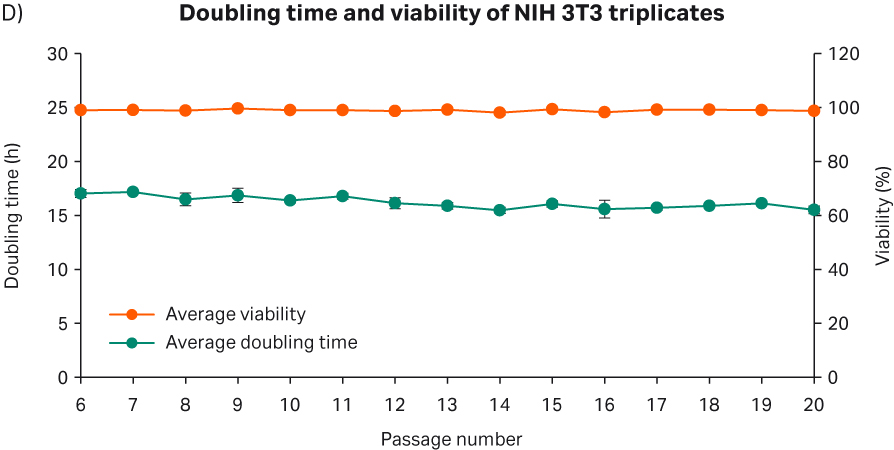
Fig 11. A) NIH 3T3 cell morphology after cell thaw. B) The daily images of NIH 3T3 cells with 3000 cells/cm2 seeding density. C) NIH 3T3 cell morphology at passage 20. D) The doubling time and viability profile of triplicate NIH 3T3 cells from passages 6 to 20.
Part 1: Evaluate direct media adaptation
The first thaw of MCF 7 was performed as descibed in Material and methods into HyClone™ MEM Medium with EBSS, L-glutamine (SH30024.FS) with 10% HyClone™ Characterized FBS, US origin (SH30071.03) and 1% HyClone™ NEAA and 0.01 mg/mL insulin. We counted the cells at thaw and could determine 0.68 x 10⁶ viable cells and post-thaw viability of 72%. The recovery after cell thaw was followed by daily microscopic observation to assess the cell morphology and cell confluency (Fig 12). As shown in the after-thaw images, the initial recovery was slow. So, we added extra medium to the flasks on day 2 to boost the cell growth. We observed that the cells were in both suspension and adherent form. Even though the cells did not reach confluency, they were passaged with a 1:2 ratio on day 4.
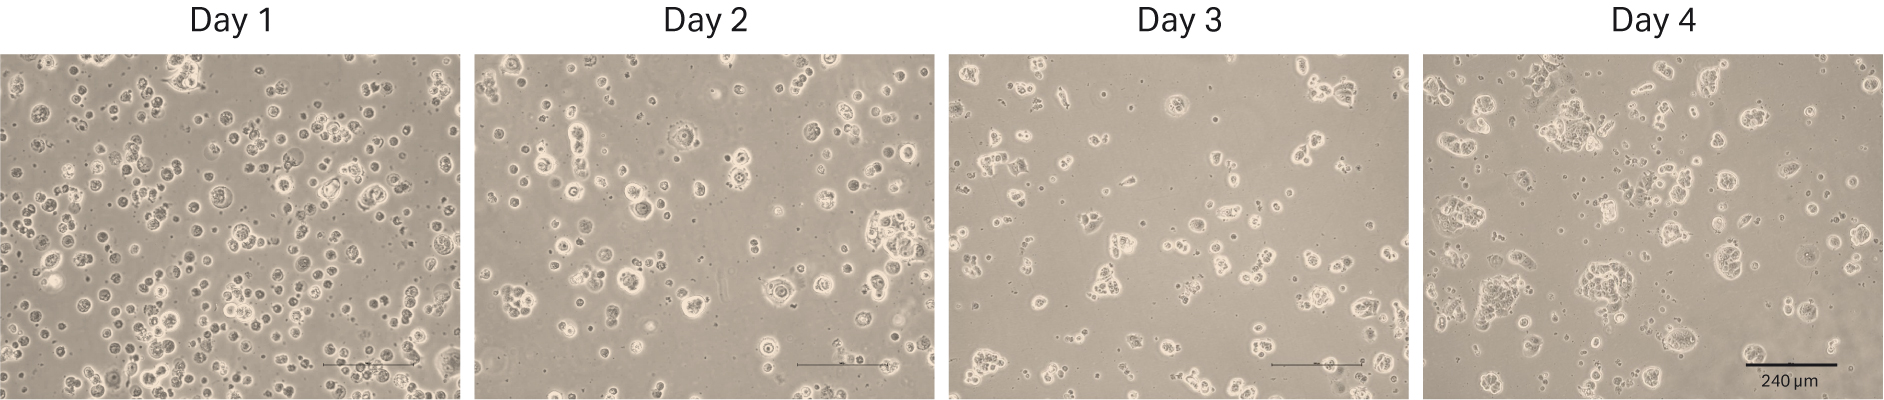
Fig 12. MCF 7 cell morphology and confluency 1 to 4 d after direct thaw in HyClone™ medium.
After thawing, the cells were passaged every 3 to 4 d until passage 9. Doubling time and viability are shown in Figure 13A. When the cells reached passage 6 and generation 12, the cell stocks were prepared for the second part of the study with 5 MVC/vial. The cell morphology from representative images are shown in Figure 13B.
We observed that MCF 7 cells grew relatively slower than all other cell lines, with approx. 40 to 60 h doubling time. This observation was consistent with previous studies (1, 9). Passaging of MCF7 cells was challenging due to their clumpy nature. These cells were received as a mixed population of adherent and suspension cells. ATCC recommended passaging them carefully to avoid losing the cells in suspension. So, during passaging the cell supernatant was collected in a 50 mL tube, and the trypsinized cells were added to the same tube. Then, the cells were centrifuged at 125 × g for 7 min and resuspended in fresh media for the cell count. In this way, we avoided losing suspension cell clumps. Also, ATCC stated that the cells will attach to the flask after several passages, and that these will be increasingly the adherent type. This statement was consistent with our observations of the microscopic images.
Moreover, the aggregated nature of the MCF 7 cells also challenged the accuracy of the VCD determination. MCF 7 cells were not totally in single cell suspension after the trypsinization, and some cell clumps were still present during cell count determination, as shown with the Vi-CELL™ images (Figure 13C). Hence, in order to reduce aggregation, we tried different strategies such as pipetting the culture up and down in a harsher way or homogenizing the culture with a 21G needle. These harsh methods increased the portion of cells in single-cell suspension state, but viability decreased (data not shown). Therefore, we opted not to use these harsh methods. These challenges likely impacted the accuracy of the cell counts.
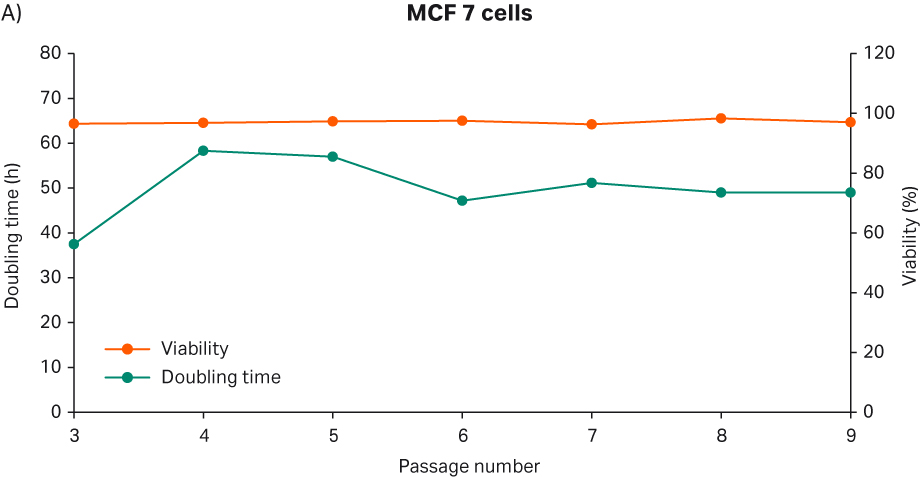
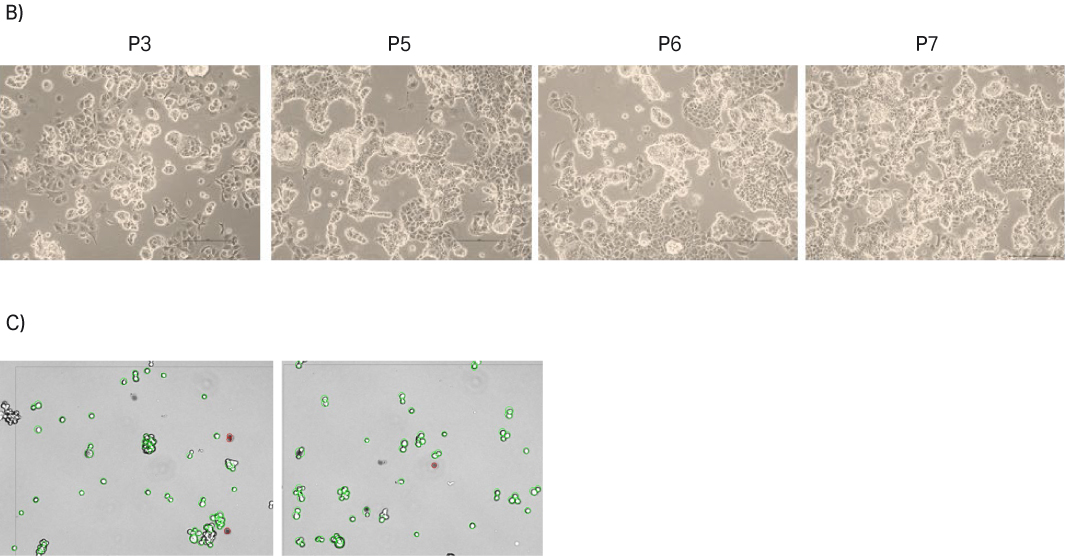
Fig 13. A) Doubling time and viability of MCF 7 cells from thaw to passage 9. B) MCF 7 cell morphology and confluency at different passages. The scale bar is 240 µm for all the images. which were taken with the 10× objective. C) MCF 7 cell suspension after trypsinization; Vi-CELL™ XR image.
The doubling time of passages 1 and 2 were excluded from the graph in Figure 13A for several reasons. First, the initial seeding density determination was inaccurate due to the heterogenous cell population – a mixture of floating suspension cells and adherent cells – upon thawing. Furthermore, the clumpy nature of the cells also challenged the precise determination of the cell seeding density, especially with the manual trypan blue cell count method for the first 2 passages.
Part 2: Evaluate robustness and reproducibility
After cell thawing, MCF 7 cells were kept in culture in triplicate, starting with generation approx. 12 and passage 7, until they reached passage 15 and generation 31. The morphology of the cell cultures were monitored during the whole culture period of 42 days (Fig 14A–C). The viabilities of the triplicate cultures were above 96% (Fig 14D). From passage 8, the cultures had an average doubling time of approx. 55 h (Fig 14D).
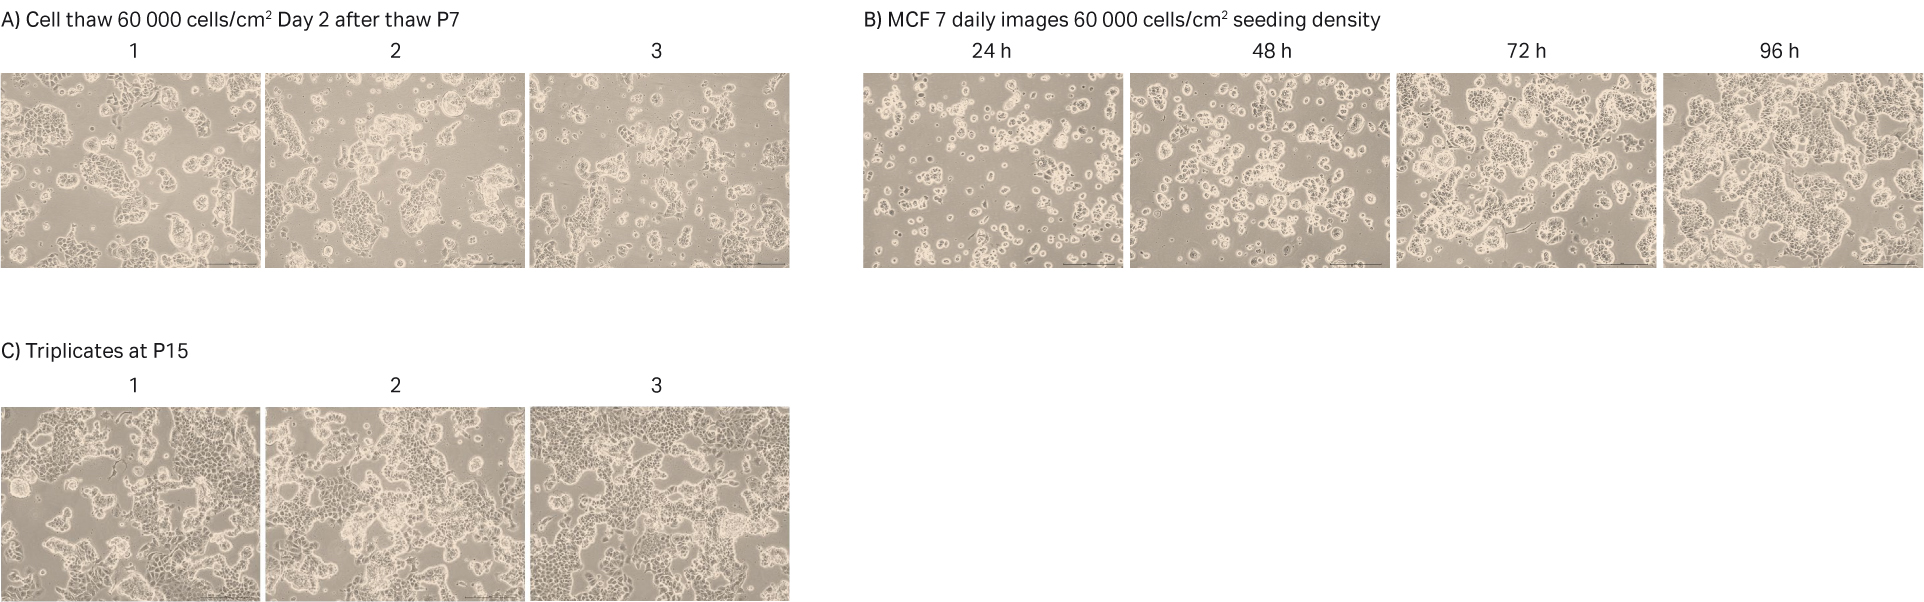
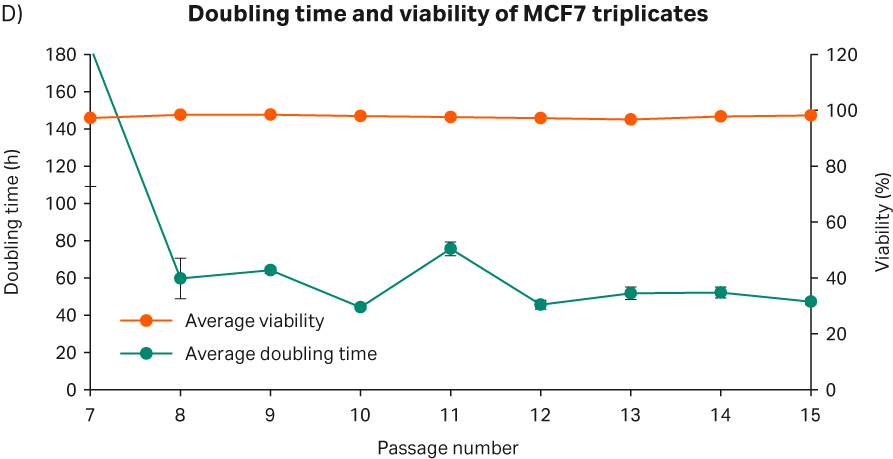
Fig 14. A) MCF 7 cell morphology after cell thaw. B) The daily images of MCF 7 cells with 60 000 cells/cm2 seeding density. C) MCF 7 cell morphology at passage 15. D) The doubling time and viability profile of triplicate MCF 7 cells from passages 7 to 15.
Part 1: Evaluate direct media adaptation
The first thaw of the A549 cells was performed as described in Materials and methods into HyClone™ Ham's F12 medium, Kaighn's modification (SH30526.01) with 10% HyClone™ Characterized FBS, US origin (SH30071.03). We counted the cells at thaw and could determine 0.25 × 10⁶ viable cells and post-thaw viability of 78%. The recovery after cell thaw was followed by daily microscopic observation to assess the cell morphology and cell confluency (Fig 15). As shown in the images of days 1 and 2, the initial recovery was slow. For that reason, we changed the medium on day 2. The first passaging was performed on day 5 when the cells reached 80% to 90% confluency.
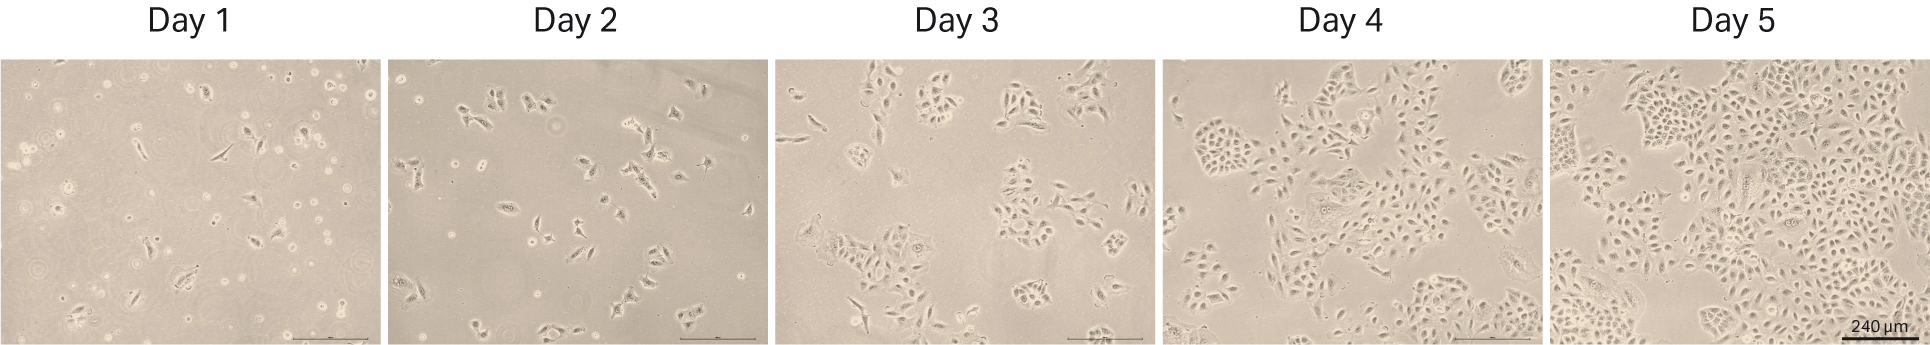
Fig 15. A549 cell morphology and confluency 1 to 5 d after direct thaw in HyClone™ medium.
After thawing, the cells were passaged every 3 to 4 d until passage 16. Doubling time and viability are shown in Figure 16A. When the cells reached passage 6 and generation 18, the cell stocks were prepared for the second part of the study with 2.5 MVC/vial. The cell morphology from representative images are shown in Figure 16B.
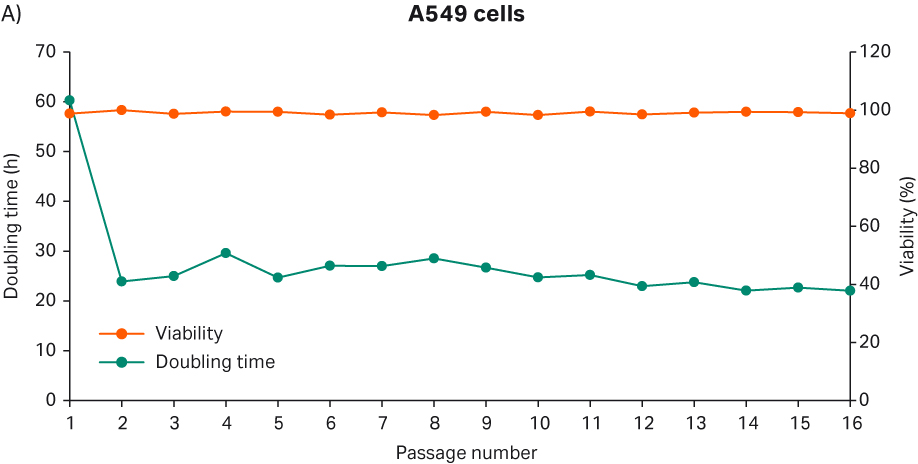
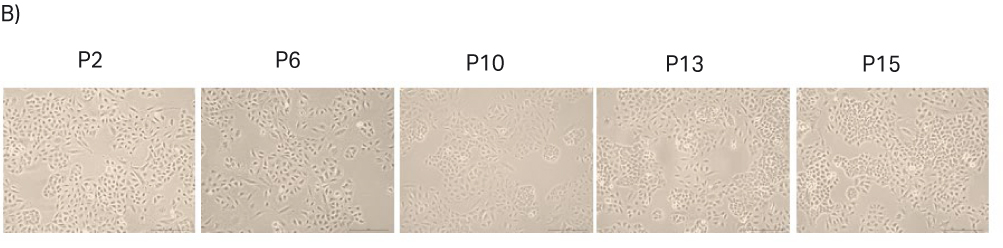
Fig 16. A) Doubling time and viability of A549 cells from thaw to passage 16. B) A549 cell morphology and confluency at different passages. The scale bar is 240 µm for all the images. which were taken with the 10× objective.
Part 2: Evaluate robustness and reproducibility
After cell thawing, A549 cells were kept in culture in triplicate, starting with generation approx. 19 and passage 7, until they reached passage 20 and generation 67. The morphology of the cell cultures were monitored during the whole culture period of 48 days (Fig 17A-C). The viabilities of the triplicate cultures were above 98% (Fig 17D). From passage 8, the cultures had an average doubling time of approx. 23 h (Fig 17D).
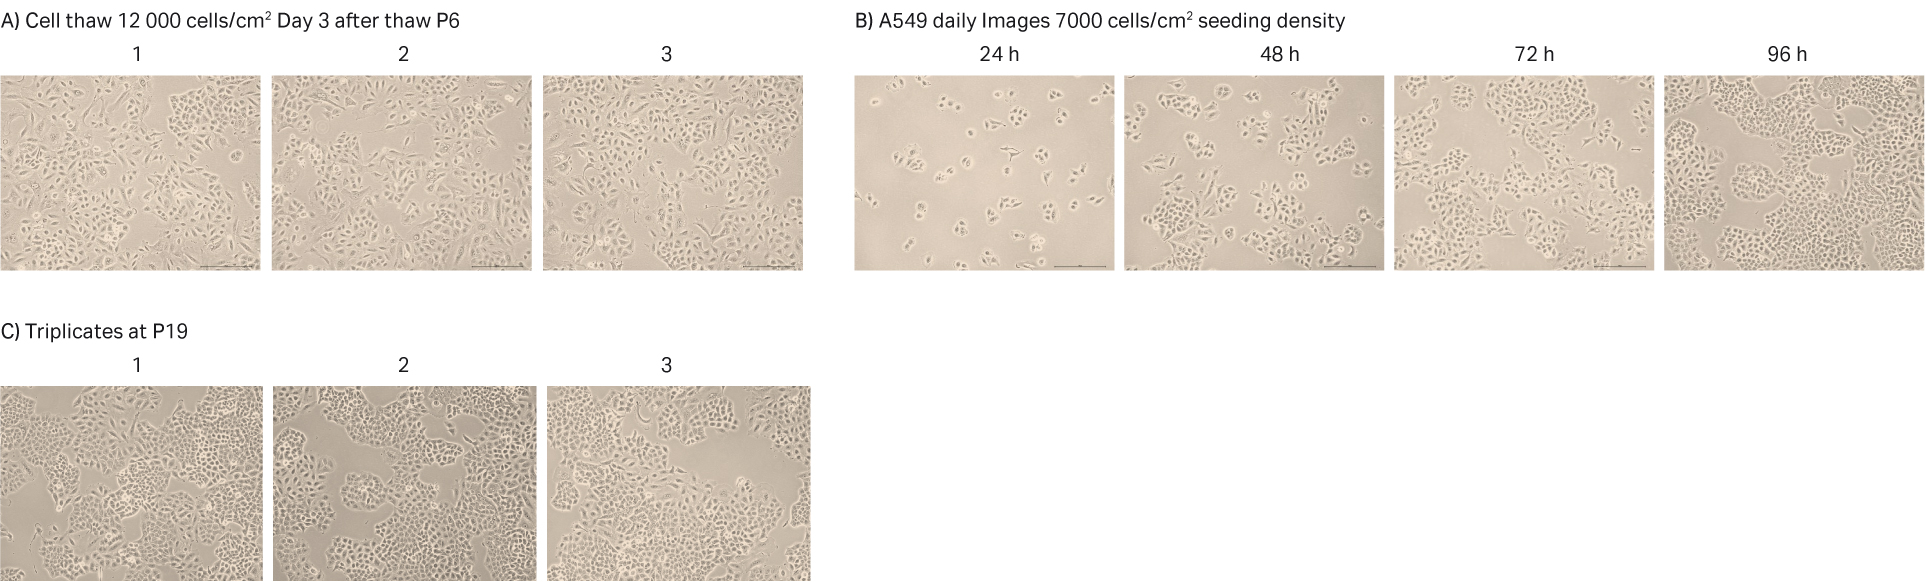
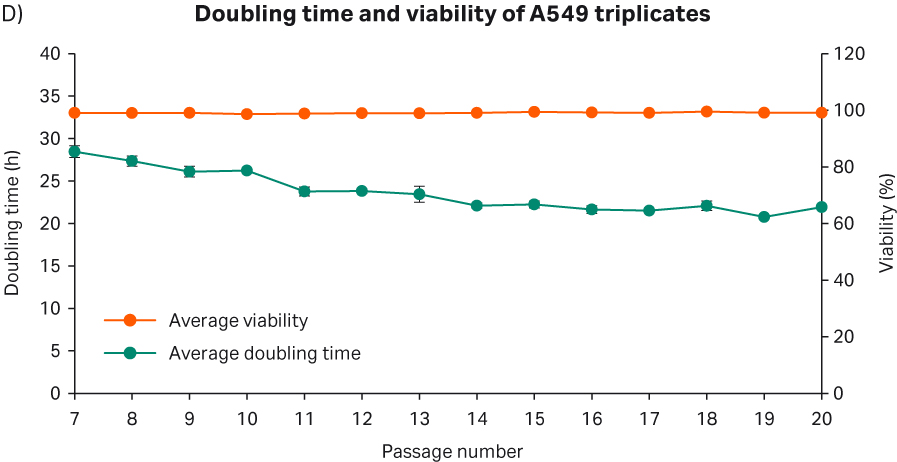
Fig 17. A) A549 cell morphology after cell thaw. B) The daily images of A549 cells with 7000 cells/cm2 seeding density. C) A549 cell morphology at passage 19. D) The doubling time and viability profile of triplicate A549 cells from passages 7 to 20.