The current global demand for biopharmaceuticals is over $300 billion USD, with an estimated growth of at least 12% annually. One of the fastest growing areas of biopharmaceuticals are mRNA and viral vectors — a fundamental prerequisite for both of these is a reliable source of high-quality plasmid DNA (pDNA). For both gene therapy and DNA vaccine applications, clinical grade pDNA with a percentage of supercoiled pDNA above 80% is usually required (1).
Plasmids used in bioprocess applications are commonly in the range of 5 to 20 kilobases (kb). Here we present a scalable single-use two-step pDNA purification process using a 7.3 kb model plasmid. We will also show that in comparison to a three-step purification process, the two-step process provides both a significant reduction in process time and improved sustainability.
Introduction
pDNA is an important genetic engineering tool used to clone and amplify or express genes for biotechnology applications. pDNA of good manufacturing practice (GMP) grade has many applications including DNA vaccines and gene therapy, with the production of viral vectors and mRNA being dependent on the production of pDNA (1).
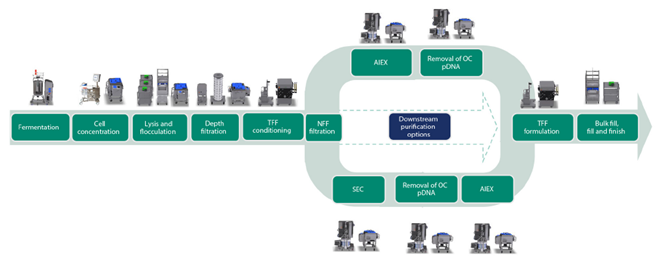
The main aim with the presented work was to design a process with a higher productivity compared to the three-step purification process. An overview of the process that was developed is shown in Figure 1 and includes the capture of pDNA using a Mustang™ Q XT single-use membrane adsorber, followed by purification of supercoiled (sc) pDNA with Capto™ PlasmidSelect resin. The benefit of using the Mustang™ Q XT membrane adsorber is a significantly higher binding capacity comparable to resins with the same ligand. This is mainly due to the size of pDNA, which allows for very limited access to the internal volume of the resin beads. Consequently, a large proportion of the ligands derivatized on resin beads are not accessible for binding pDNA, which severely impacts the binding capacity.
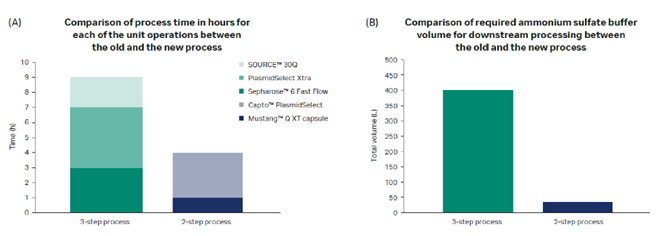
In addition to a higher binding capacity, the Mustang™ Q XT membrane adsorber allows convective flow, providing a significantly higher productivity. The two-step chromatography process meets large-scale regulatory manufacturing requirements and is scalable up to at least a 50 L fermentation volume. Figure 2 provides a comparison to our previous three-step purification process.
Fig 1. Process overview for pDNA. The two-step chromatography process is shown in the upper track. The lower track shows an earlier described three-step chromatography process.
Fig 2. Calculated benefits for pDNA downstream process at 50 L scale.
The economy calculations show that the new process provides a significant reduction in process time and improved sustainability.
Upstream and midstream considerations
In order to meet process goals, it is important to consider the whole process from fermentation to final filtration. For example, excessive addition of antifoam or an excessive feed profile resulting in glycerol accumulation can influence the ratio of open circular (OC) to SC pDNA during fermentation. In addition, lysis parameters are critical to maximize the process efficiency, both to maximize the yield and to maintain the stability of the pDNA and to reduce the levels of host cell proteins (HCP), endotoxins, and genomic DNA (gDNA), where special care must be taken to avoid fragmentation of gDNA. The addition of a CaCL2 precipitation step following lysis but prior to the flocculation lift with ammonium hydrogen carbonate will efficiently reduce the levels of RNA. All together, these steps are crucial to set up the downstream process for success.
For more information see Scaling up an E. coli upstream process for plasmid DNA production — from 2.5 to 160 L fermentors.
Fig 3. High-capacity quick chromatography cycle with Mustang™ Q XT adsorber. (A) Lab scale Mustang™ Q XT5 with a load of 12 mg/MV (membrane volume) and step yield of 58%. (B) Production scale Mustang™ Q XT140 with a load of 8.95 mg/MV and step yield of 67%.
Fig 4. Removal of OC pDNA using Capto™ PlasmidSelect. (A) Lab scale Capto™ PlasmidSelect 18 mL with a load of 2.8 g/L, 220 cm/h sample application, 120 cm/h elution, and step yield of 77%. (B) Production scale Capto™ PlasmidSelect 1 L in a ReadyToProcess™ prepacked column with a load of 0.85 g/L, 179 cm/h sample application, 90 cm/h elution, and step yield of 72%.
Results and discussion
The presented process was first developed using a 15 L stainless steel fermentation reactor and was later scaled up to 50 L using an XDR50 single-use reactor. The downstream process included capture of pDNA using Mustang™ Q XT140 membrane adsorber (Fig 3). This was followed by removal of OC pDNA using Capto™ PlasmidSelect (Fig 4). The process step yields are shown in Table 1.
Table 1. Process performance
| Fraction | Approximate fraction weight (g) | Concentration (mg/mL) | pDNA (mg) | Step yield (%) | Total yield (%) |
| Lysate | ~120 000 | 0.01 | 1411 | N/A | N/A |
| UF/DF HF (500 Mr, 1.15 m2) | ~9 000 | 0.14 | 1303 | 92 | 92 |
| NFF (0.5 µm, Load 2018 L/m2) | ~9 000 | 0.14 | 1277 | 98 | 90 |
| Mustang™ Q XT140 capsule eluate | ~2 000 | 0.40 | 854 | 67 | 60 |
| Capto™ PlasmidSelect eluate | ~4 000 | 0.15 | 618 | 72 | 44 |
| Final UF/DF HF (500 Mr, 290 cm2) | ~500 | 1.04 | 482 | 78 | 34 |
| Final 0.2 μm sterile filtration | ~400 | 1.04 | 442 | 92 | 31 |
DF: Diafiltration
HF: Hollow fiber
NFF: Normal flow filtration
UF: Ultrafiltration
Analytics
A comprehensive analytical package was applied to samples throughout the process. The single-use two-step process met FDA guidelines (Table 2). Thiophilic aromatic adsorption chromatography using Capto™ PlasmidSelect can also be used for analysis of process samples and despite not being an orthogonal technique, it performs equivalently to capillary gel electrophoresis (CGE), as shown in Table 3 (2).
Table 2. The production scale pDNA process meets FDA guidelines
| Fraction | SC pDNA (%) | E. coli DNA (µg gDNA/mg pDNA) | E. coli HCP (µg HCP/mg pDNA) | Endotoxin (EU/mg pDNA) |
| Lysate | 91 | 16.4 | 2 789 | 2 581 641 |
| UF/DF | 98 | 1.0 | 7.7 | 122 |
| NFF | 97 | 1.7 | 5.1 | 87 |
| Mustang™ Q XT140 eluate | 97 | 1.4 | < 1* | 4 |
| Capto™ PlasmidSelect eluate | 99 | 0.5 | < 1* | < 7* |
| Final UF/DF | 99 | 0.6 | < 1* | < 1* |
| Final filtration 0.2 µm | 100 | 0.6 | < 1* | < 1* |
| Acceptance criteria Cytiva | > 95 | < 2.0 | < 1.0* | < 10 |
| Acceptance criteria US FDA† | > 80 | < 10 | < 1.0* | < 40 |
| Attribute | pDNA quality | E. coli residual DNA | E. coli HCP | Endotoxin |
| Method | Capto™ PlasmidSelect | ddPCR | Gyrolab® assay | LAL test |
*Results for HCP and endotoxin were below LOQ, but were set to LOQ to be able to calculate result/mg pDNA
†Considerations for Plasmid DNA Vaccines for Infectious Disease Indications 2005D-0047
HCP: Host cell proteins
LOQ: Limits of quantification
UF: Ultrafiltration
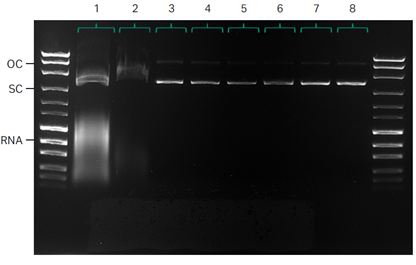
Analysis by agarose gel electrophoresis (AGE) shows almost undetectable levels of OC DNA after UF/DF and demonstrates the efficient reduction of RNA by employing a CaCl2 precipitation step following lysis (Fig 5).
Process selection
The scale and quantity of plasmids required for different pDNA applications varies. However, the purification process can be optimized to meet the desired purity and concentration requirements. Such optimization may include many different parameters and considerations, such as process time, scalability, flexibility, process control, batch cost (OpEx), footprint, environmental impact, and waste handling.
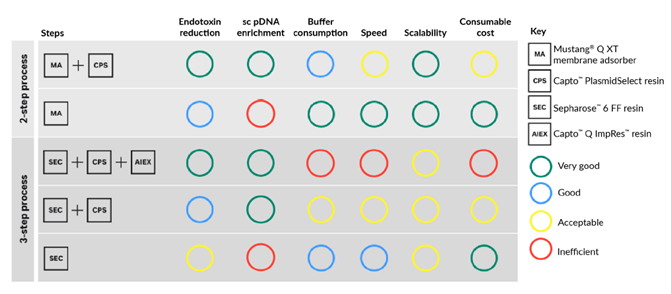
Another important parameter for choice of downstream process is the upstream feed material. The feed material used in this study already had over 90% SC DNA content after the midstream step. In this case, the Capto™ PlasmidSelect step to enrich SC DNA may rather act as a method to remove endotoxin. In other cases where the initial feed material has another composition, enrichment of SC DNA may be crucial to meet the desired percentage of SC DNA. In essence, the parameters and considerations are usually different for each process. Figure 6 provides guidance on selecting a process for your specific plasmid DNA requirements. For example, if scalability, endotoxin reduction, enrichment of SC DNA and low buffer consumption is important, the two-step chromatography process with Mustang™ Q XT membrane adsorber and Capto™ PlasmidSelect resin to purify pDNA is advantageous.
Table 3. Rapid analysis of process samples for OC/SC pDNA ratio determination can be performed with analytical mode thiophilic aromatic adsorption chromatography using Capto™ PlasmidSelect.
| Fraction | SC (%) by Capto™ PlasmidSelect | SC (%) by CGE |
| Mustang™ Q XT140 | 97 | 97.9 |
| Capto™ PlasmidSelect | 99 | 98.9 |
| Final filtration | 100 | 98.8 |
1. Lysate
2. Depth filtration
3. UF/DF
4. NFF
5. Mustang™ Q XT140
6. Capto™ PlasmidSelect
7. Final UF/DF
8. 0.2 μm filtration
Fig 5. Quality control by agarose gel electrophoresis (AGE).
Fig 6. Selection guide for two- and three-step downstream plasmid purification processes.
Conclusions
The new two-step plasmid process is scalable and meets FDA guidelines, and achieved:
- Efficient RNA reduction by CaCl2 precipitation following lysis.
- Rapid capture of pDNA with Mustang™ Q XT membrane, followed by selective purification of SC pDNA by Capto™ PlasmidSelect resin.
- Significant reduction in production time for downstream and improved sustainability with reduction in ammonium sulfate consumption.
See Bioprocessing strategies for current and new biotherapeutics to learn more.


