Building a clearer picture through continuous monitoring of pollution and air quality
Air pollution is a serious public health issue. Ninety percent of the world’s population now lives in areas where air quality is considered to be below World Health Organization (WHO) standards (1). This amounts to an average nine-month reduction in life expectancy, worldwide.
Studies are now indicating that air pollution can be linked to a whole range of health issues beyond respiratory diseases. There is also a growing body of evidence linking poor air quality to reduced crop production (2, 3).
Although it is still challenging to gauge the full extent of the consequences of air pollution, governments around the world are starting to recognize the seriousness of this problem, introducing measures to curb pollution.
The UK government, for example, has asked several cities, including London, to introduce clean air zones, and the US Environmental Protection Agency (EPA) has set continuingly stricter national standards for particulate matter levels since 1971 (4).
China is a notable example of the air quality challenge. It is a country where rapid industrialization has resulted in serious pollution problems (5).The Air Pollution Action Plan, which China introduced in 2013, has already been successful in improving air quality in some parts of China and was recently updated in 2018 to include more cities.
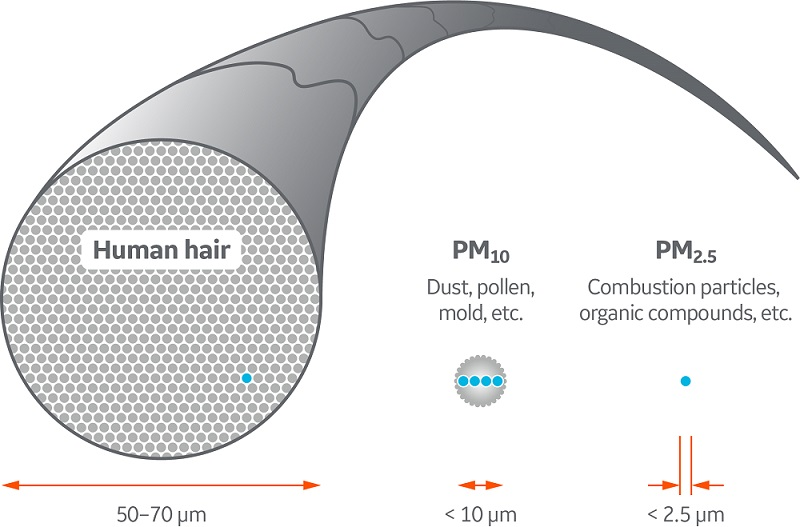
However, considerable progress is still needed, and PM2.5 particles (those ≤2.5 µm) are of particular concern, not just in respiratory health but in a wider context.
Learn about the advantages of using Whatman PM2.5 Air Monitoring Membrane Filters
What is PM2.5?
A serious component of air pollution are particles less than 2.5 µm, referred to as PM2.5. These particles are being linked to an increasing range of human diseases and ecological problems. As such, continuous monitoring of PM2.5 levels helps gauge the full extent of problems caused by this particularly serious form of air pollution.
PM2.5, as well as PM10 particles (those ≤10 µm) are often produced as a result of burning liquid or solid fuels, released in industrial processes, and can consist of a variety of substances. There is increasing concern around the effects of PM2.5 both on human health and ecology.
The seriousness of PM2.5 is linked to its size. The particles are smaller and lighter than PM10 meaning they stay in the atmosphere longer and are also small enough that they are thought to be able to pass into the bloodstream once inhaled (6, 7). Table 1 shows a comparison of PM2.5 and PM10 particle properties.
As a consequence, PM2.5 is being linked to an increasing number of diseases, beyond respiratory diseases. For example, Alzheimer’s, heart disease, diabetes, and cancer (8).
Table 1. Properties of PM2.5 and PM10 particles
| Property | PM2.5 | PM10 |
|---|---|---|
| Particle size: | <2.5 µm | <10 µm |
| Type: | Solid or liquid | Solid or liquid |
| Distance traveled from source: | 100s of miles | <30 miles |
|
Sources: |
|
|
| Furthest distance into the airways? | Deep into the lungs and even into the blood. | Usually deposit in the narrow passages in the lungs. |
| 2013 US EPA standards annual limits | 35 µg/m3 | 150 µg/m3 |
Where does PM2.5 come from?
There are a variety of sources for PM2.5. It can either be released directly from a source into the air, or form as a result of chemicals released into the atmosphere reacting to form particles. Coal burning power stations, petrol and diesel fumes, wood burning, airplane exhausts, and other industrial processes are all common sources.
The effect of PM2.5 on crop production
The impact of PM2.5 goes beyond human health. A recent study found evidence that high levels of PM2.5 in the atmosphere can block out sunlight, reducing the rate of photosynthesis, and therefore growth, in crops (2).
The study focused on an area in eastern China called the North China Plain. Heavy industry in this region means that air pollution is particularly severe. Between the years 1999 and 2011, the study found evidence that 87% of farmland studied across the North China Plain experienced a reduction in photosynthesis due to PM2.5 pollution.
Although it requires further study, the work highlights the possibility that PM2.5 levels could affect photosynthesis in crops, and so have an indirect effect on food production and a country's ability to feed its population.
Another study found that a recent drop in PM2.5 levels in China resulted in an increase in ground-level ozone, another air pollutant (3). Ozone is believed to have a damaging effect on crops, and so this study suggests that PM2.5 has an indirect beneficial effect on crop production by absorbing gases that form ozone.
These two studies demonstrate the complex nature of PM2.5, presenting opposing though not necessarily mutually exclusive views on its effect on crop production. Indeed, there might not be one straightforward answer, and the existing data highlights the need for further studies.
Studying PM2.5
Originally, research into PM2.5 focused on links with respiratory diseases, such as asthma and lung cancer. This made sense given that it is the respiratory system that comes into direct contact with PM2.5, once inhaled. Now, PM2.5 is a research interest that traverses a diverse range of areas including neuroscience, cardiovascular research, cancer research, and diabetes research.
The EU reference method for measuring PM2.5 (EN 12341:2014) is gravimetric determination, which measures the change in mass of a specialized PM2.5 filter as particles are captured (9). This approach provides an indication of the density of airborne particulate matter, specifically PM2.5, in the environment of the sample collection area.
Automated robotic sampling is also supported by EU standards (EN 16450:2017), and robotic air sampling and pollution monitoring systems can be found throughout the EU. These similarly use specialized filters to capture and analyze particulate matter.
Perform gravimetric determination of particulates with Whatman PM2.5 Membrane Filters
Whatman PM2.5 PTFE membrane filters facilitate robotic sampling
To build up an accurate picture of how PM2.5 might contribute to health and ecological trends, continuous air quality monitoring is needed, often over large geographical areas. Although the study linking PM2.5 to wheat photosynthesis used remote sensing, relying on satellite imagery, continuous air monitoring requires air samples on the ground with appropriate filters.
Indeed, Whatman PM2.5 PTFE membrane filters are specifically designed for air quality monitoring with several features that simplify sample collection and analysis.
Polypropylene support rings incorporated into the filters facilitate robotic sampling. Each filter is also sequentially numbered, helping to identify and track each unit. The thermostable design makes sure the filters stay flat, even if left out in the field, and the low weight design supports accurate mass-based analysis of PM2.5.
This reliability is especially important when carrying out research on PM2.5. Identifying air quality trends requires making year-on-year comparisons, and so accurate and consistent data needs to be collected over several years.
Analyze particulate matter with high-purity Whatman PM2.5 Air Monitoring Membrane Filters
Cytiva provides high-quality filtration products to support all aspects of environmental monitoring and research. The Whatman Filter Selector app provides a guide for identifying the most appropriate filter for an application, while the Cytiva Scientific Support team is available to help with all other inquiries.
For other filter-based workflow solutions, review the Filtration for Air Monitoring guide.
References
- Air Quality Guidelines. Global Update 2005, World Health Organization [online] (2006).
- Gu, X. et al. Reduction of wheat photosynthesis by fine particulate (PM2.5) pollution over the North China Plain. Int J Environ Health Res 28(6), 635-641 (2018).
- Li. K. Anthropogenic drivers of 2013–2017 trends in summer surface ozone in China. PNAS 116, 422-427 (2018).
- Table of Historical Particulate Matter (PM) National Ambient Air Quality Standards (NAAQs), EPA [online] https://www.epa.gov/pm-pollution/table-historical-particulate-matter-pm-national-ambient-air-quality-standards-naaqs (14 April 2016, posting date)
- Sun, J. and Zhou, T. Health risk assessment of China’s main air pollutants. BMC Public Health 17(1), 212 (2017)
- Particulate Matter Emissions, EPA [online] https://cfpub.epa.gov/roe/indicator.cfm?i=19 (06 February 2015, posting date).
- Zhang, X. PM2.5 Meets Blood: In vivo Damages and Immune Defense. Aerosol and Air Quality Research 18, 456-470 (2018).
- Unearthed: Much of the world lives with dangerous levels of air pollution, Greenpeace [online] https://unearthed.greenpeace.org/2019/04/04/global-data-air-pollution-india-china/ (04 April 2019, posting date)
- Fine Particulate Matter (PM2.5) in the UK, The Air Quality Expert Group for DEFRA [online] https://uk-air.defra.gov.uk/library/reports?report_id=727 (11 December 2012, posting date)
Related Products