Noise in laboratory imaging
Noise is an unwanted signal component that can disrupt imaging as much as sound. In images, noise often takes the form of light or electrical signals that do not originate from the sample of interest but instead come from the measurement apparatus or background.
Charge-coupled device (CCD) imaging systems are commonly used in laboratories for studying everything from cell colonies to protein bands in Western blots. These systems contain CCD image sensor chips that convert photons to quantifiable electrical signals used to produce a digital image (Fig 1).
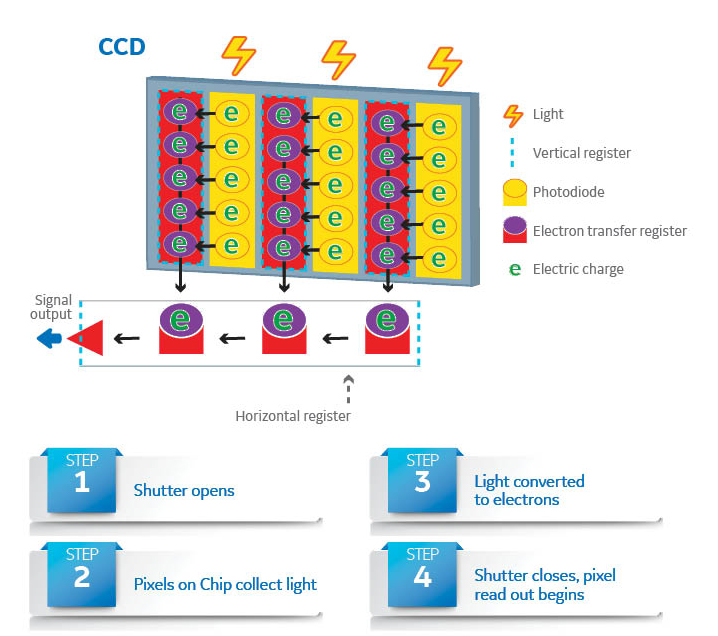
Fig 1. Components of a CCD imaging chip and conversion of photons hitting sensor pixels to an electrical signal used to form a digital image. As electric charge fills each photodiode, the signal is transferred to the vertical and then horizontal serial register before finally being converted to a digital signal.
There are several possible sources of noise introduced throughout the CCD imaging process:
- Photon noise is caused by the natural variability in the rate at which photons strike a pixel.
- Dark noise is a product of heat generated within the silicon layer of the CCD imager. The heat produces electrons, which can be detected as a signal.
- Read noise results from errors in the process of quantifying the electrical signal on the CCD.
In the case of Western blots, dark noise and read noise are distinct from the non-specific background signal that comes from blank areas of the blot or the photon noise from non-target proteins. The correction of these factors from the final image requires more than changes to the Western blotting workflow.
Amersham ImageQuant 800 imagers monitor the signal-to-noise ratio (SNR) and automatically adjust the operation to optimize final images, providing greater flexibility than traditional X-ray film detection.
The effect of SNR on laboratory imaging
SNR is a measure of the likelihood that the signal detected by each pixel on a CCD image sensor is a genuine signal of interest versus background noise. SNR is an indicator of overall imaging performance.
For Western blots, SNR is calculated as the ratio between signal intensity and noise of the local background for each band on the blot. If a blot contains relatively weak bands, a high SNR means these bands are more likely to be visible, and therefore potentially quantifiable, as compared to a low SNR state.
SNR, limit of detection, and linear dynamic range
SNR is directly related to the limit of detection. Simply put, if the signal is greater than the noise level, it is easier to detect. It is often equally important to quantify high signals from abundant samples. The range between the weakest bands and the maximum signal defines the linear dynamic range. Linear dynamic range is where the signal intensity detected by the imaging device is proportional to the amount of protein in a sample (Fig 2). A high linear dynamic range is essential for accurate analysis because it can help identify and quantitate large variances in protein levels found, for example, in cells cultured under different conditions.
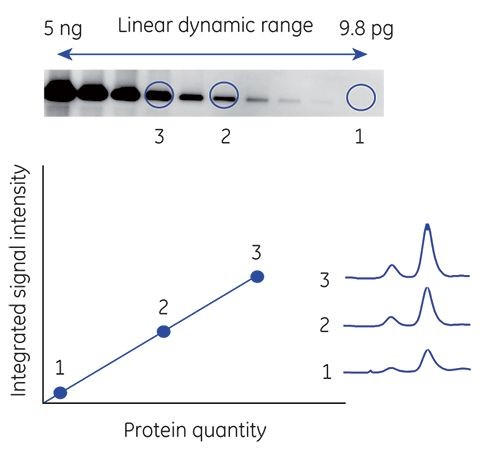
Fig 2. Linear dynamic range in Western blot imaging. Signal intensity on a blot is proportional to the amount of protein in a sample. Bands 1, 2, and 3 cover a range of signal intensities, but still fall within the linear dynamic range of the image.
Dynamic range is calculated as the ratio of maximum signal response (as is seen for the strongest band on a Western blot) compared to the weakest detectable signal (or average background on a Western blot image).
A low dynamic range can make it challenging to image high- and low-expressing samples on the same blot. Bands with strong signal intensity are more likely to become saturated and weak bands are more likely to be undetectable against the background, preventing accurate quantitation.
The upper and lower limits of detection (LOD) are the points at which a signal is too saturated or too weak, respectively, to reliably quantitate (Fig 3).
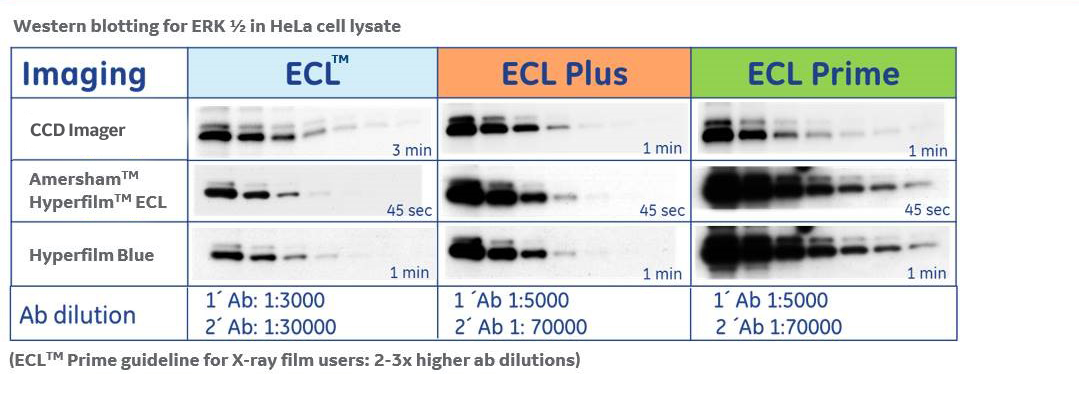
Fig 3. Limits of detection represent the thresholds at which signals either become too weak or too saturated to quantitate accurately.
Why is low noise good for imaging?
Minimizing the noise in Western blot images does two beneficial things:
- Improves the detection sensitivity and lower limit of detection, which increases the likelihood of detecting faint bands.
- Widens the linear dynamic range so that a wider spectrum of faint and strong bands can be imaged and accurately quantitated on the same blot.
SNR in film versus CCD imaging
Film has a narrow and highly variable dynamic range compared to digital CCD imaging. The narrow dynamic range means that strong bands quickly become saturated, while weak bands are not visible at short exposures. The dynamic range also varies with exposure time, meaning a range of exposure times are often required to cover the full spectrum of band intensities within each result.
To quantitate protein levels using film, the exposed films need to be converted into a digital image using a desktop scanner. Depending on the quality of the scanner, this process might not accurately capture the full range of signal intensities, further reducing the dynamic range available for analysis.
Conventional CCD imagers detect signal directly, eliminating the scanning step. Digital CCD images have a wider dynamic range than film, but the imaging process still typically requires exposure-time optimization.
Finding the optimal exposure time for CCD imaging
Modern CCD digital imaging systems offer various imaging options, however the user often still needs to use a trial-and-error approach to find the optimal exposure time for maximum SNR. This exposure time is also a component that is likely to vary between and even within the same experiment.
Enhanced chemiluminescence (ECL), the most common method of visualizing Western blots, adds another variable to this trial-and-error process by relying on an enzymatic reaction to produce a signal, the strength of which changes over time as the substrate is consumed (Fig 4). This signal strength variability continually changes the SNR, making it challenging and time consuming to find the optimum exposure time. Eventually, the signal will become too faint for detection and the blot would need to be repeated in full or by stripping and reprobing.
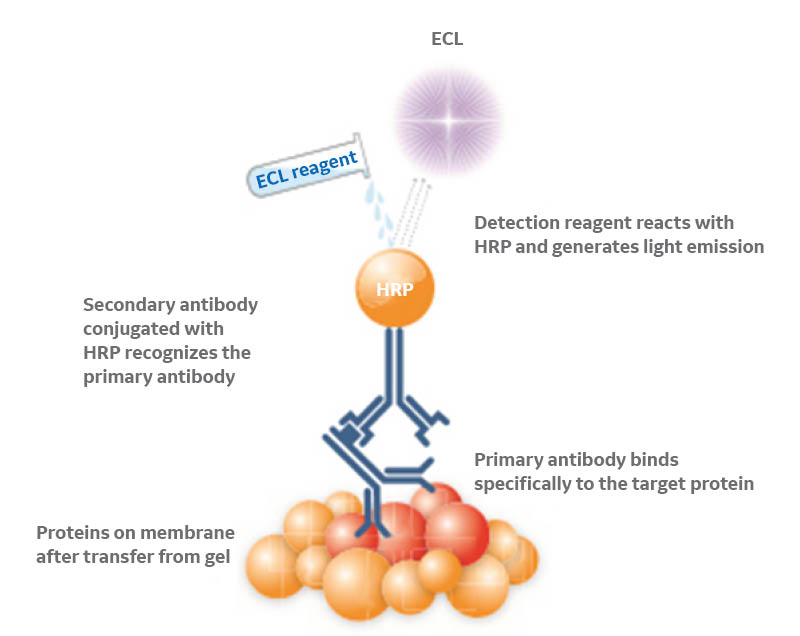
Fig 4. Chemiluminescence-based protein detection. Horseradish peroxidase (HRP) catalyzes the conversion of the ECL substrate into a sensitized reagent, which on further oxidation produces an excited state that emits light (428 nm) when it decays.
Conventional CCD digital imaging systems produce images with intensities based on the total volume of photons that hit each CCD sensor pixel over a given period. It would make sense to assume that long exposures mean more photons and stronger signals than short exposures, producing images that are straightforward to analyze. Longer exposures would, in theory, also increase the chance of detecting signals from weak bands.
However, long exposures can also result in stronger background and the risk of unintentionally saturating strong signals. On conventional CCD digital imaging systems, this can make it challenging to capture both high- and low-intensity signals from the same blot.
Not surprisingly, there has been a drive in recent years to develop new approaches and algorithms to automatically determine the optimal exposure time for maximum SNR. Variations of these algorithms can be found in several CCD imaging systems on the market, however, these single exposures are unlikely to provide a truly broad linear dynamic range.
A potential alternative to taking a single exposure might be to capture both high- and low-intensity bands with different exposures and stack them to produce a high dynamic range (HDR) image. This approach requires a certain level of alteration or modification of the raw image data and could create a new challenge in demonstrating the accuracy and reliability of any resulting quantitation.
Using image averaging to minimize noise
The concept of image averaging is not new. In CCD-based laboratory imaging, image averaging provides a method and opportunity to maximize SNR through combining data from multiple exposures without altering or modifying the actual captured image. This approach essentially averages out the random noise between frames while leaving the true signal intact.
Image averaging can provide the sensitivity needed to detect low-intensity bands on a Western blot without risking saturation of high-intensity bands. In using this approach, there would also be no need for trial-and-error as exposures would be repeated and averaged with previous data until the SNR peak is reached.
Ultimately, the image averaging method greatly increases the likelihood of retaining all bands on a Western blot within the limit of detection and within a broad linear dynamic range, removing the need to repeat experiments or develop multiple blots.
Cytiva provides a range of solutions for optimizing Western blot imaging and workflows. To develop a deeper understanding of the methods and principles behind CCD imaging, access the Cytiva imaging principles and methods guide. For further support and inquiries relating to any aspect of the Western blotting or CCD imaging workflow, contact the Cytiva Scientific Support team.