Introduction
The use of SDS-PAGE to analyze protein samples on an ÄKTA™ system is the analytical method of choice to measure purity and confirm molecular weight, and to detect protein modifications such as glycosylation, hydrolysis, and degradation. With the densitometry mode on the Amersham ImageQuant™ 800 imager and ImageQuant™ TL analysis software (Fig 1) it is possible to quickly perform quantitative measurements and decide if the purification was satisfactory or if further optimization is needed.
The new ImageQuant™ TL 10 similarity score analysis allows you to quickly compare samples by eliminating user-bias and rank similarity when compared to a reference sample. Different sample groups are displayed in a dendrogram view in the ImageQuant™ TL software for easy analysis. The similarity score is particularly well suited for analysis of broad and diffuse overlapping peaks, to check degradation of samples for example.
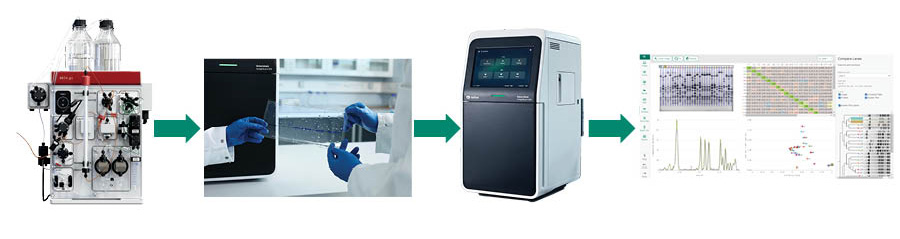
Fig 1. Workflow of protein purification, imaging, and analysis. The process involved protein purification on an ÄKTA go™, performing SDS-PAGE, followed by imaging using ImageQuant™ 800 imager, and image analysis and lane comparison using ImageQuant™ TL 10 software.
ÄKTA go™ is a compact and automated protein purification system based on protein liquid chromatography technology, which makes it suitable for affinity, size exclusion, and ion exchange chromatography. The Amersham™ ImageQuant™ 800 is a flexible imaging system ideal for sensitive chemiluminescence, fluorescence, and colorimetric detection. Together with the advanced and automated image analysis software, ImageQuant™ TL 10, it can be used for gel and blot, array, and colony analysis. Special features include comparison of lanes in a gel and the option to analyze samples in a 21 CFR Part 11 regulated environment using the GxP module if needed.
In this article, we optimize the stability and purification process of recombinant human Interferon alpha/beta receptor 1 (rhIFNAR-1). The interferon alpha/beta receptor 1, is a membrane receptor that binds type I interferon cytokines such as IFN-α and IFN-β, which result in an anti-viral immune response. The samples were purified on an ÄKTA go™ system and then separated using SDS-PAGE. Then the gels were imaged using ImageQuant™ 800 imager and analyzed using ImageQuant™ TL 10 image analysis software to compare and analyze incubation times and temperatures. The glycosylation of the target protein gained from transfection in mammalian ExpiCHO cells was also evaluated by comparing the purified target protein with purified target protein after the glycosylations had been removed.
Materials and methods
rhIFNAR-1 was expressed in ExpiCHO mammalian cells to gain glycosylations. Some of the samples were then deglycosylated using the Protein Deglycosylation Mix II (New England Biolabs). The samples were purified from lysed cell supernatant, using an ÄKTA go™ chromatography system. During purification, the target protein was eluted for 4 hours or 18 hours at room temperature (RT) or at 4°C (in a cold room). The fractions collected during purification (Table 1) were mixed with Coomassie™ Brilliant Blue, run on an SDS-PAGE gel, and imaged using the calibrated densitometry mode on the ImageQuant™ 800 system. rhIFNAR-1 has a molecular weight of approximately 47 kDa deglycosylated, and 70 to 90 kDa glycosylated.
Table 1. Fractions loaded into each lane in the SDS-PAGE gel. Treated indicates that the protein has undergone deglycosylation, and untreated indicates that the original glycosylations are intact.
| Lane |
Sample |
Lane |
Sample |
| 1 and 25 | Amersham™ LMW SDS marker | 8 and 19 | Flow through, 4°C |
| 2 and 13 | Supernatant, prior to purification | 9 and 20 | Column wash 1, 4°C |
| 3 and 14 | Flow through, RT | 10 and 21 | Elution, treated, 4°C |
| 4 and 15 | Column wash 1, RT | 11 and 22 | Elution, untreated, 4°C |
| 5 and 16 | Elution, treated, RT | 12 and 23 | Column wash 3, 4°C |
| 6 and 17 | Elution, untreated, RT | 24 | Control, treated Fetuin |
| 7 and 18 | Column wash 3, RT |
Using ImageQuant™ TL 10 analysis software the SDS-PAGE gel can easily be analyzed by defining lanes and bands, which are then compared and given a similarity score. The gel image was used to determine the purity as well as the stability of the target protein at different temperatures and incubation times.
By using the compare application in ImageQuant™ TL 10 analysis software, which groups similar lanes, glycosylations of rhIFNAR could be evaluated (Fig 5). The software also generates a similarity score for the lanes which is used to visualize closely related lanes in a scatterplot (Fig 6) or as a line profile (Fig 7).
Results
A resulting chromatogram from purification of the target protein is shown in Figure 2. The target protein was eluted for 4 hours at RT, which corresponds to the first peak on the chromatogram.
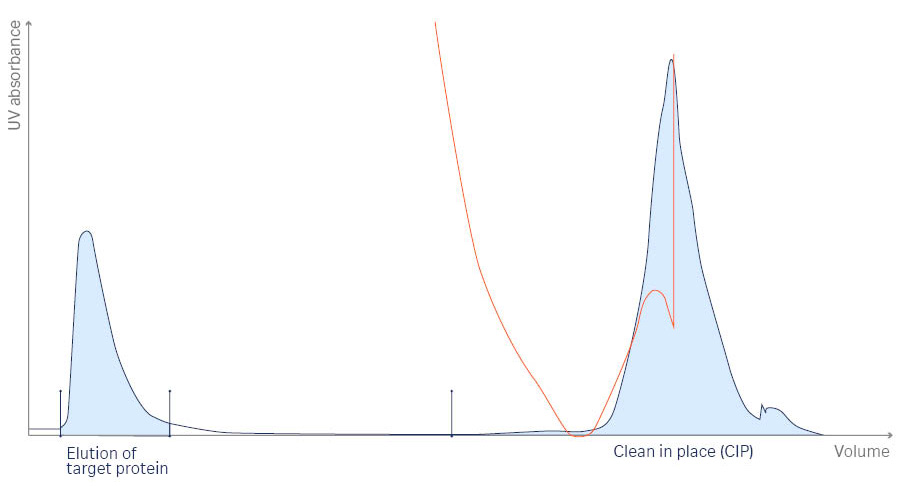
Fig 2. Chromatogram from the UNICORN™ software for the purification process of interferon alpha/beta receptor 1, with an elution step of 4 hours at RT. The chromatogram displays the target protein elution and clean-in-place (CIP) peaks. The yellow line indicates conductivity.
The SDS-PAGE gel shows that the bands containing deglycosylated target protein migrate further than the glycosylated target protein, which demonstrates that glycosylations were removed. The extra bands in the deglycosylated target protein lanes (lanes 5, 10, 16 and 21) are enzymes used during deglycosylation, see Figures 3 and 4.
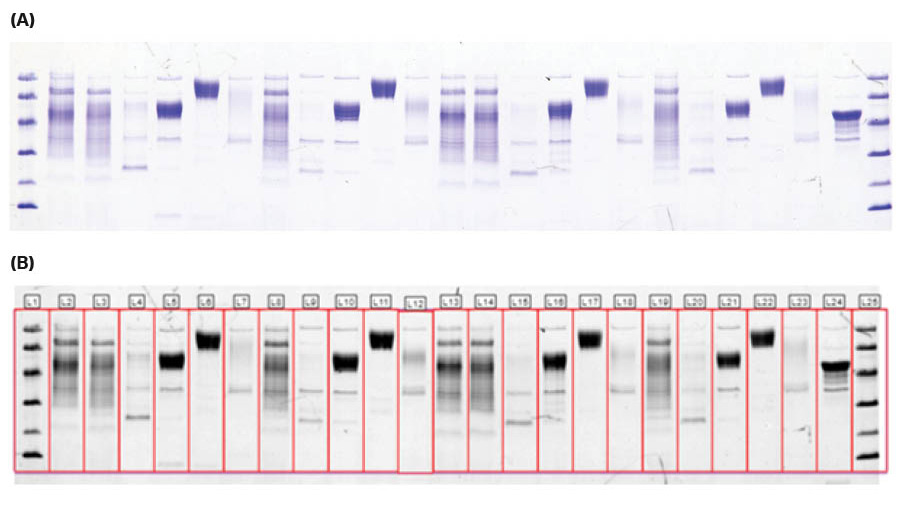
Fig 3. Coomassie stained SDS-PAGE gel, in (A) color imaged with ImageQuant™ 800 and (B) after lane detection using ImageQuant™ 10. The gel was run with the target protein after elution at RT or 4°C for 4 hours during ÄKTA go™ protein purification.
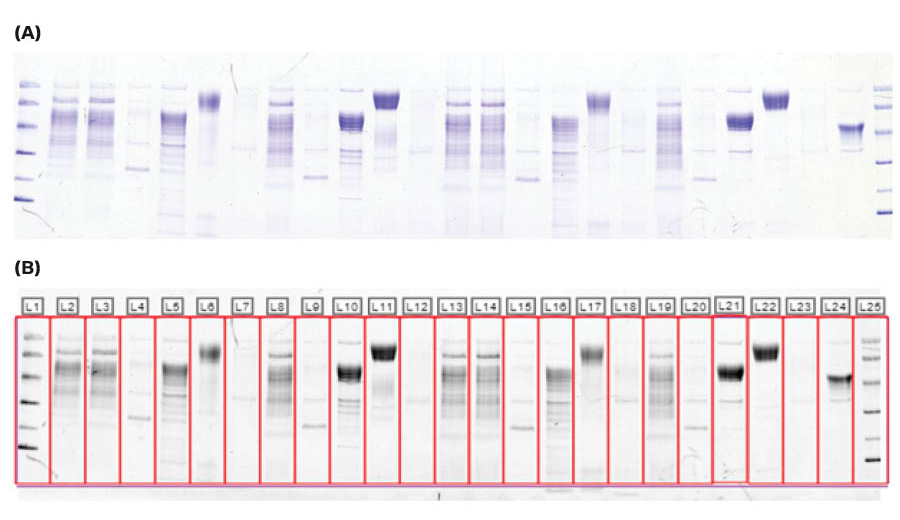
Fig 4. Coomassie stained SDS-PAGE gel, in (A) color imaged with ImageQuant™ 800 and (B) after lane detection using ImageQuant™ TL 10. The gel was run with the target protein after elution at RT or 4°C for 18 hours during ÄKTA go™ protein purification.
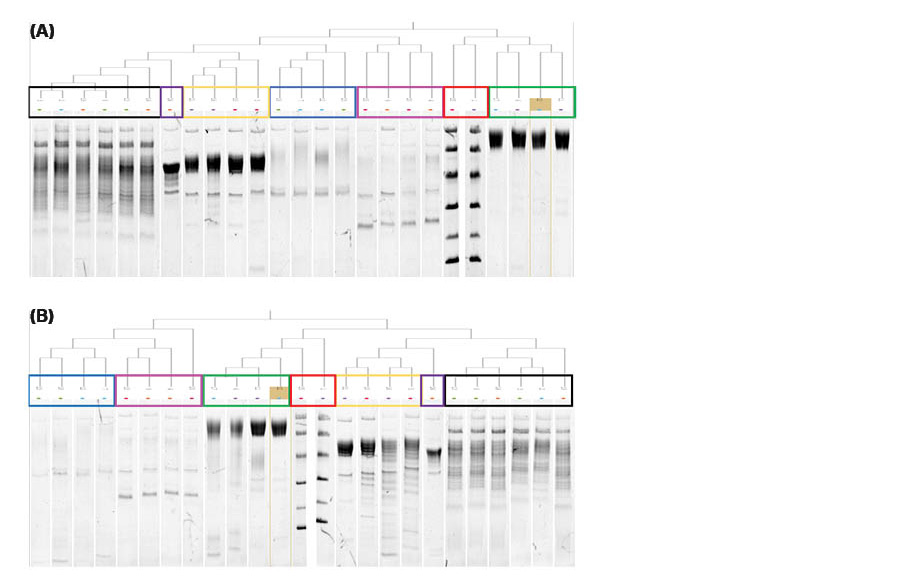
Fig 5. Dendrograms of the SDS-PAGE gels with the incubation time of (A) 4 hours and (B) 18 hours generated using ImageQuant™ TL 10. The lanes are grouped together and colored rectangles have been added for easy visualization and comparison. Each colored rectangle corresponds to the colored ovals in the scatterplot graphs in Figure 6. Lane 22 (4°C) is highlighted in the green rectangles and set as the reference lane in both dendrograms.
In Figure 5, the glycosylated target protein (green rectangle) are grouped together based on similarity and not due to proximity since the lanes are all spread out along the gel. Lanes 6 and 17 are even more closely grouped together, same as lane 11 and 22, based on similarity due to the elution temperature. The target protein in lane 6 and 17 were both eluted at RT and lane 11 and 22 at 4°C.
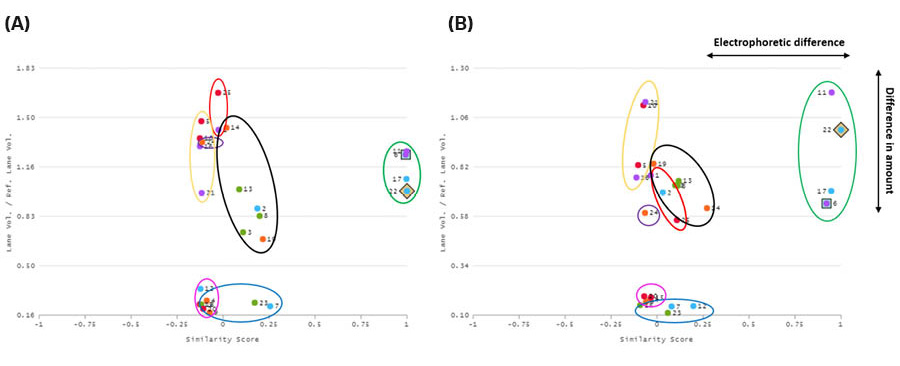
Fig 6. ImageQuant™ TL 10 was used to create scatterplots for the lanes in the SDS-PAGE gels, where the incubation during elution was either (A) 4 hours or (B) 18 hours. The x-axis shows the electrophoretic difference and the y-axis the difference in amount of protein. The lanes are grouped together and circled, where each colored oval corresponds to the colored rectangles in the dendrograms in Figure 5. Lane 22 was chosen as the reference lane (glycosylated target protein at 4°C) and lane 6 (glycosylated target protein at RT) as a comparison lane (green oval).
In the SDS-PAGE gel containing target protein eluted for 4 hours (Figs 3, 5A, and 6A) there is a very high similarity between the lanes containing the glycosylated target protein (lanes 6, 11, 17, and 22) regardless of temperature. The similarity scores for lanes 6, 11, 17, and 22 are all between 0.99 and 1.00. For example, lanes 22 (4°C) and 6 (RT) have a similarity score of 0.99. The line profile graph can be also used to visually compare specific lanes, e.g., lane 22 and 6 can be seen in Figure 7A. In Figure 7A, lanes 22 and 6 are close to identical which is also reflected in the very high similarity score.
When comparing the lanes for the target protein on the SDS-PAGE gel eluted for 18 hours (Figs 4, 5B and 6B) the similarity scores were high, between 0.92 to 0.98, but slightly lower than at 4 hours of elution. Lanes 22 (4°C) and 6 (RT) have a similarity score of 0.92. A difference in the amount of protein for the green oval containing the glycosylated target protein bands can be seen in Figure 6B compared to in Figure 6A. This difference is likely due to the degradation of the protein at RT (lanes 6 and 17) compared to at 4°C (lanes 11 and 22). The faint protein bands from protein degradation might not have been detected or have, as very small fragments, migrated out of the gel. The line profile graph can also be used to compare specific lanes, e.g., lanes 22 and 6 as seen in Figure 7B. In Figure 7B, lanes 22 and 6 are less identical than in Figure 7A, which is also reflected in the slightly lower similarity score. The degradation at room temperature (purple line) is evident both from the broadening of the main peak and the additional weak bands at lower Mw, which are not seen at 4°C (blue line).
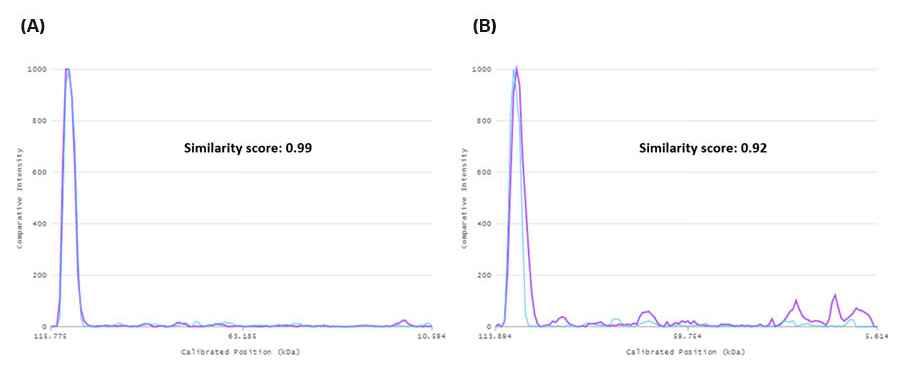
Fig 7. Line profiles for the SDS-PAGE gels incubated during glycosylated target protein elution for (A) 4 hours and (B) 18 hours. In both graphs, the bands of lane 22 (4°C, blue) and 6 (RT, purple) are included for comparison as well as the similarity scores.
Conclusion
In this article, we optimize the stability and purification process of rhIFNAR-1. The samples were purified on an ÄKTA go™ system and then separated using SDS-PAGE. Then the gels were imaged using ImageQuant™ 800 imager and analyzed using ImageQuant™ TL 10 image analysis software to compare and analyze incubation times and temperatures, and glycosylation of the target protein.
These results show that the lane comparison function in ImageQuant™ TL can easily be used to compare lanes in an SDS-PAGE gel. The comparison allowed detection of protein degradation at certain conditions, e.g., during optimization of protein purification, generate a similarity score, and quickly and clearly visualize the results. The dendrograms allowed for quick visualization of grouped lanes and identify similarities. The scatterplots showed grouped lanes based on their similarity scores as well as differences in the amount of protein for each lane due to, for example, protein degradation. In the line profile graph, differences such as protein degradation can also easily be visualized by comparing relevant lanes.
The comparison between length of elution time and temperature indicate that the target protein rhIFNAR-1 is stable after 4 hours at both RT and 4°C as well as after 18 hours at 4°C but starts to degrade after 18 hours at RT. This information can then be used to optimize the protein purification process for rhIFNAR-1 to avoid protein degradation.