Stephen Lock1,3, Whitney Smith1, Marcin Moczulski, and Gerry O’Beirne2, Kjell Larsson2 1SCIEX, Europe and 2Cytiva, Europe 3Horváth Csaba Memorial Laboratory, University of Pannonia, Veszprém, Hungary
Capillary isoelectric focusing electrophoresis (cIEF) was designed as a substitute for gel isoelectric focusing which is used for the separation of molecules by differences in their isoelectric point (pI). In monoclonal antibodies (mAb) quality control, cIEF is used for the detection of charge variants including lysine clipped and deaminated impurities of a protein which are process driven modifications of the parent mAb and has been used in quality control of mAb produced by biopharmaceutical companies for over 10 years (1).
cIEF works by mixing the protein sample with Ampholytes, which are mixtures of charged molecules with a range of isoelectric points (pI) that encompass the pI range of the protein sample. The whole mixture is then injected into a capillary, an electric voltage is applied, and the migration of the ampholytes encourages the proteins to move along the pH gradient until they reach a point where they have no charge (2). Pharmalyte ampholytes are mixtures of 600–700 different amphoteric compounds and are synthesized by the co-polymerization of glycine, glycylglycine, various amines, and epichlorhydrin. Because of their hydrophilic nature, Pharmalyte does not bind to proteins and are available in both wide and narrow pH ranges which make them ideal for tailor made mixtures to produce high resolution separation of protein charge variants.
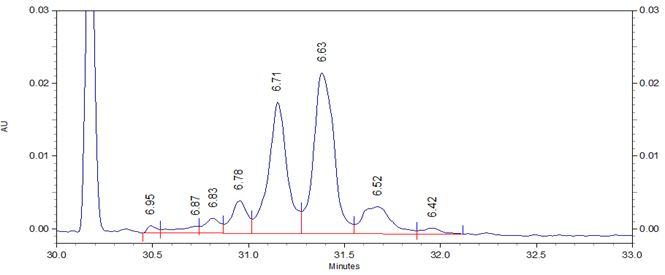
Fig 1. cIEF electropherogram for Vectibix highlighting a typical result obtained using Pharmalyte 3-10 and demonstrating a high-resolution separation of protein charge variants with the peaks labelled with the pI values for the charge variants.
Key benefits of using Pharmalytes for cIEF
- Reduction in background interferences speeding up analysis by improving peak integration.
- Improves data quality by providing highly reproducible pI values for protein charge variants.
- Highly adaptable providing different pI ranges to fine tune the separation for the target protein.
Materials
L-arginine free base (PN A5006-100G), iminodiacetic acid, 98% (PN 220000-25G), urea BIOXTRA, pH 7.5-9.5 (PN U0631-500G), glacial acetic acid, ≥99.85% (PN 695084-1L), phosphoric acid, 85 wt. % solution (PN 345245-100ML), sodium hydroxide, 1.0 N for HPCE (PN 72082-100ML) and Amicon Ultra-0.5 Centrifugal Filters with 10,000 NMWL were obtained from Merck (Darmstadt, Germany). Sample Loading Solution (PN 608082), Universal vials (PN A62251), universal vial caps (PN A62250), PCR vials (PN 144709), blank cartridge (PN 144738) and Advanced cIEF Starter Kit (PN A809960, which included eCAP Neutral Capillary (PN 477441), cIEF Gel buffer 100 mL (PN 477497) and pI Peptide Marker Kit PN A58481)] were from SCIEX (Framingham, MA, U.S.A.). Pharmalyte 3–10 (PN 17045601) and Pharmalyte 5–8: (PN 17045301) Pharmalyte 3–10 were obtained from Cytiva (Uppsala, Sweden).
A PA800 Plus Pharmaceutical Analysis CE system (SCIEX, Framingham, MA, U.S.A.) equipped with UV detector and 32 Karat software were used for all the experiments. Data acquisition and processing were performed using 32 Karat Software.
Vectibix (20 mg/mL) was, purchased from Distansapoteket, (Stockholm, Sweden) and for analysis was diluted 1 in 4 with water to obtain a final sample concentration of 5 mg/mL.
Sample preparation
For broad range separations, a master mixture was prepared by combining cIEF gel containing 3.75M urea (200 μL, SCIEX PN 477497 prepared as described in SCIEX application guide) with Pharmalyte 3–10 (12 μL), cathodic stabilizer (20 μL, 500 mM L-arginine in water), anodic stabilizer (2 μL, 200 mM Iminodiacetic acid), four pI markers 9.5, 7.0, 5.5, and 4.1 (each 2 μL, SCIEX PN A58481), water (4 μL) and diluted Vectibix sample (4 μL, 5mg/mL). Three independent samples were prepared.
Capillary electrophoresis
All separations were performed using a neutral capillary (capillary length 30.2 cm/effective length 10 cm). Before the analysis started the capillary was pretreated using the standard conditioning method involving water, sample loading solution, and additional two independent water rinse steps. Before each analysis the capillary was rinsed again with sample loading solution (1 min, 50 psi), water vial 1 (3 min, 20 psi), water vial 2 (2 min, 50 psi), and then the capillary was loaded with sample master mix (150 seconds, 15 psi). The capillary was cleaned using a dip step into a vial containing water on the outlet and inlet side. Proteins were focused by applying a separation voltage (25 kV positive mode, 15 minutes) at the inlet cathode capillary end, which was placed into 200 mM phosphoric acid, the outlet anode end was in 300 mM sodium hydroxide at the same time. Following separation, the outlet end was cleaned using a water dip step before placing in 300 mM acetic acid and the peaks chemically mobilized to the detector by applying voltage (30kV, 25 minutes).
At the end of every batch a shutdown method was run which involved rinsing the capillary with water, sample loading solution and additional two independent water steps.
Results and discussion
cIEF is designed for efficient separation of proteins by their isoelectric points (pI) using a stable and reproducible pI gradient which is generated by the ampholyte carrier stabilized by anodic and cathodic stabilizers. In cIEF the resolution between peaks is affected by the type of ampholyte carrier (pI range) and gradient stretch (final ampholyte concentration and stabilizers) used. The quality of ampholytes impacts not only the Goodness of Fit of the generated pI gradient but also the stability of the linear gradient.
In this study Vectibix (monoclonal antibody, panitumumab) was used to determine stability and reproducibility of migration time, corrected peak area distribution and the pI values across the same batch of wide range Pharmalyte 3–10. Three independent sample preparations were used, each injected 8 times in one single sequence of 24 runs. The pI values of the Vectibix peaks were determined by using bracketing pI markers of pI 7.0 and 5.5, with the gradient linearity calculated with four markers including additional pI markers at 9.5 and 4.1. Figure 1 shows a typical electropherogram for Vectibix.
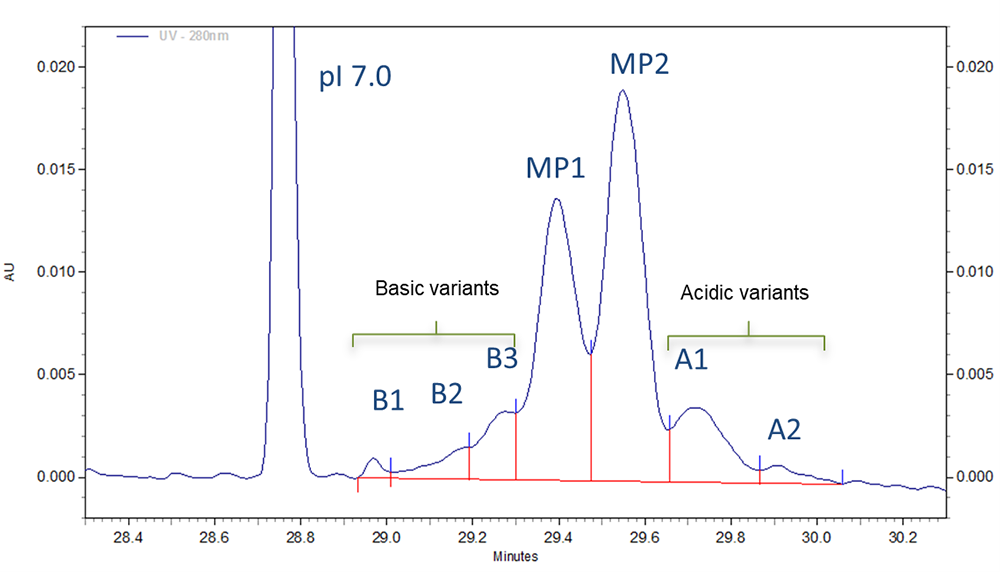
Fig 2. Zoomed in section of cIEF electropherogram for Vectibix test sample obtained from using Pharmalyte 3–10.
Three different basic variants (B1 to B3), two well separated main peaks (MP1 and MP2) and two acidic isoforms (A1–A2) were identified for Vectibix (Fig. 2).
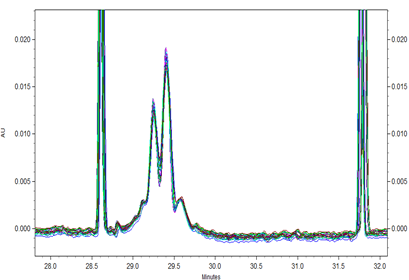
Fig 3. Overlay of all 24 runs of Vectibix samples with a x-axis offset to align the electropherograms around the pI markers.
In this analysis peaks were clustered into one of three isoform groups, basic variants, main peaks, and more acidic variants, due to very small differences in pI values observed for the peaks. This allows for comparison of the stability of corrected peak area distribution between selected three charge variants groups.
Method reproducibility
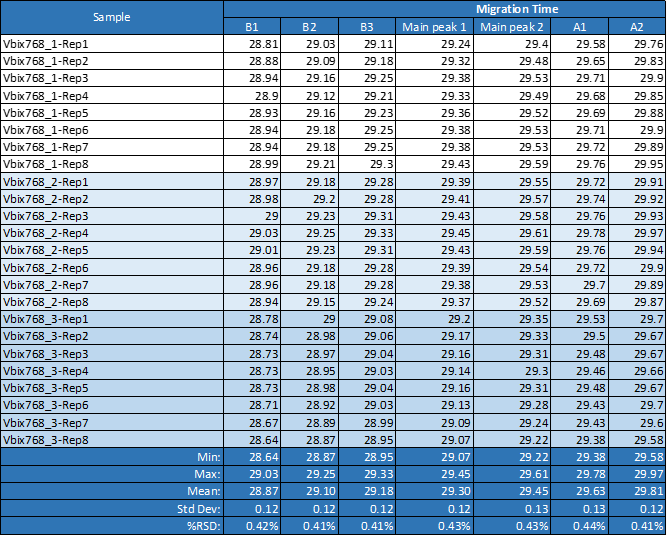
All 24 runs of eight replicate injections of three independent sample preparations using the same sample and the same batch of wide range Pharmalyte 3–10 showed very good reproducibility. This is demonstrated in Figure 3 where a very small x-axis offset was used to highlight the reproducible peak profiles for the obtained separations (Minor peak shifting was expected due to buffer evaporation during this extended batch analysis). Table 1 highlights the reproducibility of this method with peak migration times showing % RSD of less than 0.5%.
pI value and linear gradient stability
Data analysis of pI value and gradient linearity stability shows extremely high reproducibility which was independent from sample preparation (Table 2).
Table 1. Migration time reproducibility for one single sequence of eight repetitions of three independent sample preparation.
The % RSD did not exceed the value of 0.001% for pI and was very low for gradient stability measured using the four synthetic peptide pI markers (Table 2). This highlighted the quality of the wide range of Pharmalyte 3–10 used in this general cIEF assay.
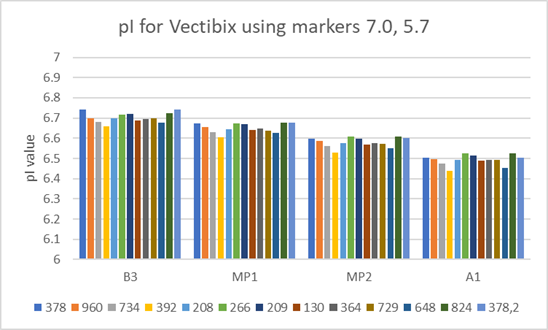
Fig 4. pI value variation for the same Vectibix test sample prepared from 12 different batches of Pharmalyte 3–10 (batch numbers are listed below graph).
To test Pharmalyte batch to batch reproducibility the variation of the pI value was measured using samples prepared from different batches of Pharmalyte 3–10. In this test pI values were determined using the two bracketing markers whose pI values were calculated at 7.0 and 5.7. The results in Figure 4 highlight the very good reproducibility of results obtained when using different batches of the same type of Pharmalyte.
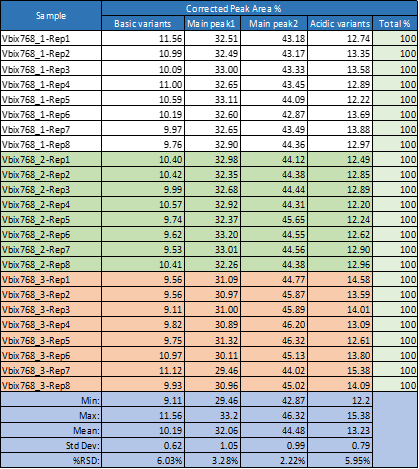
Corrected peak area distribution
Corrected peak area distribution was also assessed in this study. Due to relatively small peak areas for both the acidic and basic peaks, we combined the acidic variants into one total area and the basic variants into another total value and compared the overall % areas with those of the two main variants present in the sample. Using this approach, which helped to normalize these small peaks, the results obtained show very good reproducibility within the same sample as well as all the runs in one single sequence of repeat analysis of 3 separate samples (Table 3).
Table 2. pI value reproducibility and linear gradient stability obtained for all 24 runs performed for one single sequence of eight repetitions of three independent sample preparations using the same batch of wide range Pharmalyte 3–10.
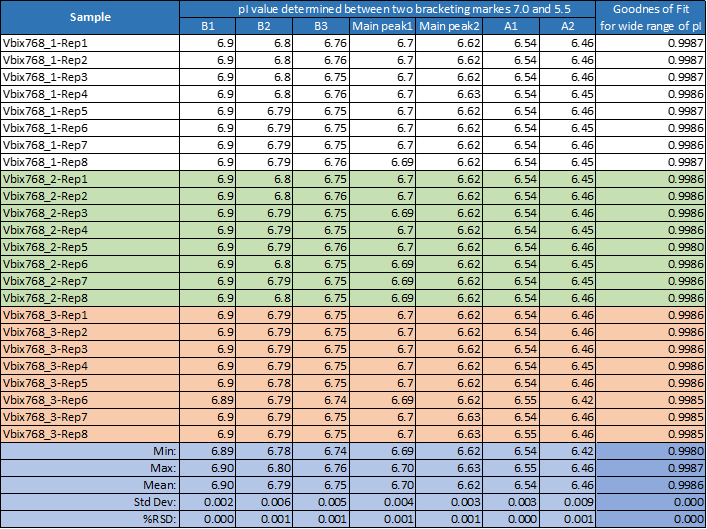
Table 3. Corrected peak area distribution obtained for all 24 runs performed for one single sequence of eight repetitions of three independent sample preparation using the same batch of wide range Pharmalyte 3–10.
From the results above the use of Pharmalyte has been shown to obtain very reproducible results. In addition, Pharmalyte mixtures can also be fine-tuned to improve the resolution obtained. In the final experiment, we compare results from using the wide range Pharmalyte 3–10 with those from the narrow range Pharmalyte 5–8 (Figure 5). Figure 5 highlights how by narrowing the range, you can improve the peak shape and separation which helps improve the overall variant detection and peak area integration without dramatically altering the pI values obtained for the peaks present in the sample.
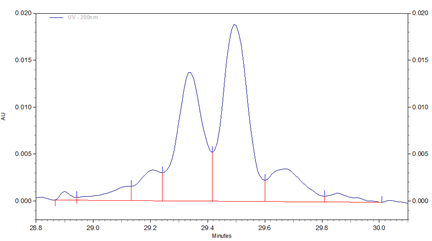
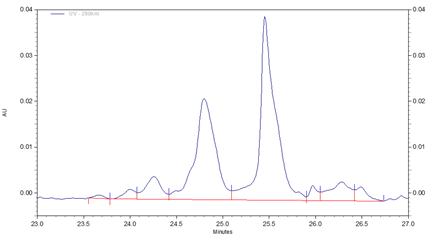
Fig 5. Comparison of Pharmalyte pI 3-10 versus pI 5-8 for mAb charge variant separation. (A) Separation of Vectibix using wide range Pharmalyte 3–10 (B); Separation of Vectibix using narrow range pI 5-8 Pharmalyte 5–8.
Conclusions
This technical note has demonstrated how the use of Pharmalytes together with the PA800 Plus Pharmaceutical Analysis system can provide:
- Reduction in background interferences speeding up analysis by improving peak integration.
- Improves data quality by providing highly reproducible pI values for protein charge variants.
- Highly adaptable providing different pI ranges to fine tune the separation for the target protein.
References
This technical note has demonstrated how the use of Pharmalytes together with the PA800 Plus Pharmaceutical Analysis system can provide:
- Salas-Solano, O et. al. Intercompany study to evaluate the robustness of C-IEF technology for the analysis of monoclonal antibodies. 2011, Chromatogr., 73, 1137- 1144.
- Mack, S., et. al. High-Resolution cIEF of Therapeutic Monoclonal Antibodies. 2017, Sciex Application Note, Document No RUO-MKT-02-6961-A.
- Sciex. Capillary Isoelectric Focusing (cIEF) analysis for the PA 800 Plus Pharmaceutical Analysis System, Application Guide. 2020, Document No RUO-IDV-05-5862-C.
Acknowledgements
The authors would like to acknowledge Manfred Souquet1 for his help and support in completing this application note.