Charge variant characterization is an important molecular profile attribute for both upstream and downstream process development of biologics. Charge variant profile analysis can be used to support quality control to ensure a consistent production process of biologics. In this study, we describe a new approach for charge variant analysis using DIGE pre-labelling technology, isoelectronic focusing (IEF) electrophoresis, and Amersham™ ImageQuant™ 800 systems for multiplex fluorescent detection.
Samples and methods
The samples used in this study were modified antibody fragments based on an Fc portion of a human IgG. Each fragment (Fragments 1, 2, and 3) has different characteristics. Fragment 1 consisted of a single domain VH-Fc fusion. Fragments 2 and 3 consisted of an Fc-protein fusion. The fragments were joined by disulfide bounds (Table 1), thereby forming a homo- or a heterodimer. Pairs of homodimer fragments (1 and 2) were expressed alone or as pairs of heterodimers, that is, combinations of Fragments 1 and 2, or Fragments 1 and 3.
Each sample was labelled using CyDye™ DIGE fluor Cy™3 or Cy™5 dye. The sample labelling was checked by standard 1D SDS-PAGE under reduced condition. Labelled protein samples were separated by IEF (first dimension) followed by the SDS-PAGE (second dimension). Pre-labelled samples were applied to both 7 cm pH 3-10 NL (Non-Linear) and 24 cm pH 3-10 L (Linear) Immobiline™ DryStrips with a re-hydration method using DeStreak rehydration solution with pH 3-10 NL and pH 3-10 L IPG buffers, respectively. The IEF electrophoresis was carried out using an Ettan™ instruments IPGphor™ 3 Isoelectronic Focusing Unit. All samples were run under reducing conditions. After the electrophoresis, gel images were captured using Amersham ImageQuant™ 800 Western blot imaging system and Amersham Typhoon™ biomolecular imager. Captured image data was further analyzed by Melanie™ 9 2D image analysis software. Figure 1 illustrates the total workflow from protein labelling to image analysis.
Table 1. Samples analyzed in this study
| Sample |
Fragment combinations |
Theoretical molecular weight (Mr) |
Theoretical pI |
| A | Homodimer | Fragment 1 39 × 2 | 8.1 |
| B | Homodimer | Fragment 2* 47 × 2 | 6.4 |
| C | 1 and 3* | 39 and 47 | 8.1 and 6.5 |
| D | 1 and 2* | 39 and 47 | 8.1 and 6.4 |
* Fragments 2 and 3, respectively, are known to have an O-glycosylation site present or absent resulting in different post-translational modifications
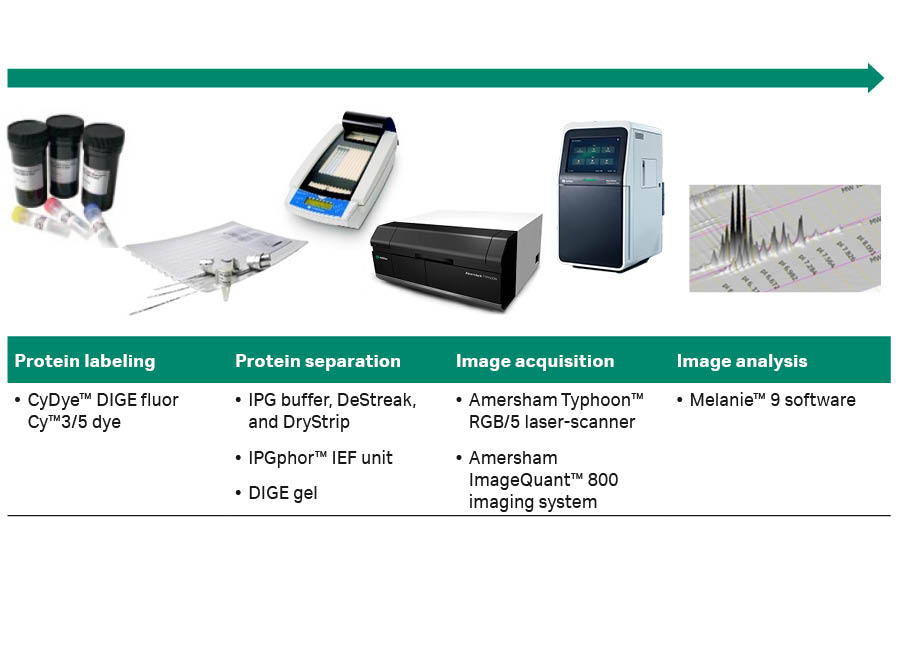
Fig 1. Workflow of the charge variant analysis used in this study.
1D SDS-PAGE
Figure 2 shows the results of the 1D SDS-PAGE with CyDye™ DIGE fluor Cy™5 dye pre-labelled samples. The main products in each sample agreed with the apparent molecular weight of each fragment shown in the Table 1. However, results indicate some differences in molecular weights of Fragment 1 in Samples A, C, and D (molecular weights A < C < D < B). Also, the results indicated that Fragment 2 had a slightly higher apparent molecular weight than Fragment 3.
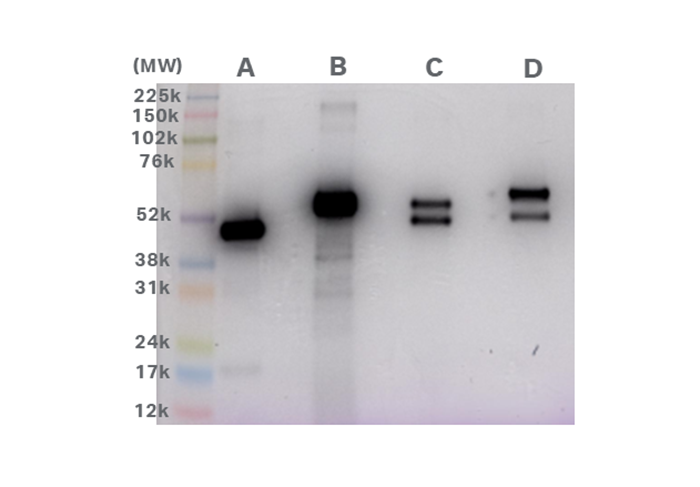
Fig 2.1D SDS-PAGE with CyDye™ DIGE fluor Cy™5 dye pre-labelled samples. Amersham™ rainbow maker was applied to the samples and captured using Amersham ImageQuant™ 800 imaging system with Cy™5 color marker mode. Both Cy™5 fluorescence signals (16-bit grey-scale) and RGB image of color markers were superimposed on one image.
Isoelectronic focusing electrophoresis
CyDye™ DIGE fluor Cy™3 and Cy™5 pre-labelled samples were separated by IEF using 24 cm pH 3-10 L (linear) Immobiline™ DryStrip gels and Ettan™ instruments IPGphor™ 3 Isoelectronic Focusing Unit. After the IEF, Cy™3 and Cy™5 multiplex fluorescence images of samples separated on the Immobiline™ DryStrip gels were captured using ImageQuant™ 800 imager in fluorescence mode (Fig 3).
The results of the separation by IEF indicate that each fragment has several charge variants. Fragment 1 has several charge variants between pH 6.5 and 7.8, and Fragment 2 in Sample B has several charge variants between pH 5.9 and 6.5. In contrast, Samples D and B, which both contain Fragment 2 shown in the fourth strip from the top, don’t have a good overlay. This indicates that Fragment 2 has different charge variants when it is expressed as different fragment pairs. Sample C and D shared similar charge variants indicated by the close overlay pattern of their strips (shown in the fifth strip from the top).
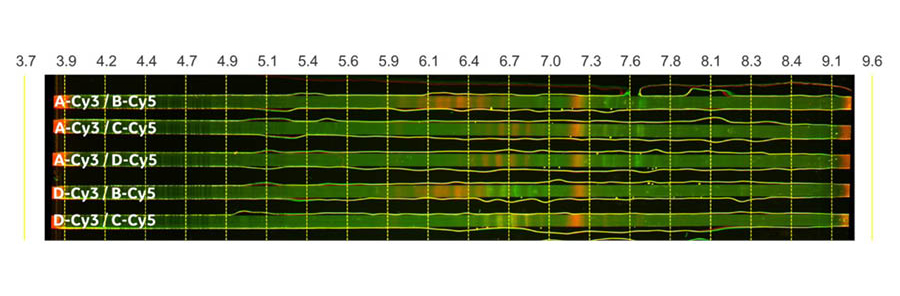
Fig 3. Combinations of charge variants in sample pairs separated with IEF. The image was taken using ImageQuant™ 800 imager in SNOW multiplex fluorescence mode for Cy™3 and Cy™5 dye. CyDye™ DIGE fluor Cy™3 and Cy™5 pre-labelled samples are shown in green and red, respectively.
2D extended analysis
Following separation using IEF, each Immobiline™ DryStrip was placed on an acrylamide gel and SDS-PAGE separation was performed. With this 2D electrophoresis approach, each sample was separated both by charge variants using IEF and molecular weight differences using SDS-PAGE. Two sets of experiments with 7 cm pH 3-10 NL (Non-linear) and 24 cm pH 3-10 L (linear) Immobiline™ DryStrip gels was carried out.
All CyDye™ DIGE pre-labelled samples remained fluorescently labelled during the 2D electrophoresis. Fluorescence images of each gel were captured using ImageQuant™ 800 and Amersham Typhoon™ imagers for both the 7 cm and 24 cm Immobiline™ DryStrip gels. The image data was visualized using Melanie™ 9 in 3D mode with added pI calibration (Figs 4, 5, 6, and 7).
The 2D extension confirmed the results from the 1D SDS-PAGE for Samples C and D, which each contained fragments with different apparent molecular weights (Fig 2). Further analysis using the 3D view with pI calibration, clearly identified charge variants of each fragment. Fragment 1 present in Samples A, C, and D had different charge variants when it was expressed as a homodimer (Sample A), compared to when expressed as a heterodimer with Fragment 3 (Sample C) or Fragment 2 (Sample D) (Fig 5). Similar charge variations were observed in Fragment 2 when it was expressed as a homodimer (Sample B) and as a heterodimer in Fragment 1 (Sample D). Fragments 2 and 3 differ as the O-glycosylation site present in Fragment 3 was removed by a charge neutral mutagenesis in Fragment 2 resulting in different post-translational modifications. This difference is observed as a difference in charge variants with a slight acidic shift of Fragment 2 (Samples C and D) (Fig 6).
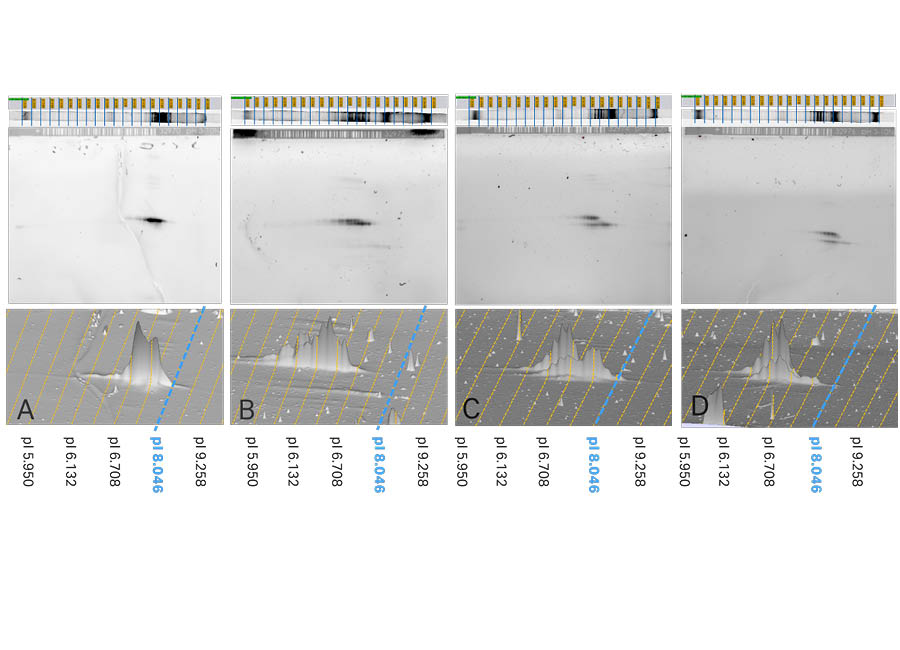
Fig 4. Top: the results of IEF and corresponding 2D patterns of Samples A, B, C, and D are shown in 2D view with pI calibration. Bottom: Magnified 3D views of each fragment on the 2D pattern. The dotted lines show pI calibration of the 2D pattern. IEF was performed on 7 cm pH 3-10 (Non-linear) Immobiline™ DryStrip gels. Images were captured using ImageQuant™ 800 imager and analyzed using Melanie™ 9 software.
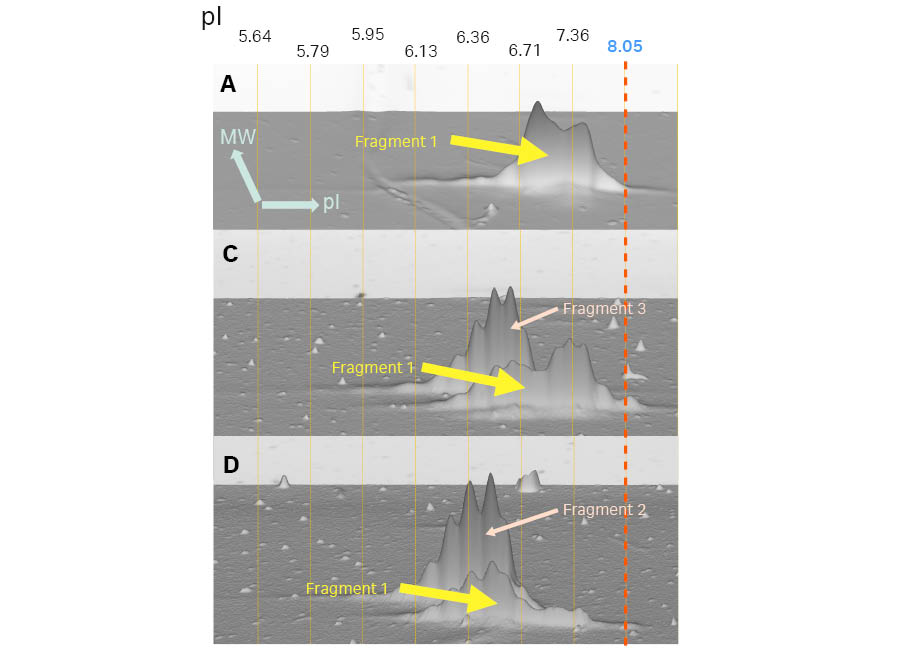
Fig 5. Zoomed in 3D view of Fragment 1(theoretical MW of 39 000) in Samples A, C, and D. The 3D viewpoint in this Figure is from the lower molecular weight side. The vertical lines show pI calibration of the 2D pattern. In Samples C and D, Fragment 1 is located in the lower molecular weight region.
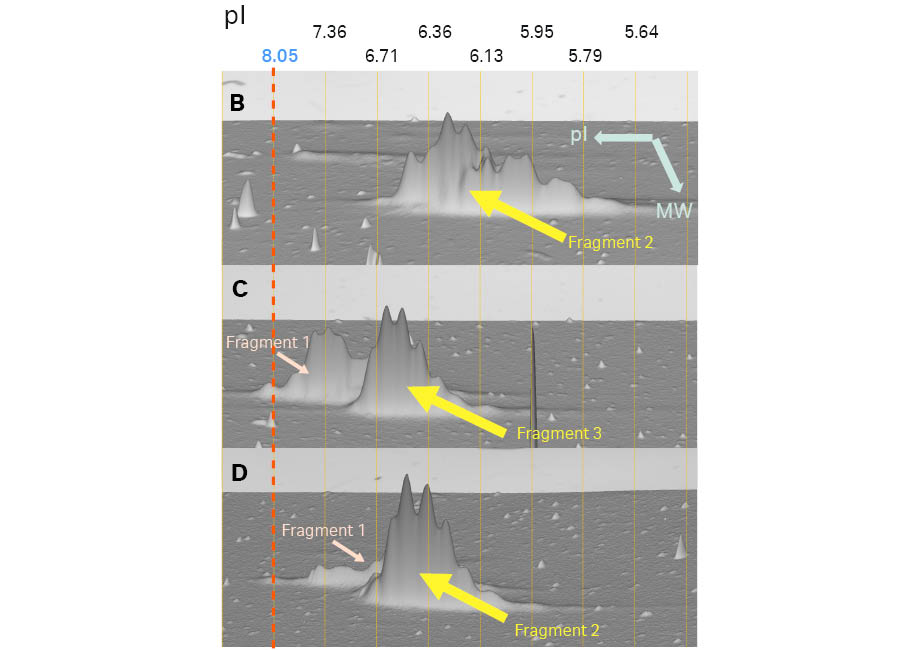
Fig 6. Magnified 3D view of Fragments 2 (theoretical MW of 47 000) and 3 in Samples B, C, and D. The 3D viewpoint in this Figure is from the higher molecular weight side. The vertical lines show pI calibration of the 2D pattern. In Samples C and D, Fragment 2 is located in the higher molecular weight region.
Figure 7 shows the 2D analysis on the 24 cm pH 3–10 (linear) Immobiline™ DryStrip gels offering better resolution than 7 cm pH 3–10 (Non-linear) Immobiline™ DryStrip gels. Except for the resolution, both results agreed in terms of showing charge variants of each fragment.
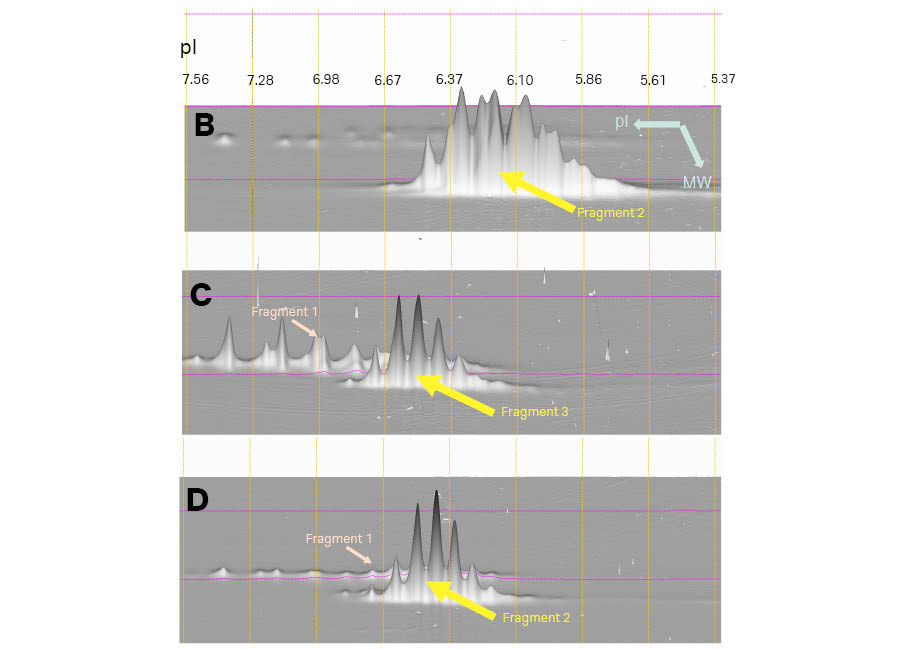
Fig 7. Magnified 3D view of Fragments 2 and 3 in Samples B, C, and D. The 3D viewpoint in this Figure is from the higher molecular weight side. The vertical lines show pI calibration of the 2D pattern. IEF was carried out on 24 cm pH 3–10 (linear) Immobiline™ DryStrip gels and second dimension with a large format gel with low fluorescent glass plates (DIGE gels). Images were scanned using Amersham Typhoon™ laser scanner, and analyzed using Melanie™ 9 software.
Conclusions
We have demonstrated the charge variant analysis of modified antibody fragments, including bispecifics, for biologics development using DIGE labelling technology, isoelectronic focusing electrophoresis (IEF), and Amersham ImageQuant™ 800 imaging system for multiplex fluorescent detection. With this approach, we can better understand the overview of molecular characteristics of drug candidates in terms of both charge and molecular weight variants. With DIGE multiplex approach, even subtle difference in charge and/or molecular weight variants can be detected. This enables the analysis of post translational modifications such as O-glycosylation.
References
(1) Beyer, B., Walch, N., Jungbauer, A., How Similar is Biosimilar? A Comparison of Infliximab Therapeutics in Regard to Charge Variant Profile and Antigen Binding Affinity. Biotechnology J.,2019;4. doi.org/10.1002/biot.201800340
CY22979-xxXxx22-AN