A step-by-step protocol to determine dynamic binding capacity (DBC) of a chromatography resin to screen for the best resin and running conditions for your protein purification.
What is dynamic binding capacity?
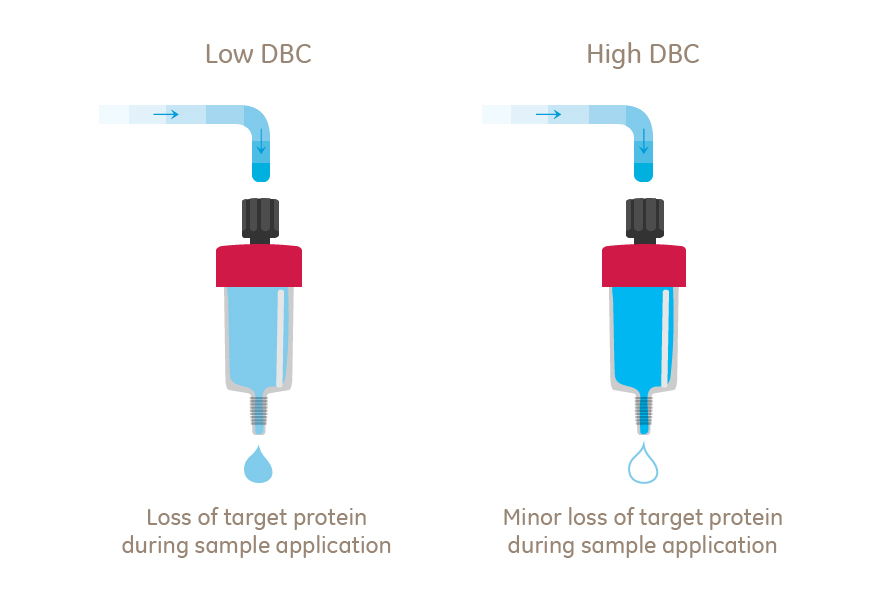
In protein purification, dynamic binding capacity (DBC) of a chromatography column describes the maximum amount of target protein that you can load onto your column without causing unnecessary loss, measured under realistic experimental conditions (default flow-rate, real protein sample).

Fig 1. Exceeding the DBC of the column will end up in loss of target protein.
In a previous article, we explain how to interpret protein binding capacities for chromatography resins, especially the difference between dynamic binding capacity (DBC) and static/total binding capacity.
Dynamic binding capacity (DBC) is key for choosing the resin that will be the most suitable for purifying your protein sample. DBC is available in the technical specifications for Cytiva columns and resins, for typical proteins and running conditions. This is good reference data; however, you might need to determine the DBC yourself to screen for the best resin and running conditions for your specific protein.
Material needed to determine resin’s DBC
- ÄKTA system with a sample pump or a Superloop
- UNICORN software
- UNICORN Evaluation module classic
- DBC Extension
- Binding buffer
- Elution buffer
- Sample: protein at appropriate concentration in binding buffer
- A chromatography column (prepacked or packed in the lab)
DBC measurements are usually carried out using pure protein in binding buffer.
Overview of DBC determination
- Manually prepare ÄKTA system and measure 100% breakthrough absorbance
- Create a method for DBC measurement
- Run the method
- Open the result in UNICORN Evaluation Classic with DBC calculation extension and calculate DBC values
| Step | Description |
| 1 | Prime the system with binding buffer. |
| 2 | Set the UV monitor to an appropriate wavelength for your molecule. Typically, this will be 280 nm for proteins and 260 nm for DNA/RNA. Autozero UV. |
| 3 |
Fill the sample pump or Superloop with the protein sample and inject the sample to the system, by-passing the column, until the UV absorbance from the sample reaches a stable level. This value recorded here is the 100% breakthrough absorbance (Amax). The percentage of breakthrough value can be calculated later with reference to this 100% breakthrough absorbance value. Note:
Choose appropriate sample concentration and flow cell length for UV monitor so that the 100% breakthrough absorbance Amax signal is high but still within the linear range, which is normally under 1200 mAu. Using a sample pump is convenient for sample loading, but a certain amount of sample will be wasted when filling the sample pump. If you have a limited amount of sample, use a Superloop for sample loading. |
| 4 | Wash out sample from the system by running binding buffer through the system. |
| 5 | Attach the chromatography column to the system on a suitable column position. Avoid introducing air into the system. |
| 6 | Equilibrate the chromatography column with 5-10 column volume (CV) binding buffer, until the UV (or other signal such as pH and/or conductivity) is stable. |
| 7 |
Create a method which includes the following steps:
(5 CV is usually efficient when using step-elution. 10 CV can be used when using a linear gradient.) |
| 8 | Run the method |
The DBC calculation extension provides the capability of DBC calculations in UNICORN in an extension. It can be used in UNICORN with versions higher than 6.4. For help on installing DBC calculation extension, please contact your local ÄKTA system specialist.
If you are using UNICORN 6.4 or higher, DBC can be estimated as described here.
| Step | Description |
| 1 | Open a result in UNICORN module Evaluation Classic |
| 2 | Select in the menu “Extensions→DBC Calculations→Analyze” |
| 3 |
Set the parameters for the run:
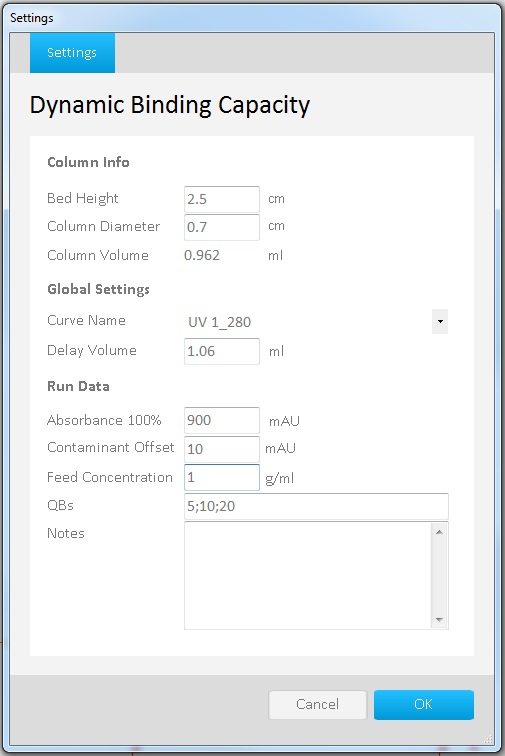
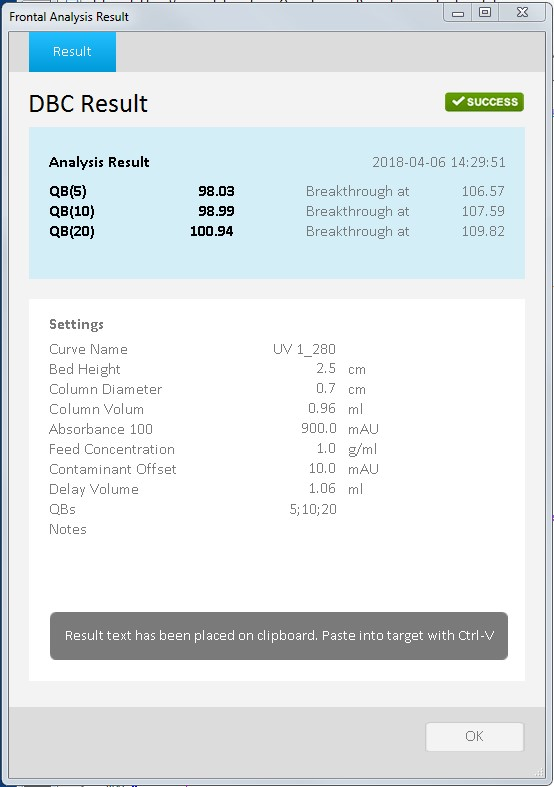
In the example below, we calculate DBC at 5%, 10% and 20% breakthrough. Settings are shown in Figure 2, and the result is shown in Figure 3. |

Fig 2. Settings screen in UNICORN Evaluation Classic, with settings for DBC calculation at 5, 10 and 20%
DBC result
The result window shows the DBC values at various percentage of breakthrough. In the example in Figure 3, resin DBC at 10% breakthrough (QB10) is 98.99 mg sample per mL packed resin.

Fig 3. Results screen for DBC calculation at 5, 10 and 20%.
Estimating DBC with UNICORN versions lower than 6.4
A rough estimate of DBC is performed in the following way:
- Determine the contaminant offset value (Aoffset).
- In a chromatogram with X-axis showing volume and Y-axis showing UV absorbance, move the cursor along X-axis until Y-axis shows a value of A where (A - Aoffset) is 10% of (Amax - Aoffset). Record this volume as Vx.
DBC (QB10) can be estimated as (Vx - Vdelay) x sample concentration.
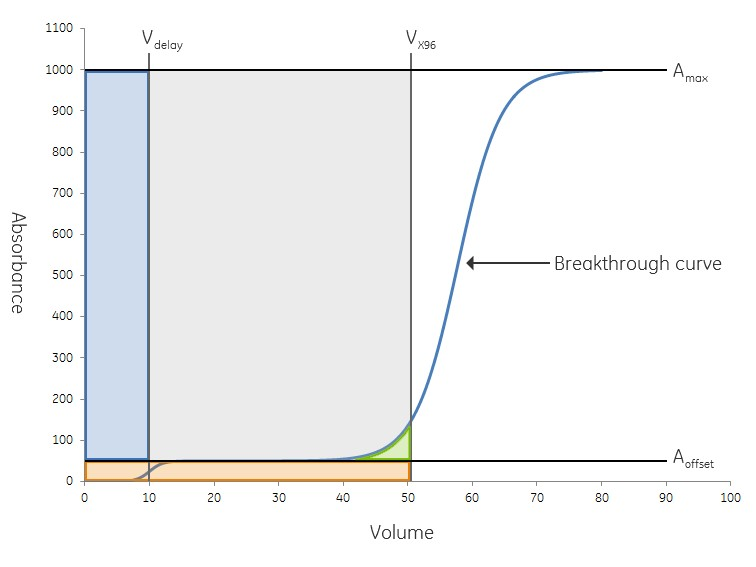
This is an over-estimate of the DBC since the amount of protein that is leaked during sample loading is not subtracted from the calculation (see Figure 4, green area).
- The protein sample should be stable (e.g. do not precipitate) at the running conditions (pH, temperature and salt concentration).
- Ensure that UV baseline is stable before loading the protein sample.
- DBC is dependent on the flow rate used during protein sample loading. For example, low flow rate gives longer residence time (the time the protein is in contact with the resin) and in the end higher DBC. For some resins, extended residence time is needed to utilize the full capacity.
The calculation of DBC is carried out by a UNICORN extension.

Fig 4. Graph of DBC calculation. Blue area is caused by delay volume. The orange area represents the amount of non-binding proteins. The blue curve is the UV signal and the green area represents the amount of protein that has leaked at X% break through. The total dynamic binding capacity at X % breakthrough is represented by the grey area.
Example
In the example shown in Figure 4, Aoffset is 50 mAu and Amax is 1000 mAu.
At volume 50 (Vx) the UV absorbance is 126 mAu.
A- Aoffset = 126 – 50 = 76 mAu
Amax - Aoffset = 1000 – 50 = 950 mAu
Percentage of breakthrough is calculated as (A - Aoffset) / (Amax - Aoffset)
% breakthrough = 76 / 950 = 8%
Thus, the grey area in the graph represents DBC at 8% breakthrough, i.e. QB8 value.