A deep dive into the CFD modeling-based design process underlying a next-generation bioreactor
Industry demand for higher productivity and more robust mammalian cell culture operations has driven the need for high-performing, scalable, and modality-agnostic bioreactors. These requirements affect process developers and bioreactor manufacturers alike, where efficient design and predictable scalability are key to reaching milestones on time. Understanding non-measurable parameters (such as shear rate and turbulence) and demonstrating scalability are vital to meeting performance criteria.
Computational fluid dynamics (CFD) modeling in bioreactor design can reduce wet testing by simulating bioreactor geometry, fluid flow, and design and positioning of components. Here we’ll discuss how we used CFD modeling to accelerate the design of the agitator and sparger in the next-generation Xcellerex™ X-platform bioreactor and predict shear stress and concentration gradients.
CFD and agile ways of working
We leaned on agile ways of working to develop our CFD model to capture current and future bioreactor geometry behavior. Developing the CFD tool simultaneously with the bioreactor enabled us to condense the product development time and confirm performance of the final product.
We verified the tool at various time points and used it at-risk for key bioreactor geometry verification work. To reduce development risk, we developed the CFD model in parallel with continued wet testing of early component designs (such as impeller types, sparge options, and baffles), optimizing performance yet still reducing the need for testing.
We tuned the tool for liquid-liquid performance and used it for early screening of interim designs. Later, once a gas-liquid CFD model was available, we used its outputs for shear and turbulence to confirm that the final design was within targeted performance behavior.
Stages of CFD model and product development
Our first step was to develop a single-phase (liquid-liquid) CFD model. This was followed by iterative development of a two-phase (gas-liquid) model to confirm the final bioreactor product performance relative to our design performance goals (Fig 1).
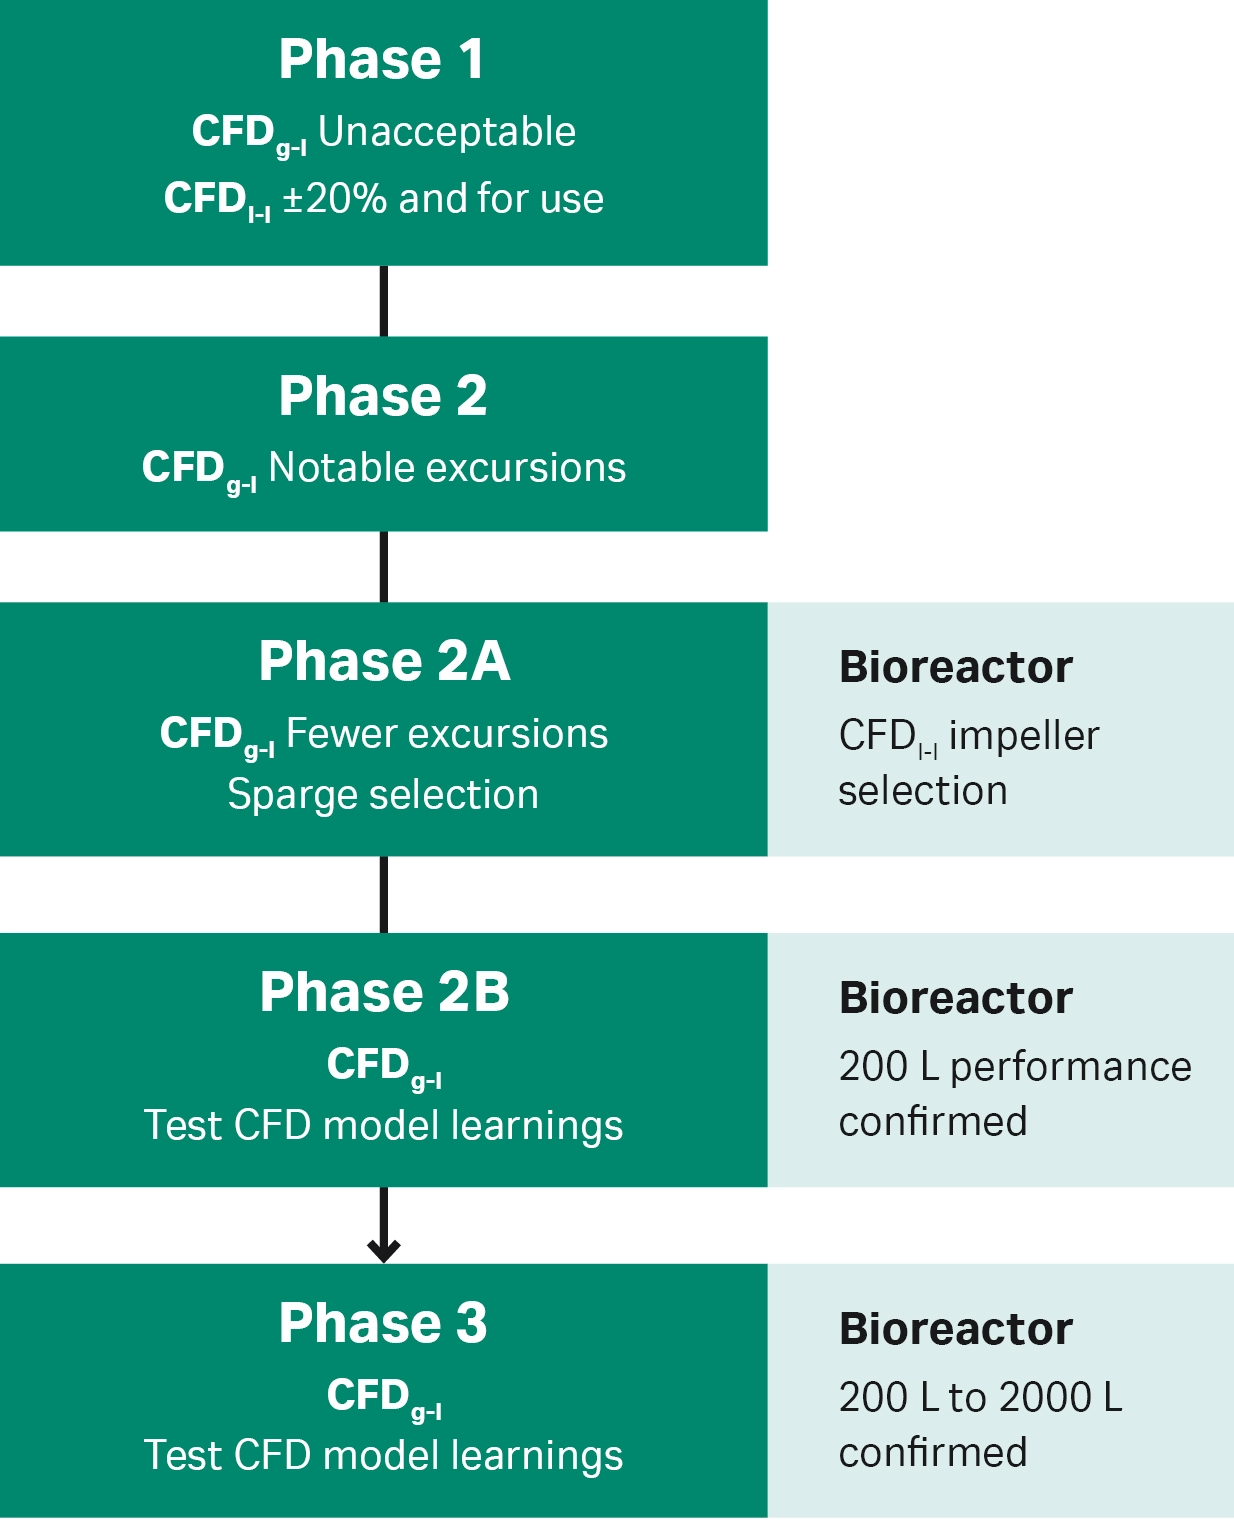
Fig 1. Outline of phases in co-development of product and CFD model. CFDg-l, gas-liquid CFD model; CFDl-l, liquid-liquid CFD model.
CFD Phase 1: confirm 200 L tank geometry and CFDl-l model
During this initial phase, we determined the model conditions for the bioreactor tank geometry and early model fluid assumptions. We developed the model using the current Xcellerex™ XDR bioreactor geometry and a new bioreactor design to ensure the model’s suitability for our project. Our goals at this stage were to:
- Establish and test the first pass of the single-phase (liquid-liquid) CFD model
- Establish and test the first pass of the two-phase (gas-liquid) CFD model
- Consider new target geometries and customer applications (viscosity, bubble size, agitation, and gas flow rate)
We tested an early gas-liquid model against wet results to identify gaps in the model’s predictions. The model was confirmed by empirical oxygen mass transfer results generated using a mock media. This model assumed that Pluronic poloxamer did not impact bubble formation, as confirmed by internal high-speed camera evaluations of bubble sizing.
We used 19 design of experiment (DoE) conditions covering various vessel volumes, sparge rates, sparge options, and agitation speeds to verify the early gas-liquid CFD model. Outputs were within ~30% of the empirical data.
To verify reliability of the CFD single-phase model, we used empirical torque and mixing time data (Fig 2). Results for the gas-liquid model indicated that we needed to tune it further, which we did in Phases 2, 2A, and 2B. During the Phase 2 effort for the gas-liquid model, the bioreactor development team could use the outputs of the liquid-liquid model for bioreactor product development. Phase 2 of testing also allowed occasional use of the gas-liquid model for product design decisions if and when the model performed predictably.
Summary of CFD Phase 1 outcomes:
- We determined that the CFDl-l model was fit for immediate use in the bioreactor design and for impeller geometry screening.
- We found that the CFDg-l model needed further tuning.
|
|
|
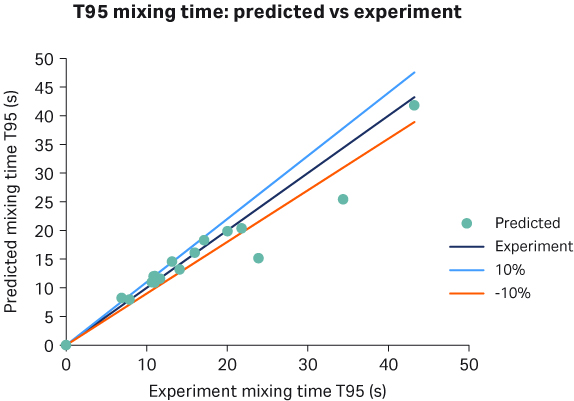
Fig 2. CFD model from Phase 1 describing the liquid-liquid mixing. Left, the confirmed 200 L tank geometry; right, predicted vs experiment mixing time. T95, time to reach 95%.
CFD Phase 2: optimize CFDg-l model for accuracy
In Phase 2, we focused on enhancing the gas-liquid CFD model around identifying bubble distribution and using direct bubble measurements from key sparge options. The results of this tuning and testing would allow us to select the sparge porosity while the final form of the sparge elements was being settled.
We had three goals for Phase 2:
- Evaluate and optimize the CFDg-l model for accuracy of the gas-liquid predictive outputs where mass transfer, shear rate, and turbulence would be used
- Reduce process simulation time from 1-2 days to a few hours
- Verify the gas-liquid model by comparison to empirical results
When designing the model inputs and assumptions for the shear, turbulence, and bubble sizing factors, we first screened the most likely and fitting model inputs for a match with the empirical results representing the application range of agitation and sparge gas flow rates. Then, when necessary, we used response surface modeling to narrow the selection of the model inputs. We used 24 condition sets to screen the behavior of key input factors. The key input factors we considered at this stage were related to turbulence-kinetic modeling parameters.
Turbulence assumptions are affected by turbulence kinetic energy (k) and energy dissipation rate (ε). We could select from several factors here, including standard k-ε, the renormalization group (RNG) k-ε, the realizable k-ε, the Chen-Kim k-ε, the optimized Chen-Kim k-ε, and the Reynolds Stress Model. We avoided models whose factors are better suited to laminar fluid environments than to turbulent flow conditions.
We verified the final model inputs for the gas-liquid model along the full range of application performance using 10 condition sets. To confirm the final model behavior, we compared empirical results for torque and oxygen mass transfer coefficient (kLa) to the model outputs. We performed the empirical tests in triplicate. Additionally, we evaluated the steady vs. transient behavior of oxygen mass transfer at various points in the volume and found that it reflected the mass transfer behavior observed at a single sensor.
Summary of Phase 2 outcomes:
- The CFDg-l model was now more in line with our goal— within ± 20% for kLa and ± 10% for torque, with fewer excursions.
- There were numerous exceptions at slow agitation/sparge conditions.
CFD Phase 2A: tuning the model for bubble size
Our goals in Phase 2A of model development were to:
- Enhance the CFDg-l tuning for bubble size
- Down-select sparge through gas-liquid CFD model tuning
- Down-select impeller using liquid-liquid CFD model
We started Phase 2A with an in-progress version of the next-generation bioreactor tank design and a few existing sparge designs.
We used a high-speed camera to determine the average bubble size, sampling at least 30 bubbles per image and determining the average bubble diameter across 4 axes of the 2-dimensional images (Fig 3). With this information, we chose the user inputs to the CFD model for bubble dispersal and coalescence to match the high-speed bubble diameter estimates. Once the bubble diameters were matching, we verified the model performance.
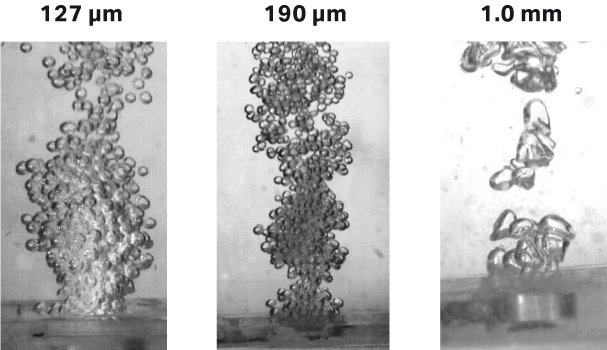
Fig 3. Bubble size analysis to assess sparge porosity options. Images were taken with a high-speed camera. Values above each image are average bubble diameter.
Verification consisted of experiment sets of 10, 5, and 5 conditions for each sparge type. We compared the model output for the experiment conditions to empirical oxygen mass transfer results, as well as the new bioreactor geometry with one of the new impeller options under consideration. The model performed within the limit of ± 20%, except in low mass transfer conditions.
Outcomes of Phase 2A:
- We created input conditions for bubble sizing across the application range.
- CFDg-l model outputs were within ±20% of empirical kLa results, with fewer exceptions at slow agitation/sparge conditions.
- The 200 L bioreactor design performs to expectations for target kLa using final sparge and impeller designs.
CFD Phase 2B: near-final bioreactor design
With a reliable gas-liquid model in place, in Phase 2B we focused on verifying the CFDg-l model in context of the near-final bioreactor design. Our goal was to optimize the impeller using the liquid-liquid model and to then confirm the bioreactor design and gas-liquid model for performance in a verification experiment set. In this way, we could confirm the model and the bioreactor design simultaneously.
This development phase allowed us to conduct a more thorough exploration of the bioreactor application ranges now that we had determined the sparge porosity and the possible impeller form.
The outcome of the testing showed consistent model behavior within ± 20% of empirical results using oxygen mass transfer and torque. The results also confirmed the final performance of the new 200 L bioreactor (Figs 4 and 5).
Outcomes of Phase 2B:
- The CFDg-l model performed for torque and kLa within ± 20% of empirical results (with acceptable exceptions) for the final sparge and impeller chosen.
- The 200 L bioreactor design performed to design expectations for the target kLa using the final sparge and impeller designs.
- Early design geometry was set to allow development of the consumables to continue.
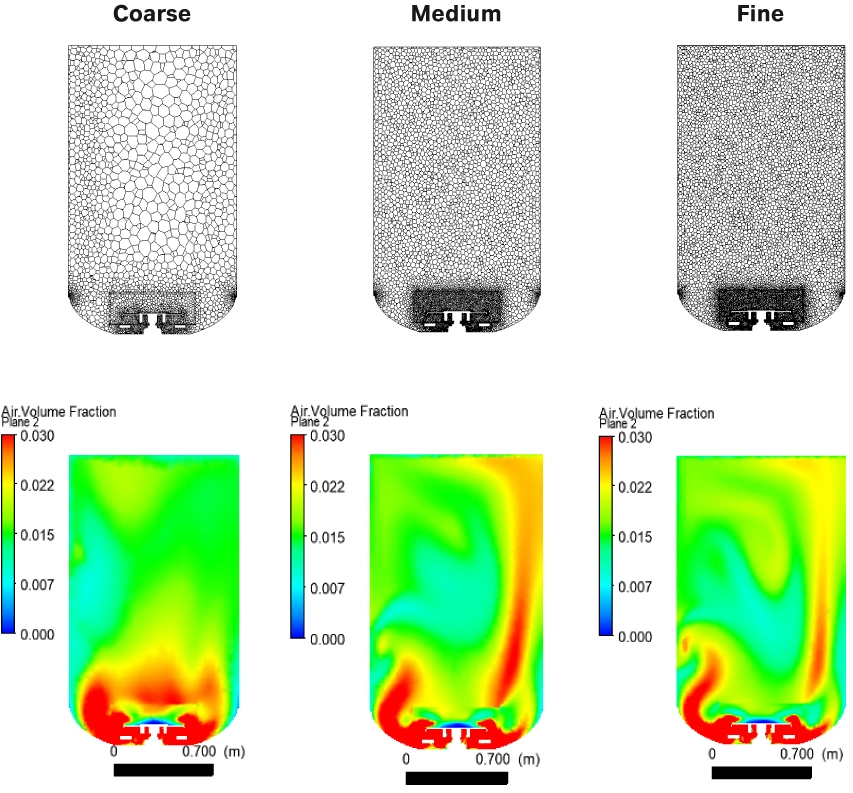
Fig 4. Model grid size impact on gas holdup distribution. Comparing coarse, medium, and fine grid model accuracies, we chose the final grid sizing to optimize for processing time as well as accuracy of simulation output.
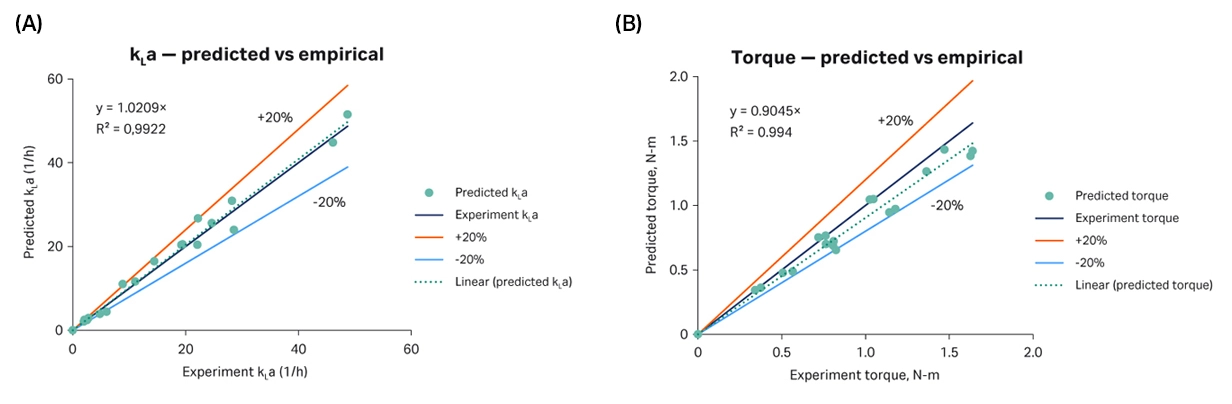
Fig 5. (A) Confirmed 200 L system performance; (B) CFDg-l model performance after phase 2B.
CFD Phase 3: confirm CFDg-l model and new bioreactor performance
With the development of the gas-liquid model complete, in Phase 3 we set out to confirm the behavior of the latest CFDg-l model using a wet test of the final bioreactor geometry at 200 L. A parallel goal for the product development was to confirm the product performance for shear rate and turbulence for the 200 L bioreactor and for a 2000 L prototype based on geometric scaling of the 200 L design.
All tests in this phase were based on a set of experiments designed for each bioreactor size. We assessed both oxygen mass transfer and torque to ensure the product was fully characterized and that we had enough data to assess the gas-liquid CFD model.
The results indicated that the gas-liquid CFD model was within ± 20% of empirical results and could now be used to confirm the behavior of both the 200 L and 2000 L bioreactors. Both the bioreactors provided the target performance for mass transfer (oxygen and carbon dioxide stripping) as well as mixing time.
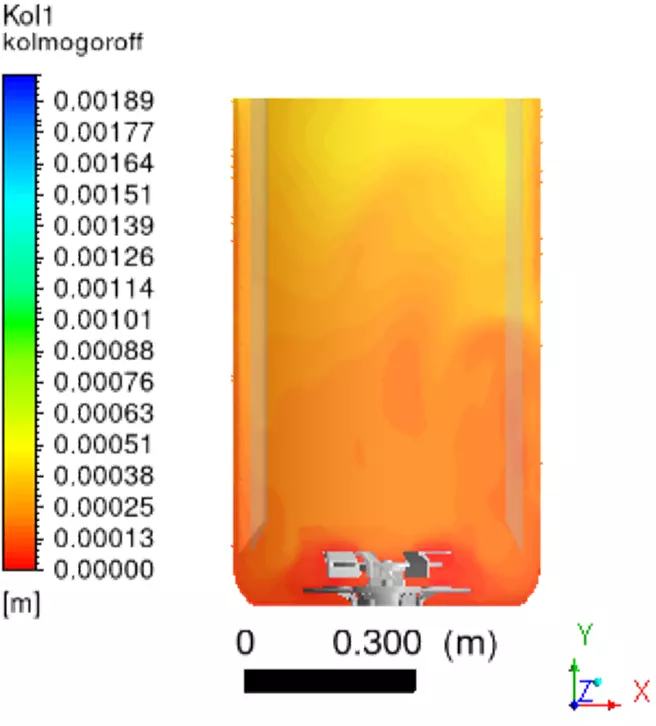
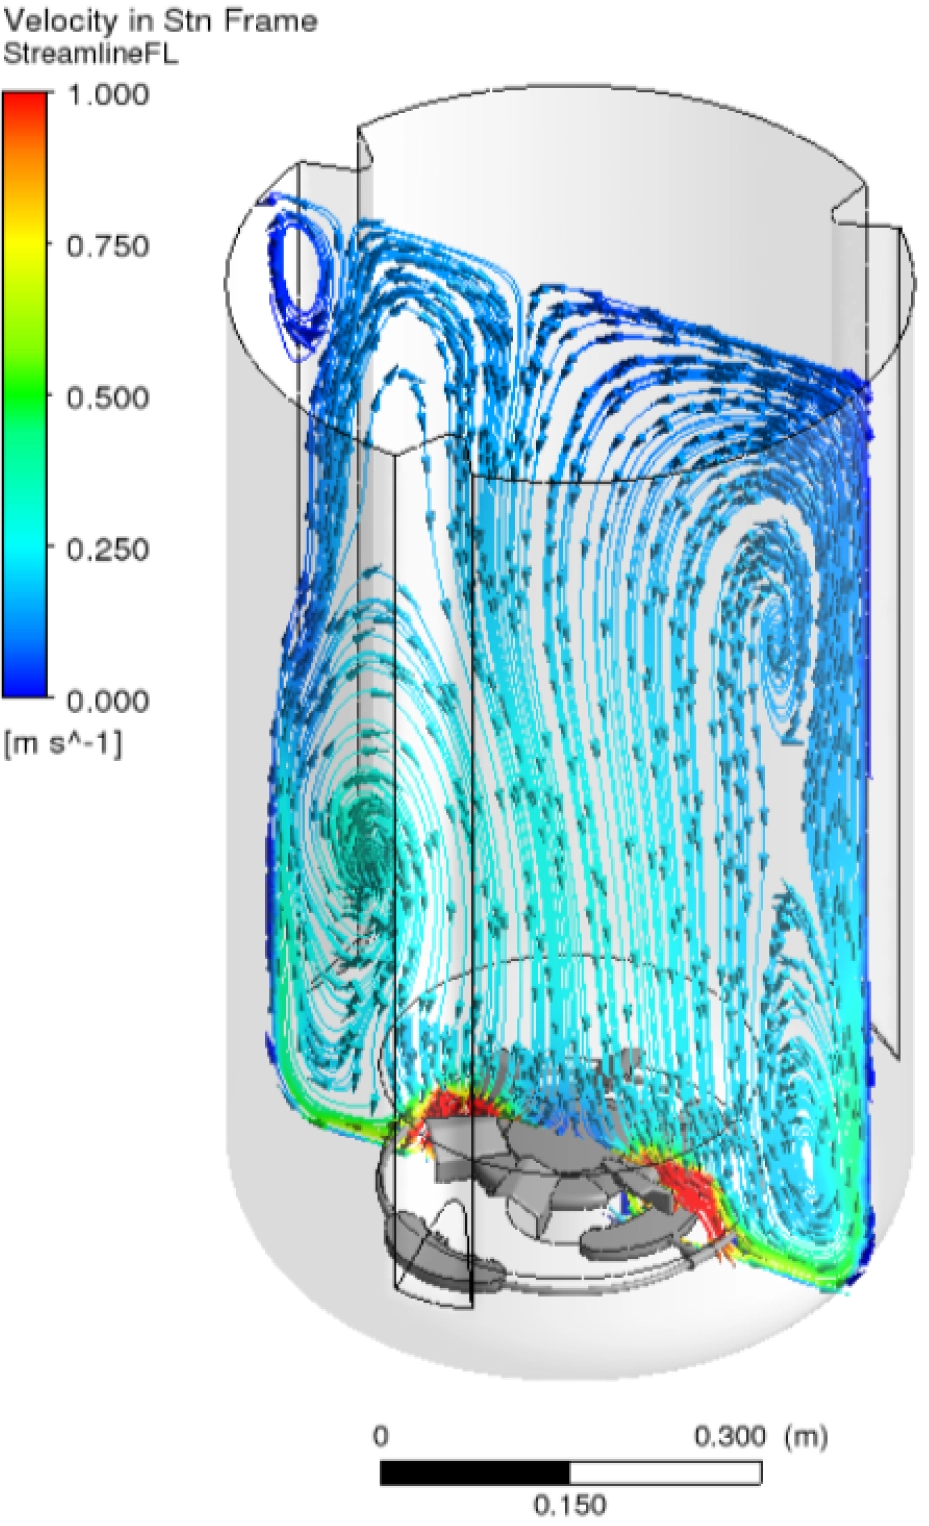
Finally, we applied the gas-liquid CFD model to confirm the design limits for shear rate and Kolmogorov Eddy turbulence (Figs 6 and 7). Both factors behaved within the design requirements set for the new bioreactor product design.
|
Kolmogorov eddy analysis Goal:
Early performance results:
|
Fig 6. CFD model for Kolmogorov eddy analysis at 150 W/m3 up-pumping and 0.2 VVM gas flow rate. Turbulent eddies < 62.5 μm in diameter are represented in red. Results here are not the final performance results for the product design. |
|
Shear rate analysis Goal:
Early performance results:
|
Fig 7. CFD model for shear rate analysis, here showing the velocity contours. Analysis was done at 150 W/m3 up-pumping and 0.2 VVM gas flow rate. Results here are not the final performance results for the product design. |
Outcomes of Phase 3:
- We validated bioreactor performance for the final geometry, impeller, and sparge forms.
- We confirmed that the bioreactor was within design ranges for performance for shear rate and turbulence.
- We demonstrated scalability of the 200 L design to 2000 L.
Conclusion
The gas-liquid CFD model development process was extremely useful for developing the new Xcellerex™ X-platform bioreactor, and it also led us to a design philosophy that we can apply more generally. Now that we have a robust gas-liquid model, we can use it to accelerate the development and improvement of future bioreactor designs.
The model allowed us to confirm the scalability of the new bioreactor design and more efficiently screen new features such as impeller types, sparge forms, and baffle options. All performance claims are now verified through wet testing using internal product prototypes.
The key benefits of developing the CFD model alongside the bioreactor were condensed product development time and early full-characterization performance data. We obtained deeper quantitative insight into the predicted behavior of bioreactor design iterations, in fewer performance runs.