Temperature excursion (changes from optimal) in serum shipping and handling conditions can raise questions about serum performance in cell culture applications. We investigated how different temperatures ranging from -80°C to 40°C and four different storage times at those temperatures (1, 3, 5, and 7 days, [d]) affected HyClone™ Characterized Fetal Bovine Serum (FBS) used for cell culture.
Results for cell growth and viability were collected. We also measured endotoxin, pH, and osmolality, and a metabolic panel was completed for each lot. Bright-field microscopy images were acquired before harvest and images of the treated serum tubes were taken. Data analysis and observations indicated that after temperature exposure, color and turbidity differences were noted in the serum; however, no clear impact on cell culture was observed in the conditions tested.
Introduction
Cell culture sera are supplements used in cell culture, which contain growth-promoting factors including hormones, proteins, amino acids, glucose, and vitamins. For long-term storage of Cytiva’s HyClone™ serum products, we have previously shown that storage at -10°C or lower is recommended. However, although every effort is made to supply and store sera at sufficiently low temperatures to maintain product viability, serum may experience fluctuations in temperature through conditions such as being received either partially or completely thawed due to factors such as inadequate shipping or handling conditions, mistakenly leaving products out on the lab bench, and freezer failures. The unfortunate temperature excursion that arises (defined as an exposure of a time and temperature-sensitive product to temperatures outside the range for transport/storage) may lead to disposal of the product and repurchase of new sera, which inevitably incurs delays and additional costs.
In this study, we simulate a complete thaw of serum outside of normal storage or shipping conditions (i.e., temperature deviation) and expose to temperature conditions from -80°C to 40°C for 1, 2, 3, and 7 storage days. The cell lines investigated for the study are HEK-293 adherent and SP2/0 and FOX-NY suspension cells. We evaluate how shifts beyond the frozen shipping conditions affect the performance of HyClone™ FBS used as a supplement in the cell culture medium.
Cell line growth and viability assays are performed to determine the degree to which temperature variations affect serum performance. In addition, we use a metabolic panel analysis performed by a validated contract lab. The analysis also looks for changes in pH, osmolality, and endotoxin levels caused by temperature variation.
Detailed Materials and methods used in this study are shown at the end of the article.
Cell growth and viability
Viable cell density (VCD) was counted to evaluate cell growth for each FBS storage condition. Each lot was first normalized to the control condition (-20°C, n = 12) and then averaged together (n = 3). This approach allows a view of each condition compared to the control and identifies clear trends associated with storage temperature and time duration. T-tests (at 95% confidence interval) and percentage change (from control) calculations were also performed using Microsoft Excel. For all the temperature groups, the treated FBS aliquots were frozen at -20°C in the centrifuge tubes after each was stored for the allotted time (1, 2, 3, and 7 d).
We found that VCD results for temperature and time conditions are relatively similar to growth in media with control serum (Fig 1). The t-test shows that, compared to the control (-20°C), FOX-NY cells, and SP2/0 cells were not significantly impacted by the temperature. HEK-293 cells, however, remained unaffected by all temperature conditions except for at 40°C, which caused the biggest change in viable cell density (-19.3%) relative to the control (Table 1).
Table 1. T-tests and percentage change on viable cell density
| FOX-NY | HEK-293 | SP2/0 | ||||
|---|---|---|---|---|---|---|
| T-test | P-value | Change (%) | P-value | Change (%) | P-value | Change (%) | -20°C vs -80°C | 0.239472 | 5.6 | 0.051499 | -8.5 | 0.170812 | -9.8 |
| -20°C vs 4°C | 0.06267 | -10.2 | 0.016798 | -12.4 | 0.304275 | -6.8 |
| -20°C vs 25°C | 0.237224 | -6.9 | 0.474341 | -4.6 | 0.635216 | -2.9 |
| -20°C vs 40°C | 0.273144 | -9.9 | 0.002214 | -19.3 | 0.893475 | 1.0 |
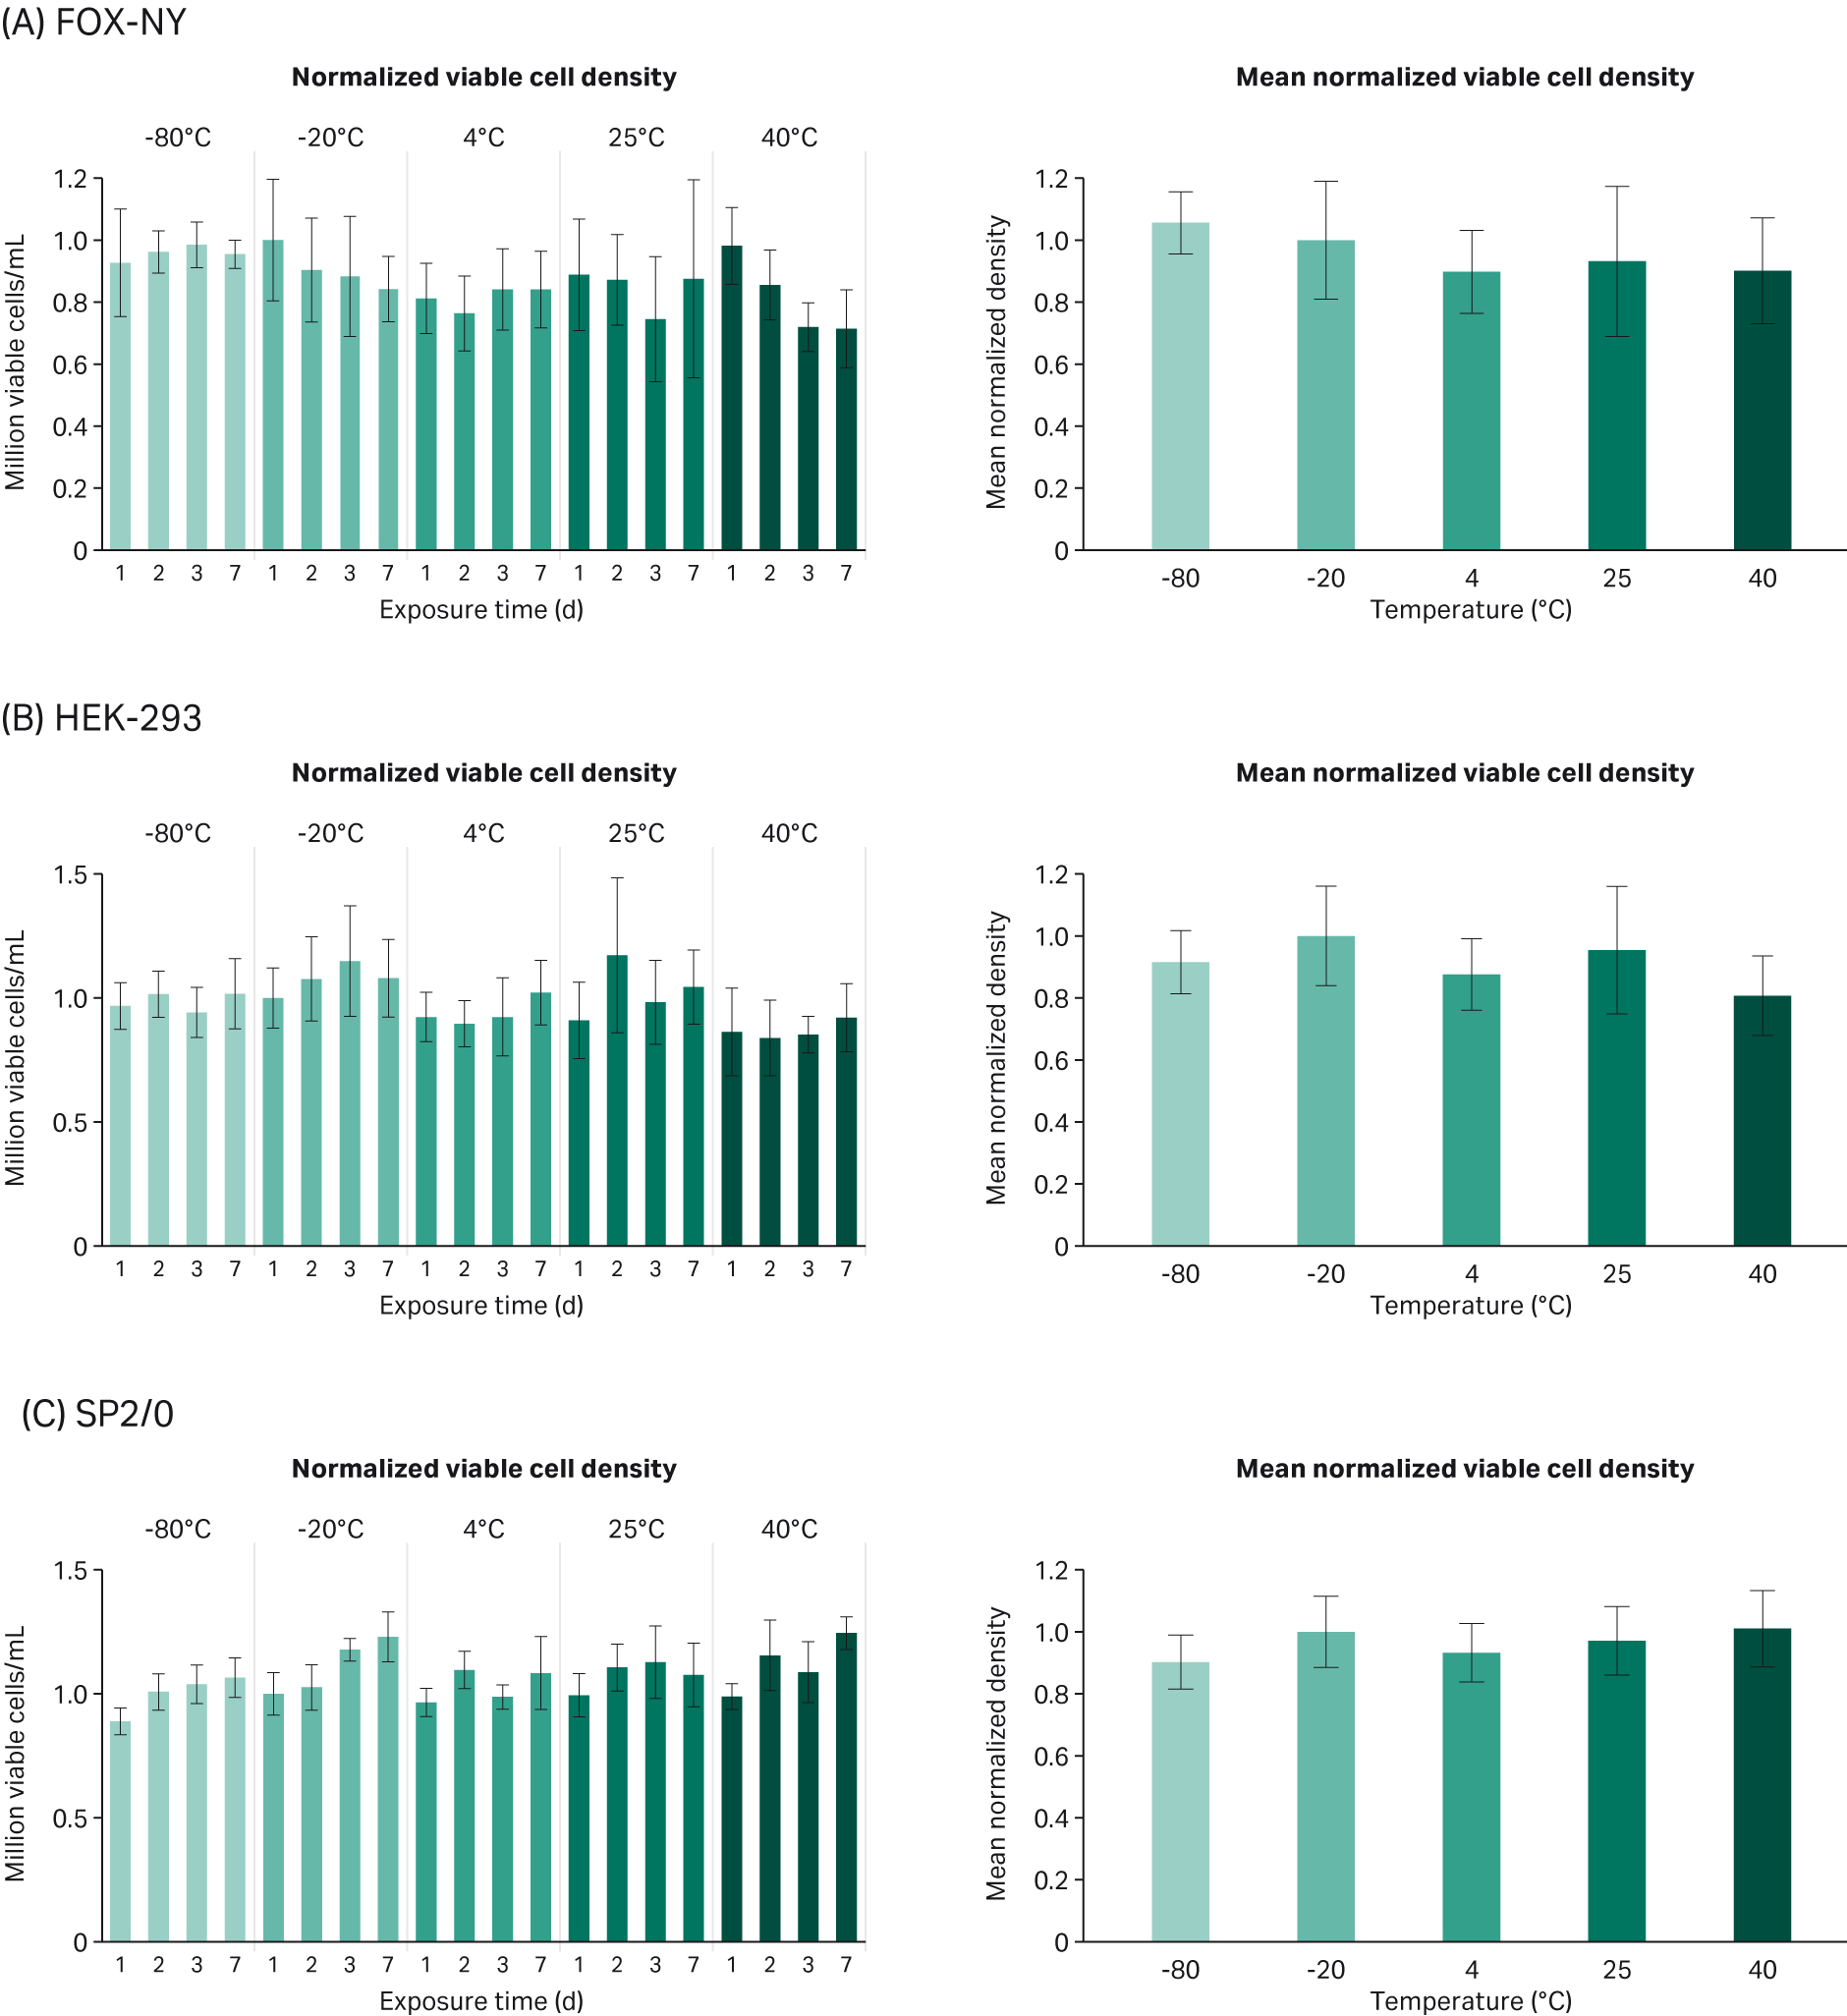
Fig 1. Mean normalized VCD compared to -20°C control (average of days 1, 2, 3, and 7 exposure time) for each cell line: (A) FOX-NY, (B), HEK-293, and (C) SP2/0.
The percentage of viable cells was also recorded, and the results normalized to the -20°C (day 1) control condition. As for viability, we observe consistent cell viability between serum conditions in all cell lines (Fig 2). Furthermore, each cell line is consistently above 90% viability at the time of harvest (data not shown). The only condition for which the P-value was lower than 0.05 is the test on HEK at 40°C (Table 2). However, the impact of the temperature increase on HEK viability was actually positive.
Table 2. T-tests and percentage change on cell viability
| FOX-NY | HEK-293 | SP2/0 | ||||
|---|---|---|---|---|---|---|
| T-test | P-value | Change (%) | P-value | Change (%) | P-value | Change (%) | -20°C vs -80°C | 0.828077 | -0.1 | 0.301487 | -0.7 | 0.128123 | -1.4 |
| -20°C vs 4°C | 0.999222 | 0.0 | 0.141819 | 1.0 | 0.45309 | -0.9 |
| -20°C vs 25°C | 0.273842 | -0.6 | 0.243847 | 0.8 | 0.145061 | -1.3 |
| -20° C vs 40°C | 0.105629 | -1.6 | 0.023485 | 1.7 | 0.151695 | -1.3 |
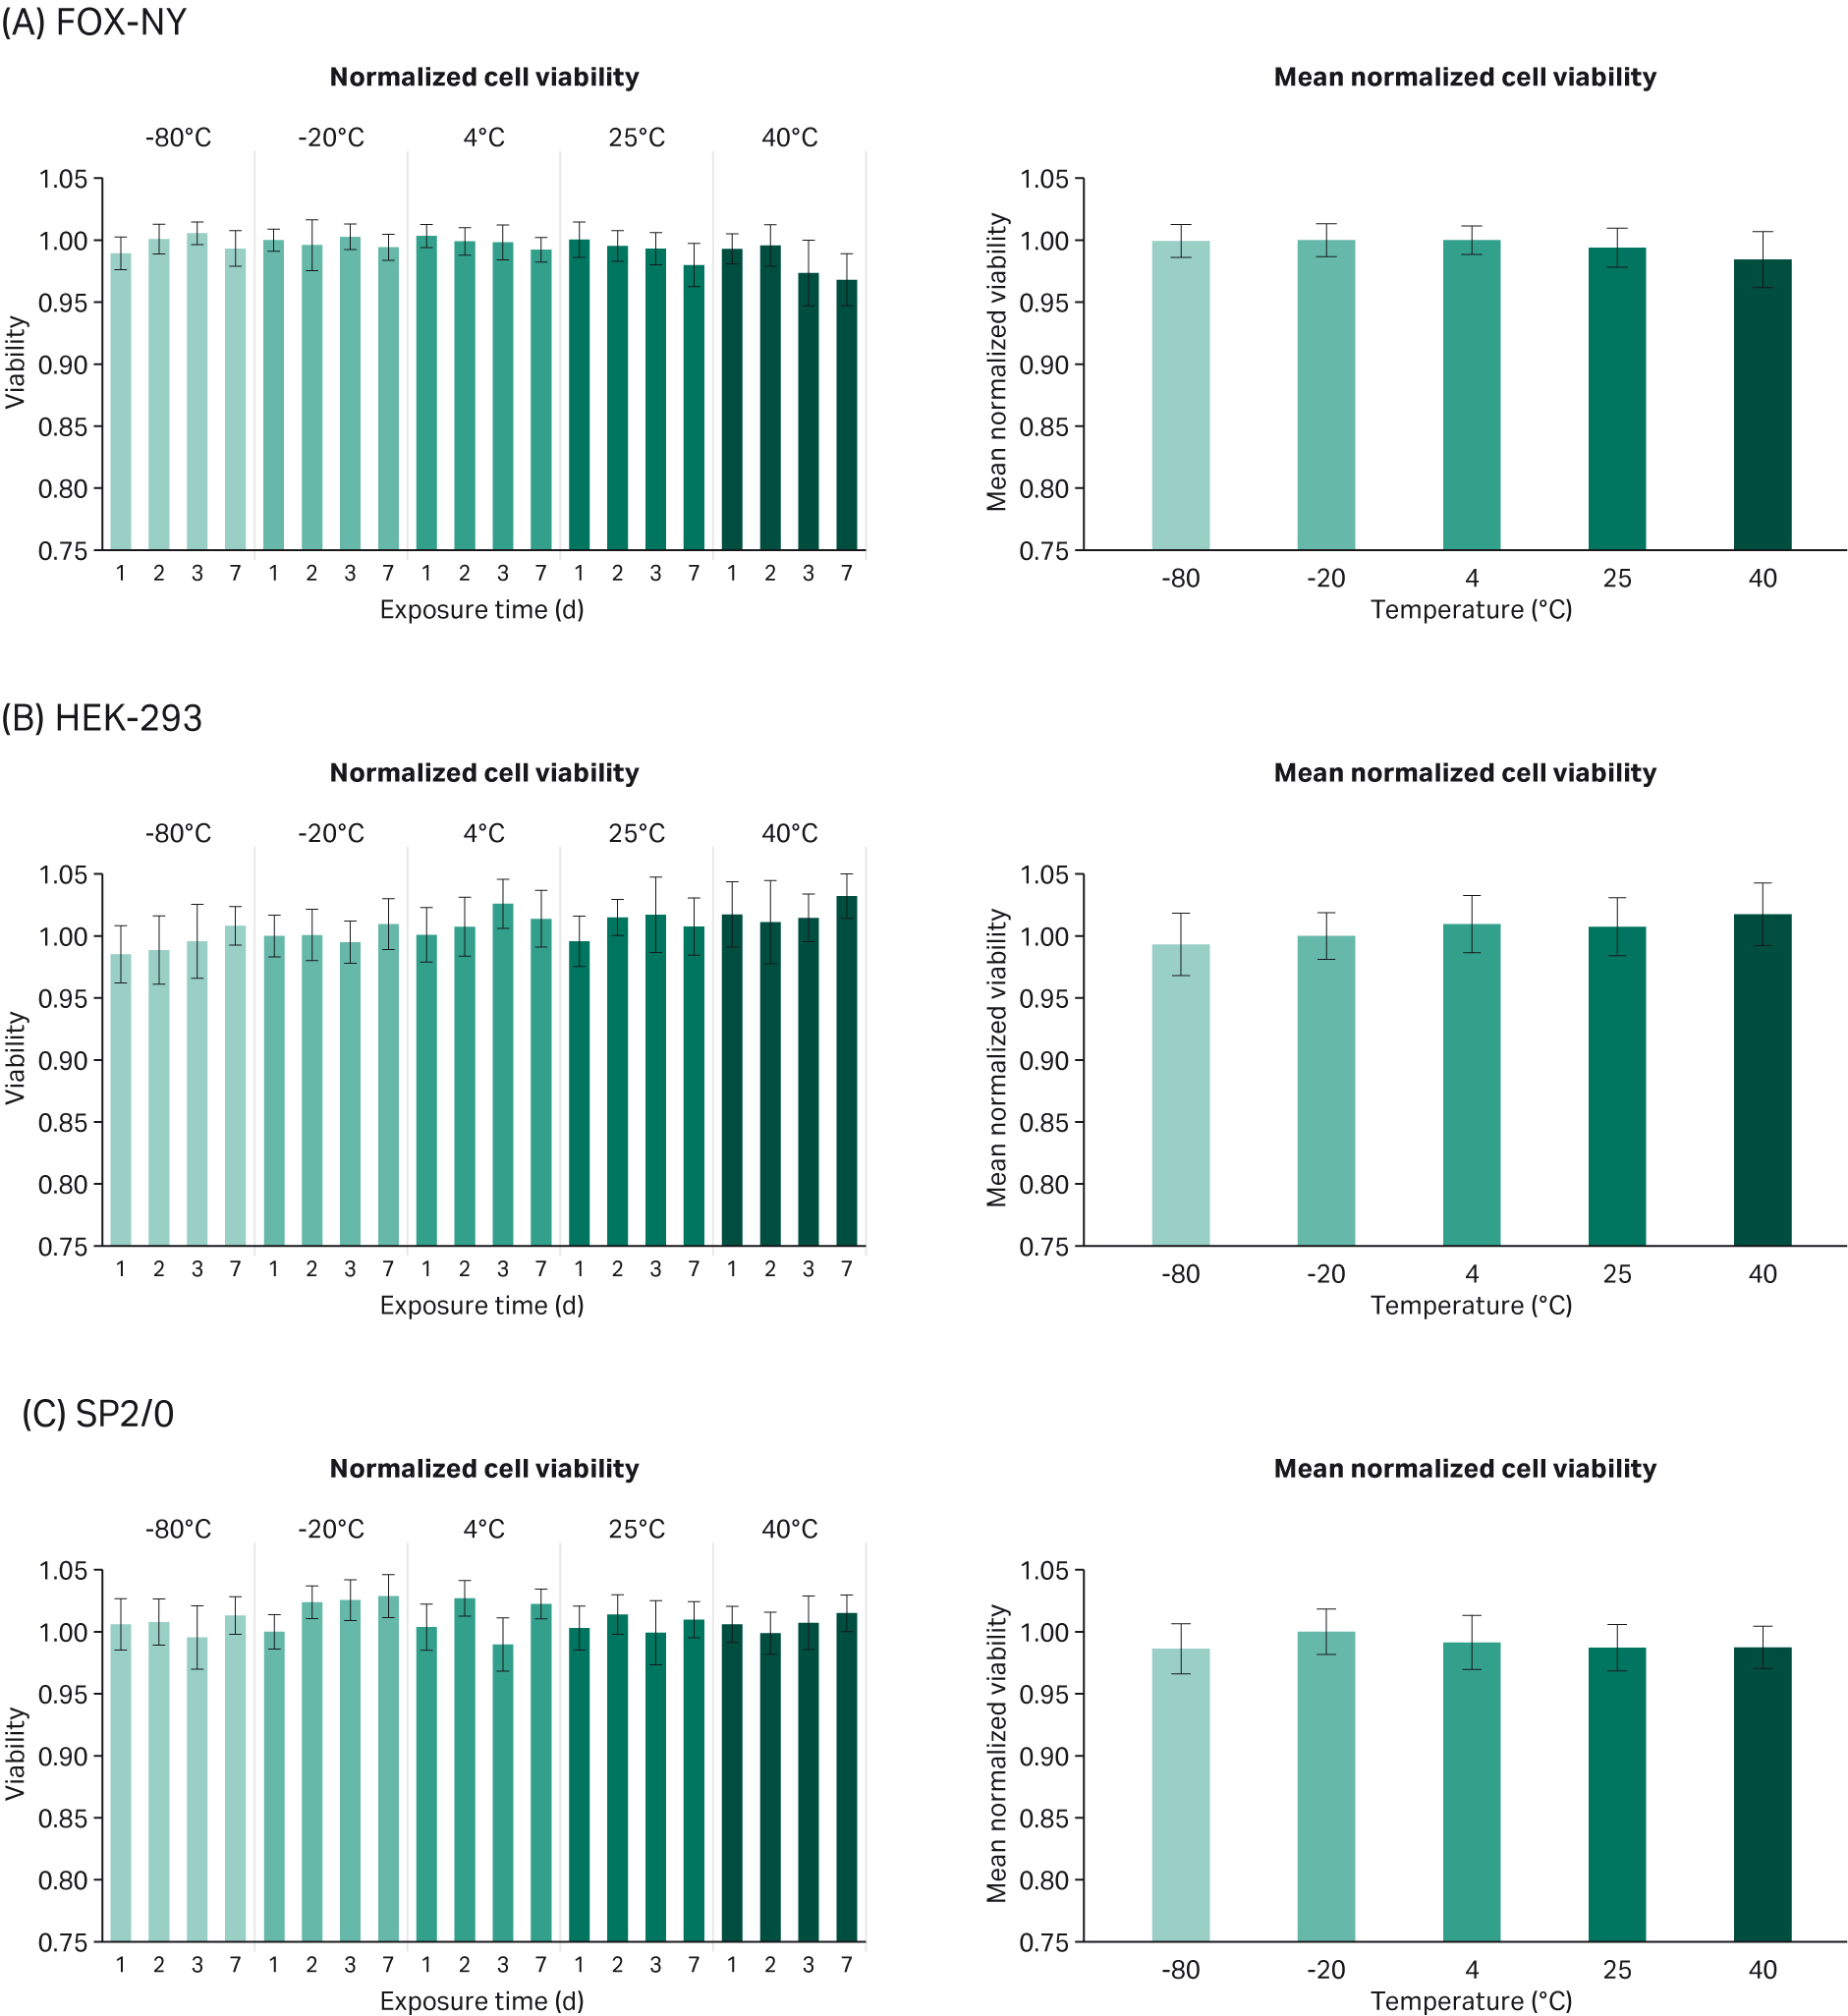
Fig 2. Mean normalized viability compared to -20°C control (average of days 1, 2, 3, and 7 exposure time) for each cell line: (A) FOX-NY, (B) HEK-293, and (C) SP2/0.
Metabolic panel analysis
Figure 3 summarizes the results from the metabolic panel analysis, with average metabolite levels between all three lots of serum for each cell line and storage temperature. The results across all lots of serum were consistent, except for the alkaline phosphatase, which denatured as expected at 40°C. Furthermore, we observe a consistent decrease in the lactate dehydrogenase (LDH) with increasing temperatures.
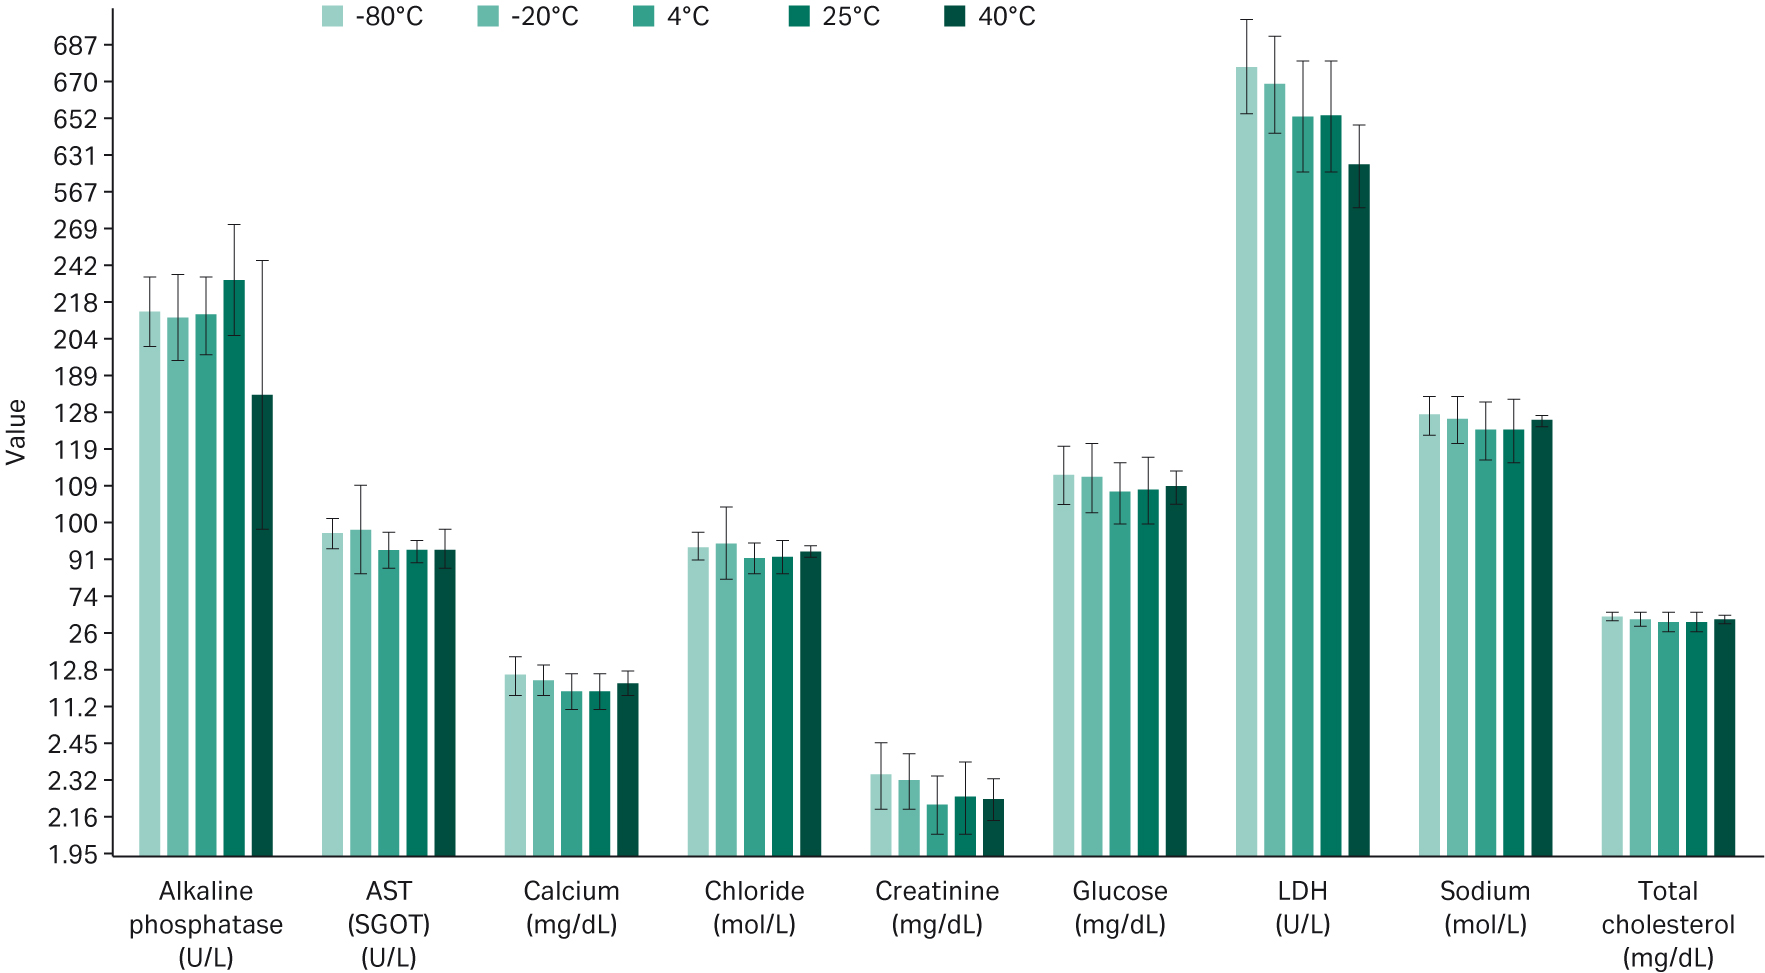
Fig 3. Averaged metabolic panel results for all three serum lots.
Physical characteristics of the serum
After the final thawing, sera stored at higher temperatures were observed to be lighter in color. We also observed that samples stored at 40°C between 3 and 7 d were slightly cloudy (Fig 4). Higher temperatures and longer time samples appear visibly lighter in color and more turbid.
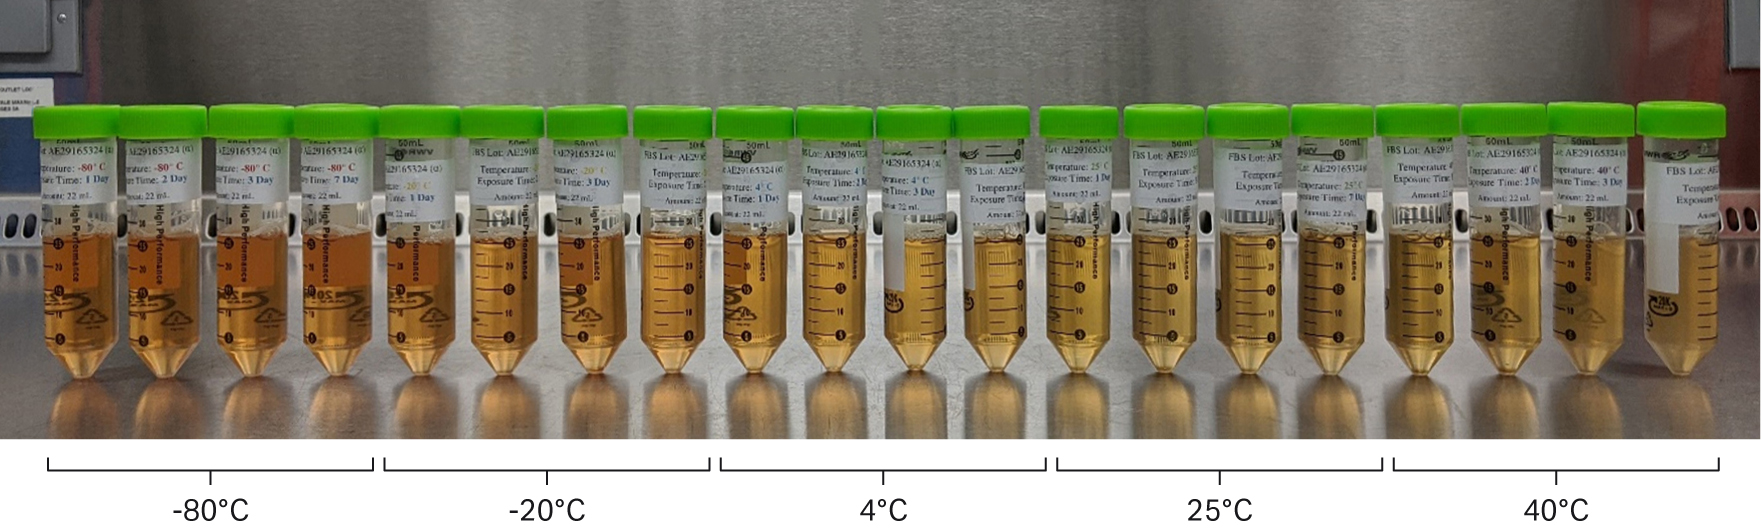
Fig 4. Visual characteristics of each serum condition from one of the lots tested. Samples arranged in sequence from left to right in order of low to high temperature and short to long storage time (1, 2, 3, and 7 d).
Optical density (OD) was higher in samples stored in these more extreme conditions (see Fig 5). An increase in OD represents an increase in serum turbidity, noted with higher OD at day 3 and 7 in the 40°C serum sample.
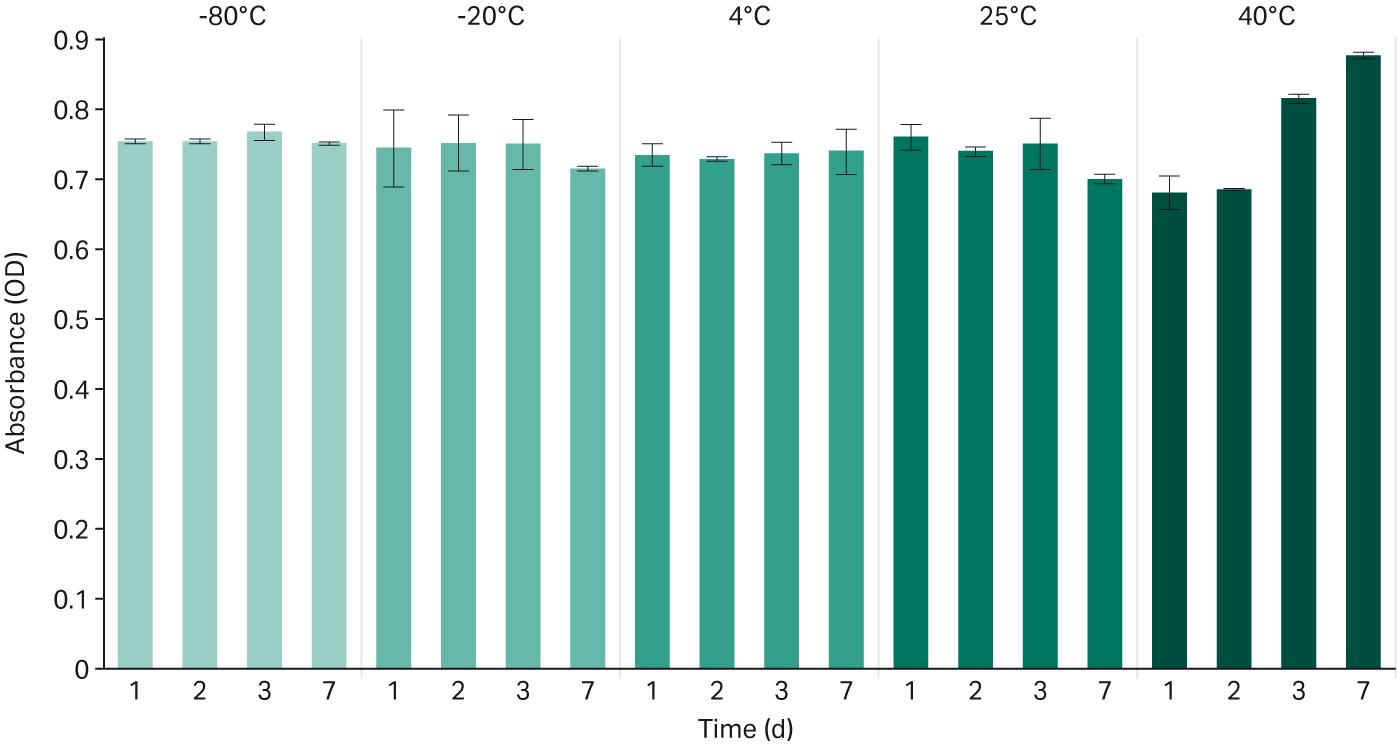
Fig 5. Optical density measured in absorbance at 410 nm for each temperature and time condition.
pH, osmolality, and endotoxins
The mean pH showed low variability between temperatures in each lot, staying consistent across all temperatures (Fig 6). Osmolality also showed little variation; each condition was at or near 290 mOsm/kg.
The endotoxin level was generally less than 1 EU/mL but was between 2 and 5 EU/mL in one lot of serum (Fig 6C). The standard deviation (SD) for endotoxin levels was affected by slightly higher levels in one serum lot. Nevertheless, deviations in endotoxin levels remained within the specification of < 25 EU/mL, which is the limit for characterized FBS.
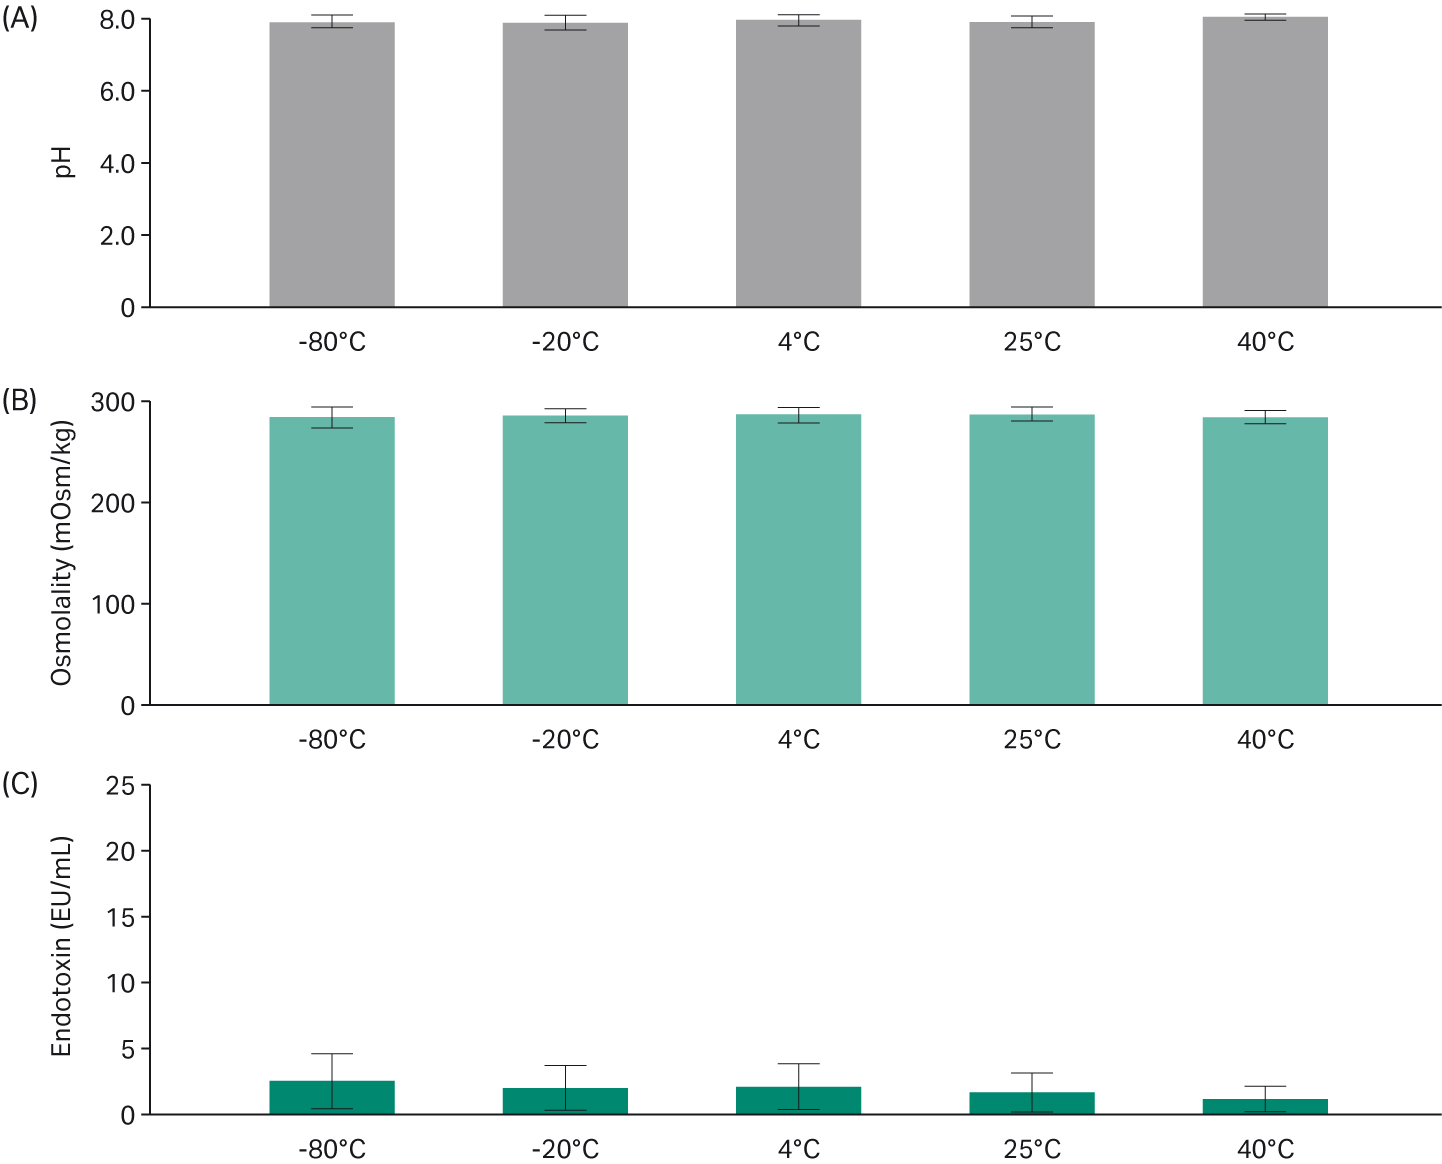
Fig 6. Averaged (A) pH, (B) osmolality, and (C) endotoxin results of each temperature condition.
Cell morphology
A representative selection of cell morphology images for the adherent cell lines at the -20°C treatment and 40°C storage temperatures is seen in Figure 7. The images captured, which were all taken on serum lot #3, show no visible differences in morphology between cell lines grown in different serum conditions. Furthermore, we observed no significant morphological changes in other storage temperatures or in SP2/0 and FOX-NY suspension cells (data not shown).
-20°C
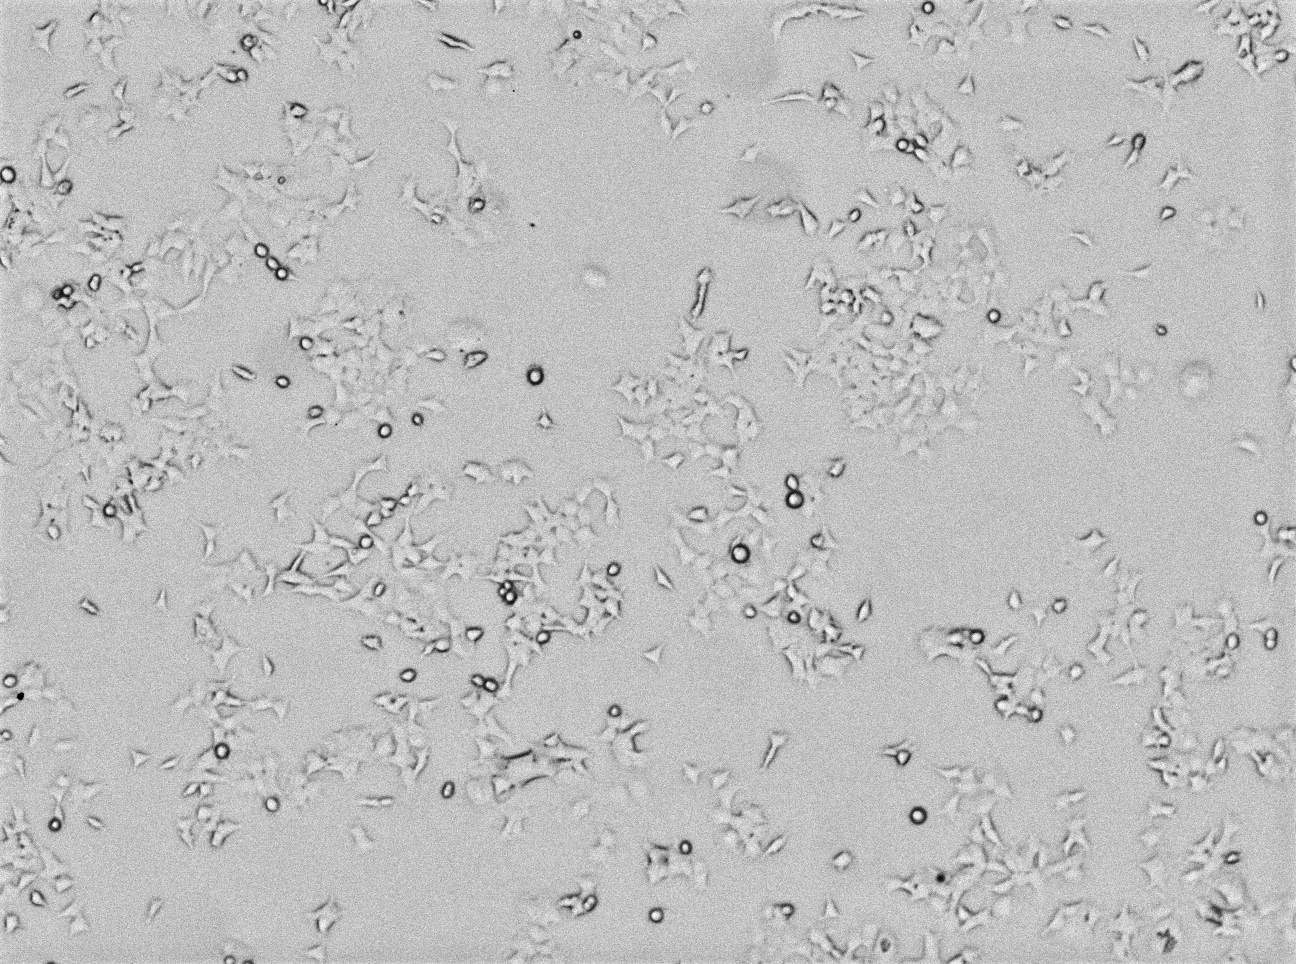
40°C
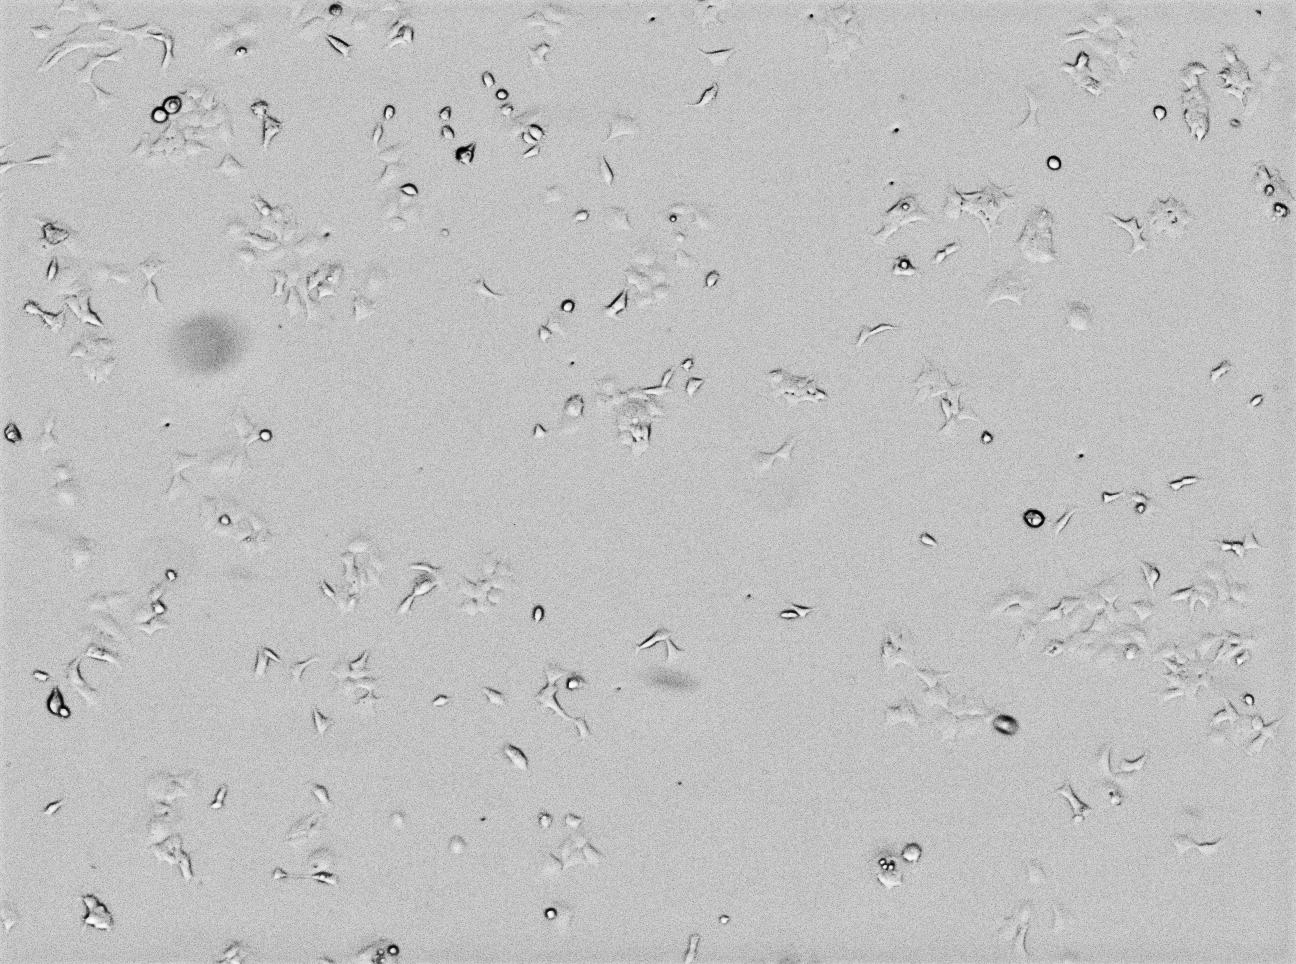
Fig 7. Images captured of HEK-293 adherent cells grown in each test condition of serum lot #3 showing confluence and morphology.
Conclusions
- From the results of the tested cell lines, serum lots, and temperature excursion conditions, we conclude that the temperature deviations may impact the visual appearance of the serum; however, it does not have a significant impact on the serum performance under the conditions tested.
- Viable cell density and cell viability grown in test conditions were at or near control levels.
- pH, osmolality, and endotoxin levels serum stored at higher temperatures remained within specifications.
Cell lines
Three cell lines, HEK-293, SP2/0, and FOX-NY, were selected for use in this study (Table 3). We selected these cell lines based on use by customers and internal quality control release testing.
Table 3. Cell culture overview: cell lines, culture medium, supplements, seed density, and culture method of the three cell lines used in the study
| Cell line | Cell culture medium | Supplements | Seed density (× 103 cells/cm2) | Culture method |
| HEK-293 CRL-1573 | DMEM high glucose | 10% FBS
4 mM L-glutamine |
4 | Adherent |
| SP2/0 CRL-1581 | DMEM high glucose | 10% FBS
4 mM L-glutamine |
10 | Static suspension |
| FOX-NY in-house hybridoma | DMEM high glucose | 10% FBS
4 mM L-glutamine |
1.2 | Static suspension |
Preparation of FBS supplements
Three separate frozen fetal bovine serum (FBS) lots were thawed and aliquoted in preparation for exposure to the test temperatures. We aliquoted each lot and stored in 50 mL centrifuge tubes for 1, 2, 3, and 7 d in -80°C, -20°C (control sample), 4°C, 25°C, and 40°C conditions. This gave a total of 20 serum conditions per lot. After each condition was stored for the allotted time, the treated FBS aliquots were frozen at -20°C in the centrifuge tubes.
Preparation of HyClone™ DMEM basal media
The treated and control FBS aliquots were thawed and added at a final concentration of 10% for each time and temperature condition to HyClone™ Dulbecco’s Modified Eagle (DMEM) basal media in 250 mL PETG bottles.
The final cell culture media were formulated with the addition of 4 mM L-glutamine to each media.
Cell culture and harvesting
Each cell line was thawed from cryopreservation and passaged to promote growth for a total of four times using media with 10% control serum in T-75 flasks. Passaging was repeated every three to four days and seeding performed at the cell densities shown in Table 1.
After the growth passages, the adherent cell lines were passed into six-well plates with two serum conditions/plate. The cells subsequently underwent four adaptation passages in triplicate for each condition before a final harvest. The two static suspension cell lines were passaged three times into T-25 flasks and once into six-well plates before harvest.
Serum performance was evaluated by measuring viable cell density (VCD) and viability using Beckman Coulter Vi-CELL XR. Plate images for study of cell morphology and visual changes to the serum (optical density measurements) were captured using both Molecular Devices SpectraMax i3x plate reader and EVOS XL Cor Imaging System (Thermo Fisher Scientific).
Serum analyses
In addition to VCD and cell viability, metabolic panel analysis was performed by a validated contract lab to detect changes in metabolite levels caused by the storage conditions. Changes in pH and osmolality were measured according to our standard procedures. Endotoxin levels were evaluated using an endotoxin testing instrument.
TR29775498
CY22181