We present proof of concept data to show how an intensified N-1 perfusion seed culture approach using ReadyToProcess WAVE™ 25 bioreactor supports a high-density seed in a production bioreactor. In this article, we show how the conventional N-1 seed train step was replaced by a high-density perfusion and how the production bioreactor can be seeded at a 10-fold higher seed density compared to conventional runs.
We grew Chinese hamster ovary (CHO) cells expressing a monoclonal antibody in HyClone™ brand ActiPro medium and fed with HyClone™ brand Cell Boost Supplement 7a and Cell Boost™ Supplement 7b. Batch cell culture was initially performed in shake flasks (SF) and then scaled to ReadyToProcess WAVE™ 25 bioreactor cultures (the N-1 step) in either batch or perfusion before transfer to a production bioreactor, Xcellerex™ XDR-500.
The method we describe lets you intensify your fed-batch process through reduced production duration without affecting the growth or titer profile. The reduced production duration increases the number of runs per year (yr) that can be scheduled in a production facility, resulting in a capacity increase without expanding the number of production bioreactors.
Introduction
Process intensification refers to strategies to maximize facility utilization and increase facility output. Although this commonly involves the design-in of continuous processing, the fed-batch culture is still predominant in stable protein production. Hence, strategies to intensify a fed-batch process can potentially increase productivity and reduce cost in biomanufacturing using mammalian cell culture.
Perfusion processes support high cell densities with retained exponential growth at high viability, which makes them interesting, not only for production processes, but also for seed train intensification. The up to 10-fold increased cell density can be used as a way of decreasing the size or the number of seed reactors resulting in reduced facility footprint and investment cost.
Using the high final density to seed the fed-batch production bioreactor at a higher cell density shifts the early growth phase in fed-batch production where the titer is low, to the smaller, less costly N-1 seed culture reactor. This shortens the production duration while titers remain the same. This strategy can remove bottlenecks in production chains and increase the volumetric yield, which results in intensification of the fed-batch biomanufacturing process.
In this article, we present proof of concept data to show that an intensified N-1 perfusion process supports a high-seed of a production bioreactor, which reduces the production duration. We used N-1 perfusion performed in ReadyToProcess WAVE™ 25 bioreactor for the seeding of an Xcellerex™ XDR-500 at a seed density 10-fold higher than a reference culture, which shortened the production process duration by 3 days (d), see Figure 1.
Note that although the article describes N-1 perfusion using WAVE™ 25, automated N-1 perfusion in volumes > 25 L can be combined with an XDR bioreactor using Xcellerex™ Automated Perfusion System (APS).
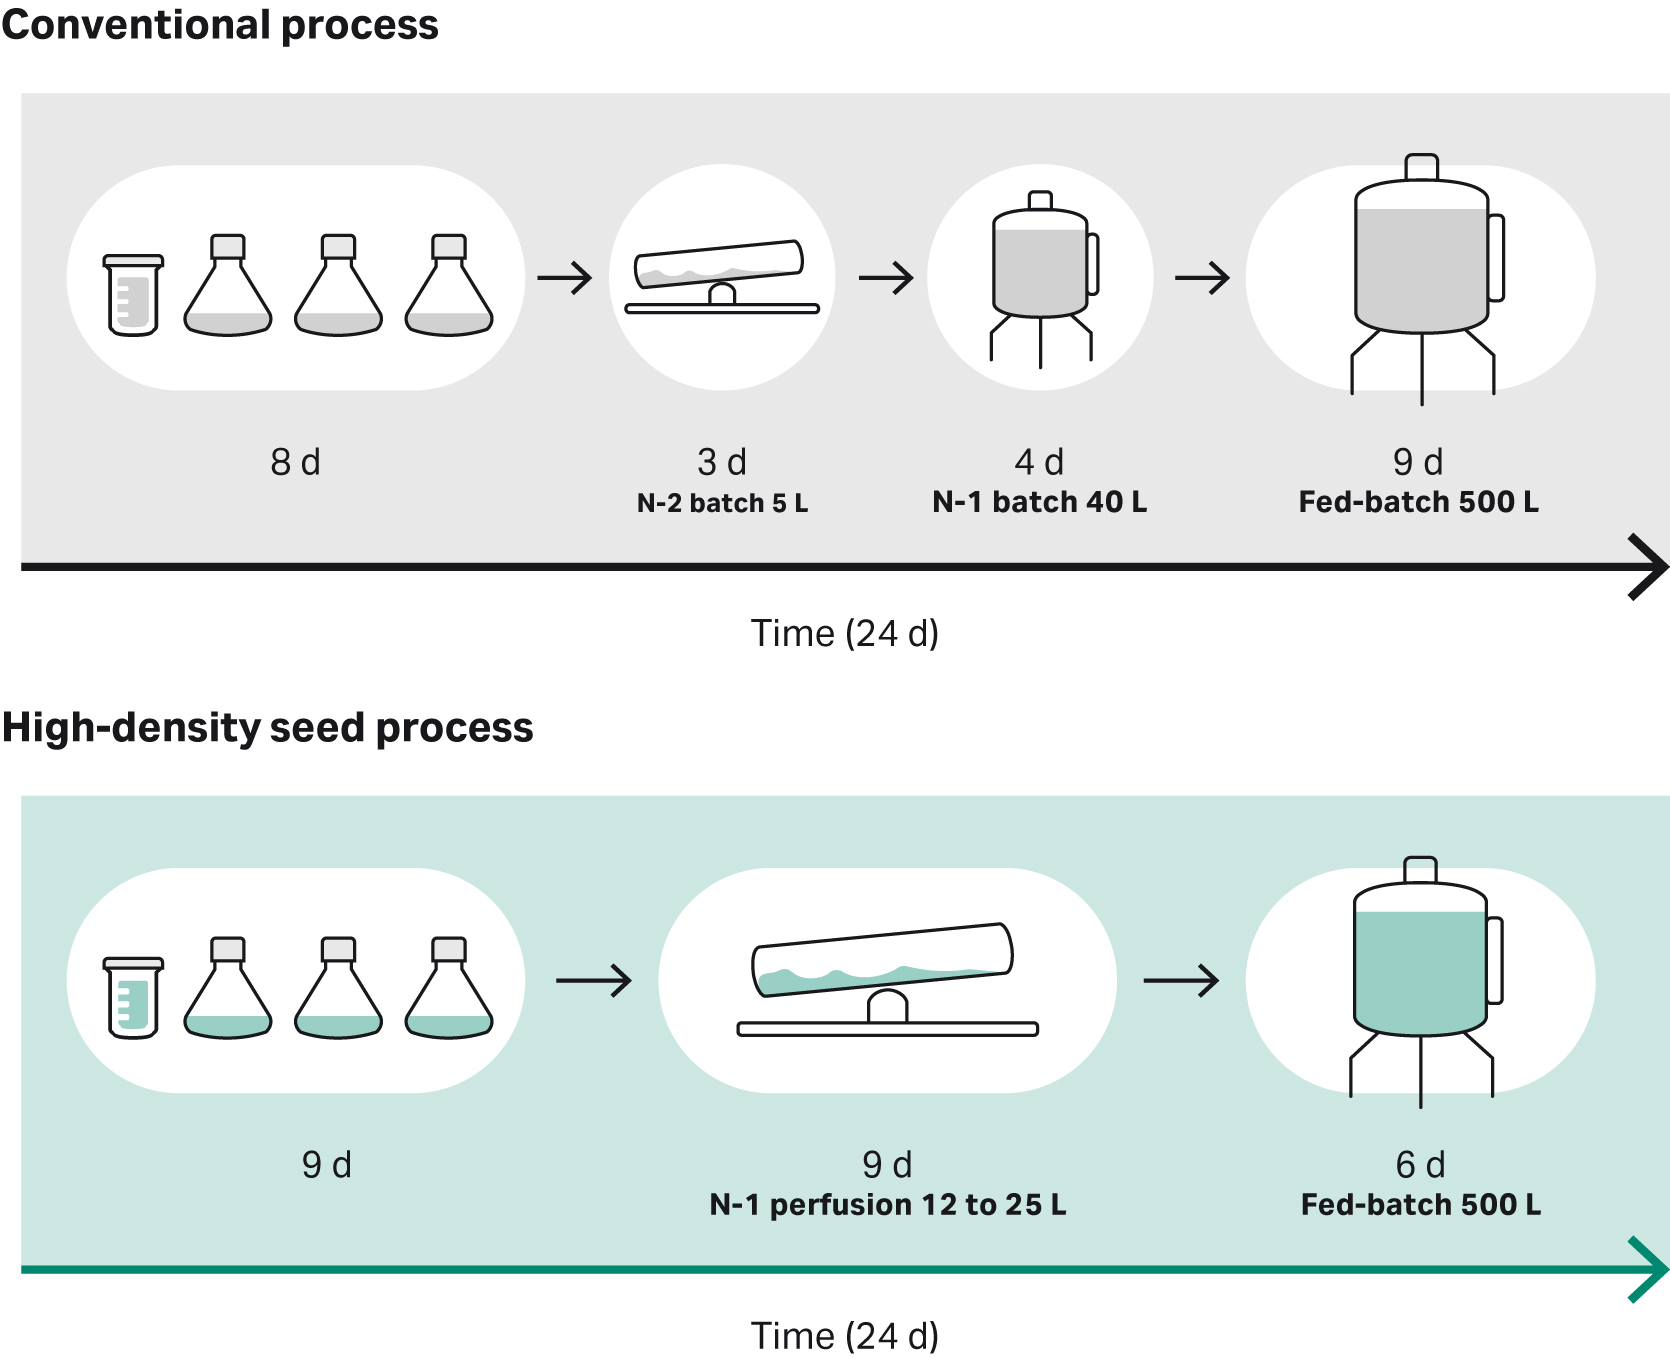
Fig 1. Overview of the conventional vs the intensified high-density seed process evaluated in the study.
See the bottom of the page for detailed Materials and methods
Results and discussion
Development of the high-density perfusion process in ReadyToProcess WAVE™ 25 bioreactor
The N-1 perfusion process was developed and performed in ReadyToProcess WAVE™ 25 bioreactor operated in perfusion mode. In the perfusion bags, cells are retained inside of the reactor by an integrated filter with a nominal pore size of 7 µm that floats on the culture surface.
The perfusion rate is controlled via an integrated load cell that ensures periodic addition and removal of equal amounts of feed and harvest. The integrated filter eliminates the requirement for an external recirculation loop. A schematic drawing of the perfusion setup is shown in Figure 2.
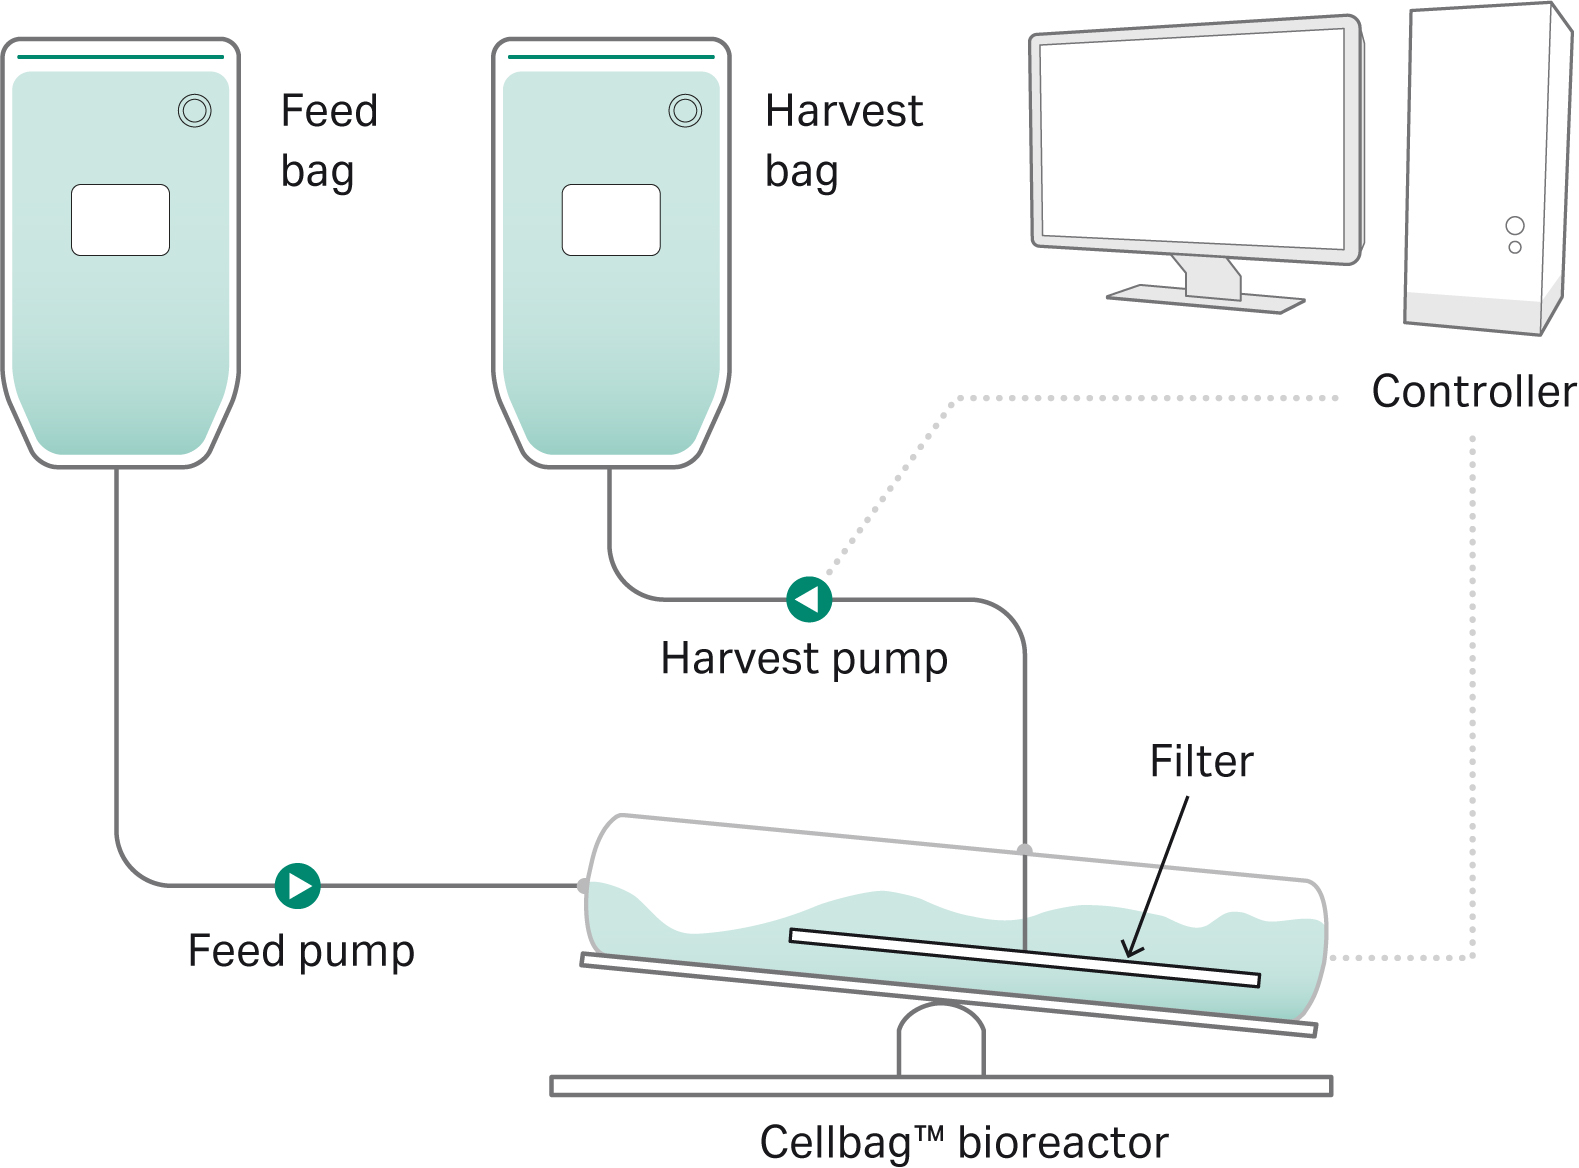
Fig 2. N-1 perfusion setup in ReadyToProcess WAVE™ 25 bioreactor.
A key factor in perfusion is the rate of media renewal and removal, that is, the perfusion rate. The goal is to have a perfusion rate that provides a constant environment favorable to the cells by continuous nutrient addition and by-product removal. In the cell-specific perfusion rate (CSPR) strategy for perfusion, the perfusion feed is added based on the number of cells and day, which efficiently keeps a constant environment and is an effective way to reduce the media consumption.
When replacing the seed-train batch with a perfusion process, you will have to take the increased media consumption and the effect on cost and footprint that follows into account. Hence, your perfusion process must be carefully optimized to balance growth rate and media consumption (1). The importance of keeping the perfusion rate to a minimum is illustrated by comparing the media consumption for reaching 100 × 106 cells /mL in 50 L scale using different CSPR — while a CSPR of 140 pL/cell/d would generate a media consumption of 1130 L, reducing the CSPR to 40 pL/cell/d only requires a volume of 320 L.
N-1 perfusion processes with cell densities in the range of 40 to 120 × 106 cells/mL with a total media consumption in the range of 2 to 5 reactor volumes (RV) have been described earlier (2,3). We performed process development in a 10 L perfusion bag at a working volume of 5 L to identify a perfusion rate that ensures maintained exponential growth at a minimum perfusion flow rate. The final process included a cell expansion step in half of the final culture volume for 2 d followed by media addition to full reactor working volume.
Perfusion was started at a cell density of 2 × 10⁶ cells/mL and a perfusion rate of 40 CSPR. Figure 3 shows that this perfusion rate allowed for exponential growth throughout the whole culture.
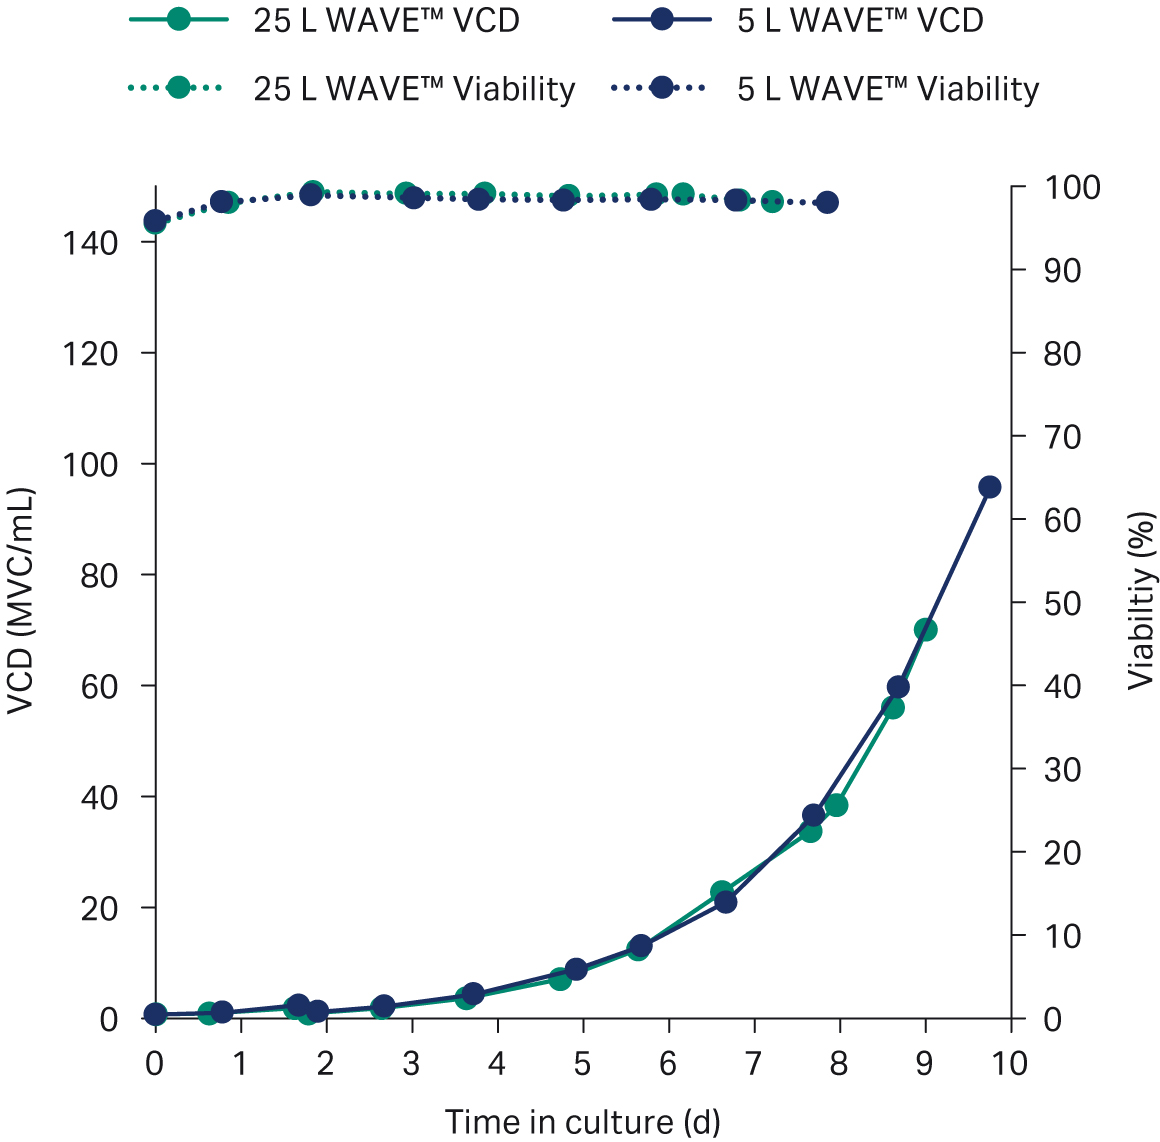
Fig 3. Growth profile (viable cell density in million viable cells per mL and viability in percent) of the N-1 perfusion process in ReadyToProcess WAVE™ 25 bioreactor, 25 L working volume (green) and 5 L working volume (blue).
For the final process, the perfusion was scaled to a 50 L perfusion bag. Cells were perfused to a cell density of 70 × 106 cells/mL at 98% viability in a 25 L working volume, with an average population doubling time of 30 h (Fig 4). The total perfusion media consumption was 107 L, corresponding to a total of 4.3 RV (Fig 4).
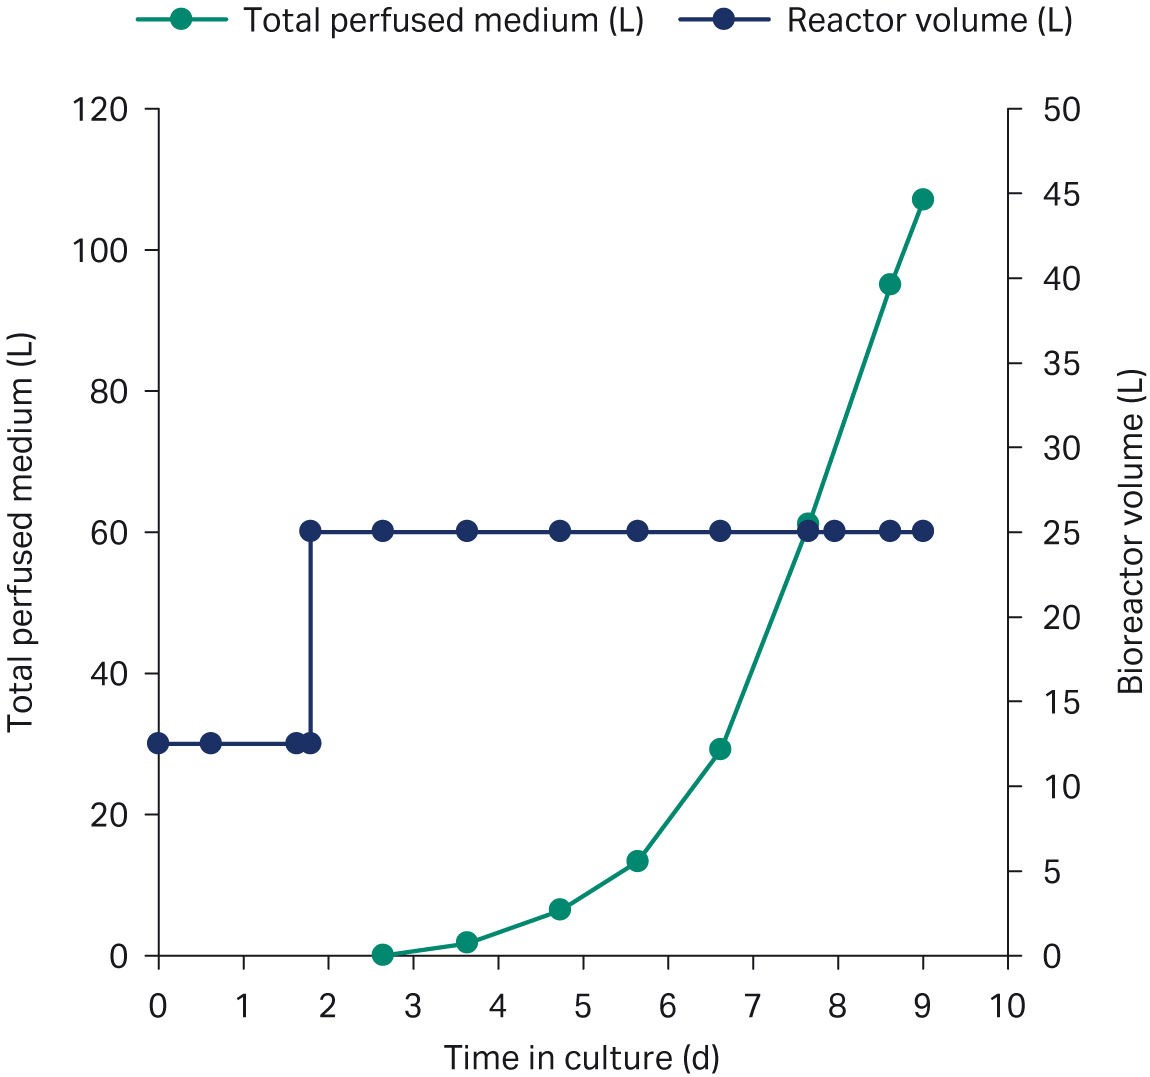
Fig 4. ReadyToProcess WAVE™ 25 bioreactor volume and perfused medium over the culture period.
High-seed fed-batch as compared to conventional fed-batch
A conventional seed train with N-1 in batch and an XDR-500 production bioreactor seeded at a cell density of 0.8 × 10⁶ cells/mL was performed as a baseline for the evaluation of the process comparability and efficiency increase by high-seed fed-batch. For the intensified process, the N-1 perfusion culture was used for seeding the XDR-500 production bioreactor at a cell density of 8 × 10⁶ cells/mL, a 10-fold increase compared to the conventional process. To ensure seamless transfer with continued exponential growth and peak viable cell density (VCD) comparable to the conventional process, the media at inoculation needs to be supplied with enough nutrients. Based on optimization in shake flasks, we spiked the media in the high-seed culture with Cell Boost™ 7a Supplement and Cell Boost™ 7b Supplement at a level corresponding to the daily bolus feeds.
Figures 5 and 6 are overlays of growth and productivity of the two processes. The growth curve in Figure 5 shows that the growth rate after seeding is maintained with no indication of stalling. The high-seed growth profile is the same as for the conventional process, with comparable peak VCD. The striking difference is the fact that the peak is reached 3 d earlier than in the conventional process (Fig 5). Comparable mAb product titers can be achieved with a process duration difference of 3 d (Fig 6). Hence, the high-seed process cut the production duration by 33%.
The results clearly show that the same production target can be achieved in shorter time through faster progression from growth into stationary production phase, without changing the production process.
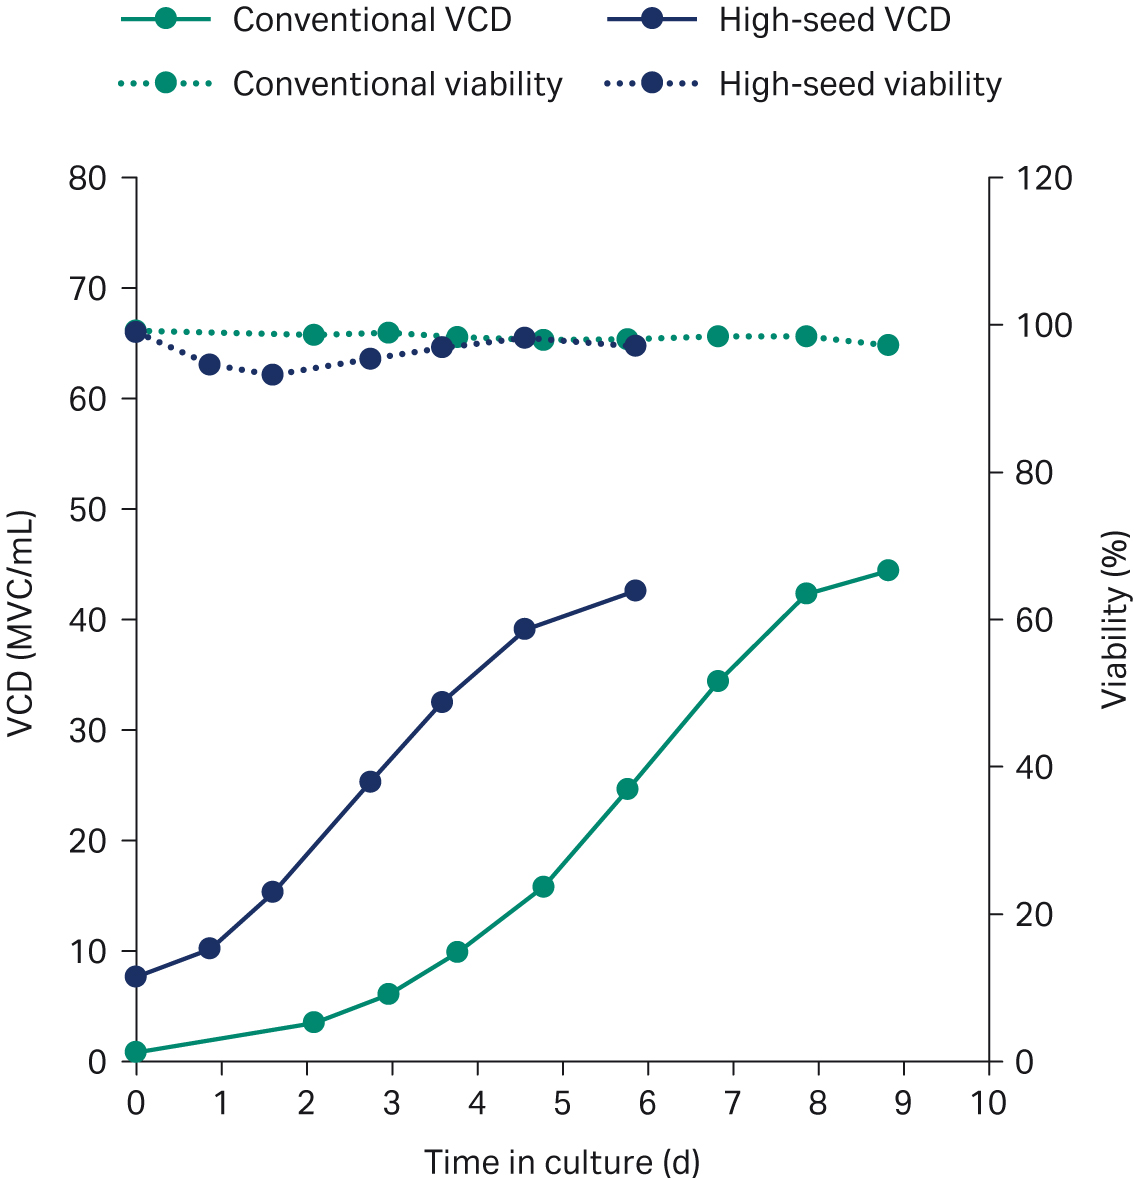
Fig 5. Growth profiles for the conventionally seeded (green) and the high-seed fed-batch process (blue) in XDR-500 bioreactor.
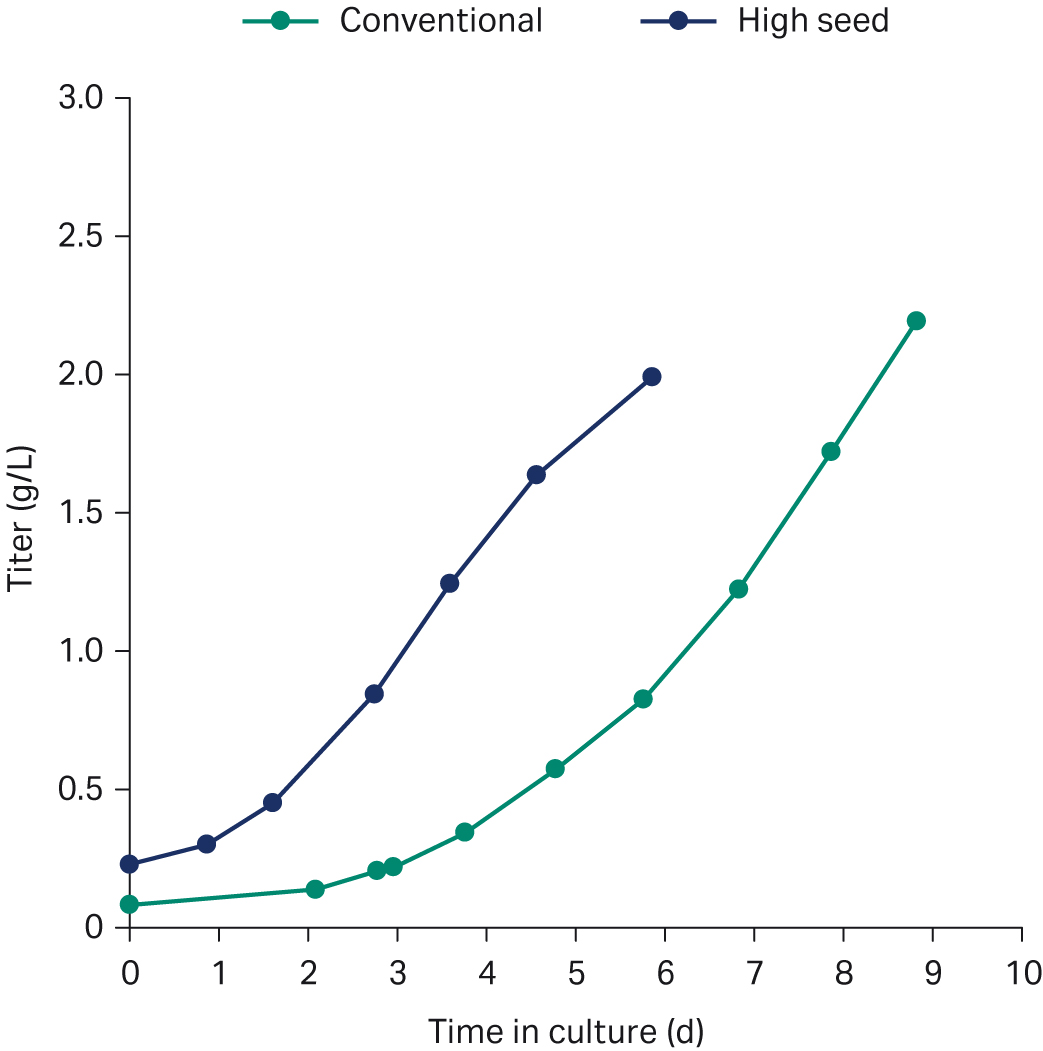
Fig 6. Titer profiles for the conventionally seeded (green) and the high-seed fed-batch process (blue) in XDR-500 bioreactor.
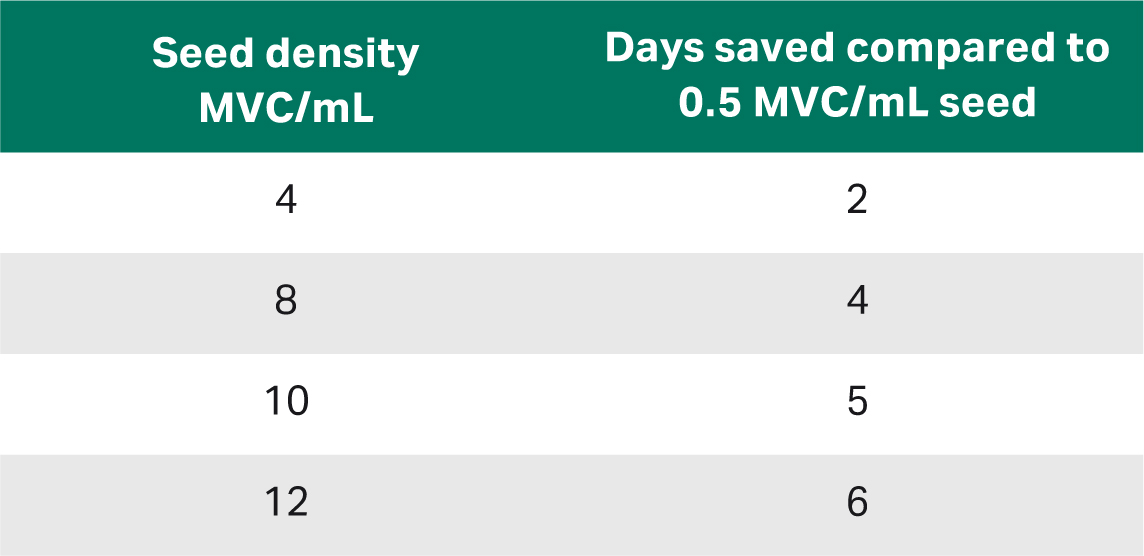
The number of days that can be saved will greatly depend on the cell line and its capacity to be seeded at a higher density. Different cell lines have different ranges for which seed densities can maintain exponential growth. The larger the gap is between the seed density of the conventional and high-seed process, the more days can be saved.
Table 1 presents an estimation of the number of days that can be saved dependent on the different seed densities in the high-seed process against the seed density in the conventional process assuming a population doubling time of 24 h.
Table 1. Estimated days saved by high-seed over conventional seeding
Process economy
A reduced run time for your production process by high seed increases the number of runs per year (yr) that can be scheduled in your production facility, resulting in a capacity increase without expanding the number of production bioreactors.
The actual maximum number of manufacturing batches/yr is dependent on the duration and the turnaround time of the N-1 seed culture, duration and turnaround time of the production process, and the ratio of available production to seed bioreactors.
The data in Figure 7 show that shifting 4 d of the fed-batch process to the seed train increases the number of batches from three to four in a 60-d period, representing a capacity increase of 33%. In a multidrug facility, this can be translated to an increase from three to four drugs that can be produced in a time span of 60 d. This type of scheduling should also take the facility layout into consideration as this affects the intervals allowed for shifting from batch to batch or drug to drug.
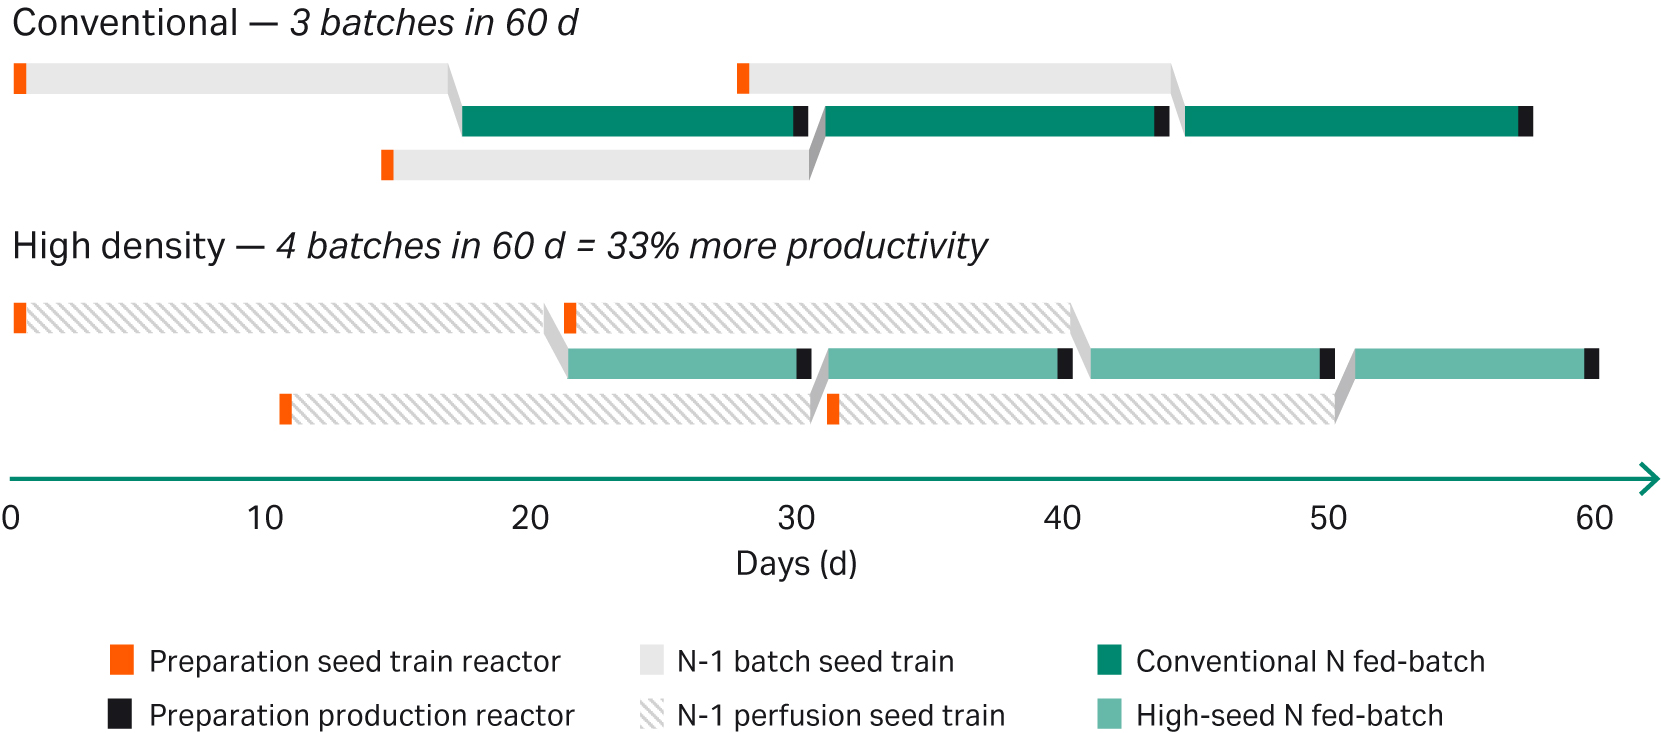
Fig 7. Scheduling a single bioreactor facility with either a conventional or a N-1 perfusion high-seed process.
Increasing the number of batches cultured/yr increases demands on downstream capacity.
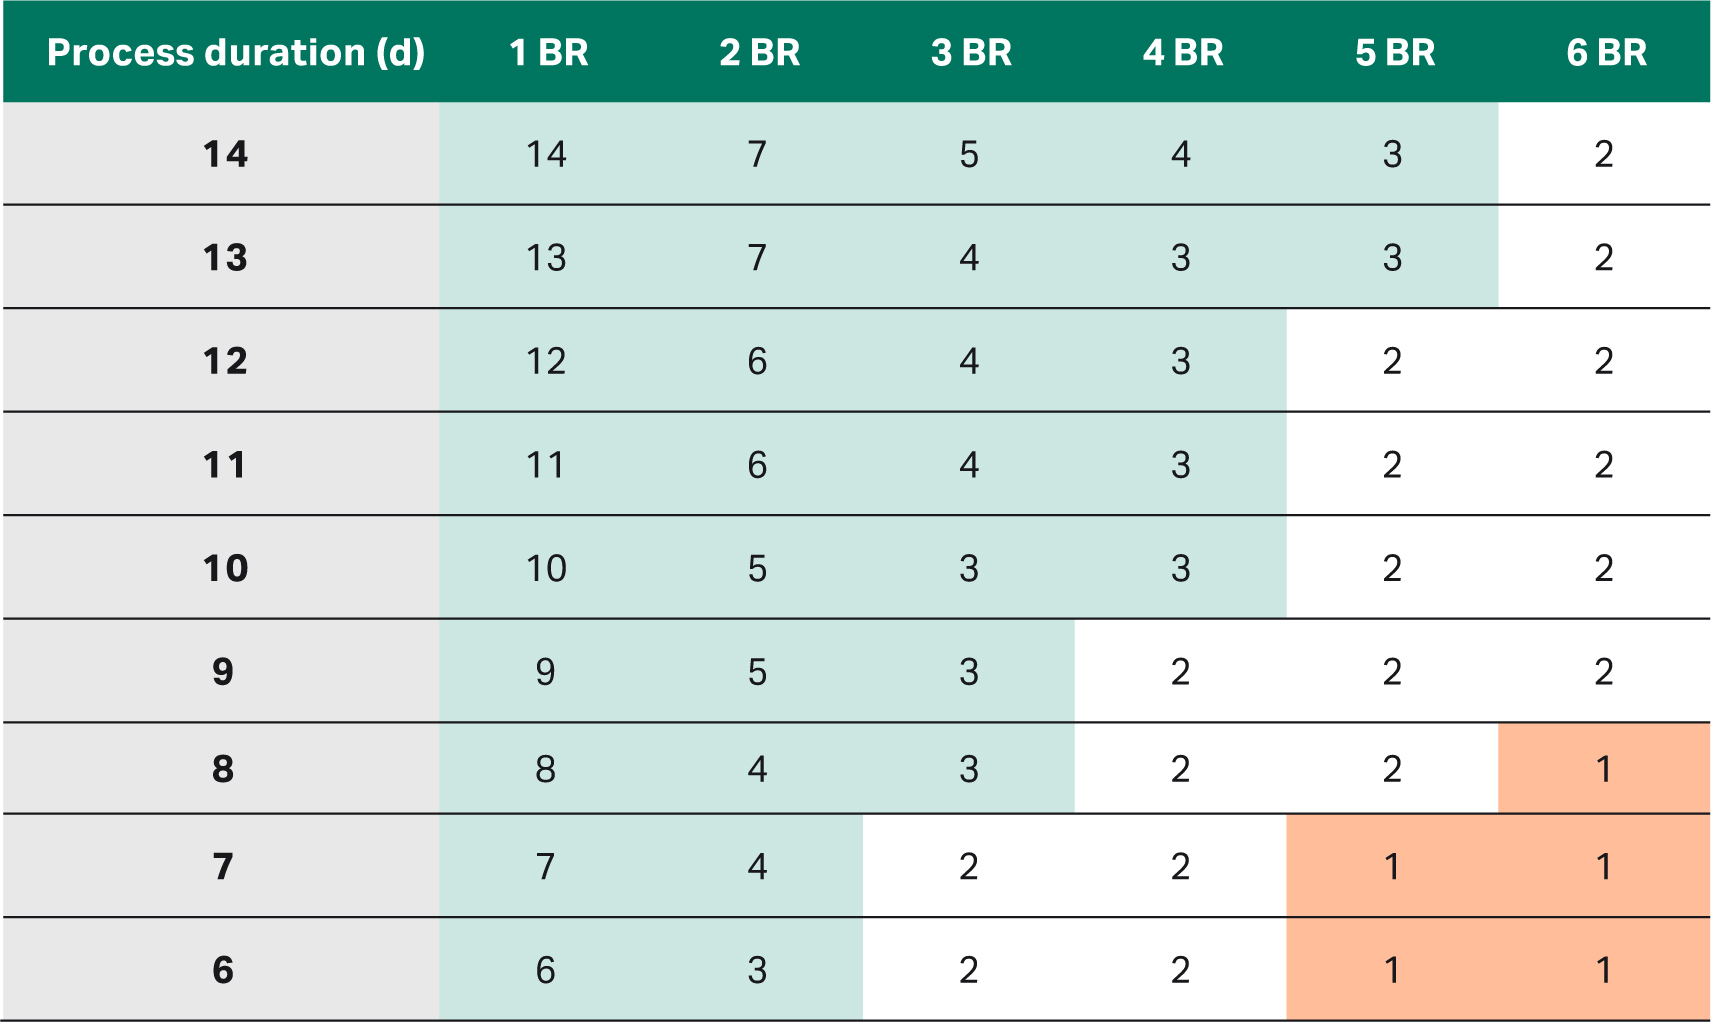
Table 2 details interval duration of harvests in days as it changes depending on the process duration and the number of bioreactors. In a facility with only a few bioreactor and long production processes, the interval duration is long (marked in green). A shorter production process can be introduced without challenging the downstream capacity. Hence, the benefits of intensifying process capacity by introducing a high-seed fed-batch process are more likely realized in small-scale facilities like CMOs.
In a facility with a short production process duration and many bioreactors, however, the interval duration is short (marked in red). Increasing the number of batches might lead to a bottleneck in the downstream processes unless measures are taken to increase harvest rate such as modifying the facility layout or adding additional downstream line.
Table 2. Interval duration between harvests depending on process duration of up to 14 d and up to six production bioreactors (BR)
Conclusions
- The method we describe lets you intensify your fed-batch process through reduced production duration without affecting the growth or titer profile.
- N-1 perfusion can potentially allow very high-density seed cultures up to 100 MVC/mL compared with only 5 MVC/mL using conventional methods.
- Process intensification of the seed train by the introduction of perfusion potentially reduces your costs and expands the productivity of your facility.
- Shorter production duration for a single bioreactor facility speeds up the overall upstream process — the high-seed N-1 perfusion process allowed 33% more productivity than a conventional N-1 fed-batch process over 60 d.
References
- Konstantinov et al. The “push-to low” approach for optimization of high-density perfusion cultures of animal cells Cell Culture Engineering, pp 75–98 (2006). doi: 10.1007/10_016
- Clincke et al. Very high density of CHO cells in perfusion by ATF or TFF in Wave-bioreactor Part I. Effect of the cell density on the process. Biotechnol. Prog. 29(3): 754–767 (2013). https://doi.org/10.1002/btpr.1704
- One-step seed culture expansion from one vial of high-density cell bank to 2000 L production bioreactor. Cytiva, CY13647-21May20AN
Materials and methods
Two processes are described in the study — 1) conventional seeding of an XDR-500 single-tank stirred bioreactor and 2) high-density seeding of an XDR-500 using intensified perfusion.
Cell line and media
Chinese hamster ovary (CHO) cell line expressing the immunotherapeutic mAb, Herceptin™ (Genentech Inc.), was used in all experiments. We used ActiPro™ medium with 37.5 μM of methionine sulfoximine (MSX) in all seed train steps in shake flasks, while no MSX was added to seed train steps run at production bioreactor scale.
Conventional N-1 seed train process in ReadyToProcess WAVE™ 25 bioreactor
We performed the conventional N-1 step in batch using a 50 L Cellbag™ bioreactor container (CB0050L11-31). Culture was performed in ActiPro™ medium. To minimize open handling, cells expanded in shake flask cultures were transferred to the reactor at half of the maximum working volume, 12.5 L. After seeding in to prewarmed ActiPro™ at a cell density of 0.5 × 10⁶ cells/mL, cells were expanded for 1 d followed by a media increase to 25 L and then cultured for additional 4 d to a cell density of 8 × 10⁶ cell/mL.
High-density N-1 perfusion seed train process in ReadyToProcess WAVE™ 25 bioreactor
For the N-1 perfusion we used a ReadyToProcess WAVE™ 25 bioreactor equipped with a 50 L Cellbag™ bioreactor container (CB0050L11-34). To minimize open handling, cells expanded in shake flask cultures were transferred to the reactor at half of the maximum working volume of 12.5 L. After seeding in to prewarmed ActiPro™ at a cell density of 0.7 × 10⁶ cells/mL, cells were expanded for 2 d followed by a media increase to 25 L. After one additional day and at a cell density of 2.0 × 10⁶ cells/mL, perfusion was initiated and maintained at a CSPR of 40 pL/cell/day using a media mixture consisting of ActiPro™, Cell Boost™ 1 and 3 supplemented with 2 g/L poloxamer. The culture was controlled at a pH of 6.8, 40% DO, and a temperature of 37°C. Target criteria was 60 to 100 × 106 cells/mL at a viability of > 95% and a population doubling time of < 40 h. For feed and perfusate, we used ReadyCircuit™ 100 L 3-D bag assemblies (code no. 12410206).
Conventional production process in XDR-500 bioreactor
We used cells from the conventional, N-1 batch WAVE™ 25 culture for seeding an XDR-500 bioreactor in a final volume of 250 L and a cell density of 0.8 × 10⁶ cells/mL. Starting at day 3, the reactor was fed with Cell Boost™ 7a Supplement and Cell Boost™ 7b Supplement once daily. The daily feed volumes, related to the initial working volume, were 2.5% and 0.25%, respectively. We added glucose to a final concentration of 4 g/L as levels had decreased below 2 g/L at sampling.
The culture was controlled at 40% DO, and a temperature of 37°C. A pH strategy to reduce lactate was implemented, starting the culture at a set-point of pH 7.0, reducing it to pH 6.9 as lactate reached levels over 2 g/L, and reset to 7.0 when lactate had been consumed to 2 g/L again. A 1 mm drilled-hole sparger was used for efficient CO2 stripping. Target criteria was 40 to 50 × 106 cells/mL at a viability of > 95%.
Production process in XDR 500 after high-density N-1 perfusion
The WAVE™ 25 N-1 perfusion culture was used for seeding the XDR-500 reactor at a cell density of 8 × 10⁶ cells/mL in a total volume of 220 L. The inoculation media was prewarmed ActiPro™ supplemented with 2.5% and 0.25% Cell Boost™7a and Cell Boost™ 7b, respectively to support the nutrient demands of the high cell concentration. The daily feed volumes of Cell Boost™ 7a and 7b, related to the initial working volume, were 2.5% and 0.25%, respectively. We added glucose to a final concentration of 4 g/L as levels had decreased below 2 g/L at sampling. The culture was controlled as the conventional described above.
Analysis
Daily samples were taken from the reactors and analyzed. Viable cell density (VCD) and viability were measured using Vi-CELL™ XR (Beckman Coultier). The pH, pO2, and pCO2 were measured using an ABL9 blood gas analyzer (Radiometer). Product titer, nutrients, and metabolites were all measured on a Cedex™ Bio Analyzer (Roche).
TR29491642
CY18727