Within biopharmaceutical production there is a shift from manually monitoring processes to real-time control and automated intervention. The goal is to develop algorithms and AI solutions which are able predict outcomes and create autonomous systems. The first step towards this goal is to use reliable and robust in-line sensors for real-time process control. This paper exemplifies how to use available and reliable sensors for in-process control of several different upstream and downstream process parameters.
Monitoring cell culture in a connected mAb manufacturing process
Manual off-line analysis of bioreactor samples is disadvantageous because it does not show trends or warnings when parameters are outside their acceptable ranges. In addition, it takes time and resources to analyze the results. In contrast, in-line sensors provide a continuous stream of data which offers better trend control through the ability to react to deviations in parameters before they are outside of their acceptable ranges. Another benefit of using in-line sensors is that it reduces the number of off-line analyses needed for monitoring and the number of samples sent to analytical support. Figure 1 shows an overview of a closed and connected bioprocess, along with the sensors for process control and Critical for Quality Attributes (CQA). This application note will provide one downstream and two upstream examples of using in-line sensors providing real-time data to control processes.
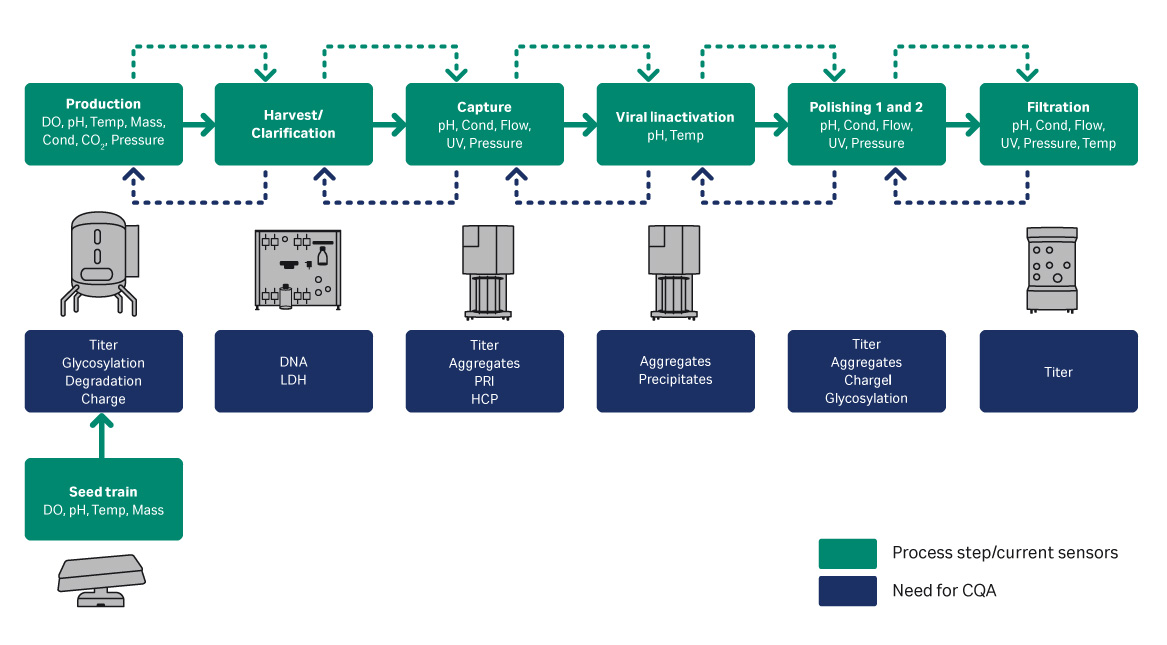
Fig 1. Example bioprocess with sensors and CQA.
Biomass sensor control for steady-state perfusion
A key parameter to keep a perfusion culture healthy is to maintain the optimal bleed rate. The bleed rate is important for performance of a bioreactor influencing cell viability and product production rate. In this proof of concept experiment, shown in Figure 2, a capacitance-based cell density probe (Incyte) was used to measure the viable biomass of Chinese Hamster Ovary (CHO) cells in an XDA-10 Pro Plus bioreactor bag. The signal from the Incyte probe was used to control the internal XDR pump which then regulated the bleed rate. A comparison of the viable cell density (VCD) values between the Incyte probe and off-line cell counts, shown in Figure 3, shows that it is possible to automate control of the bleed rate.
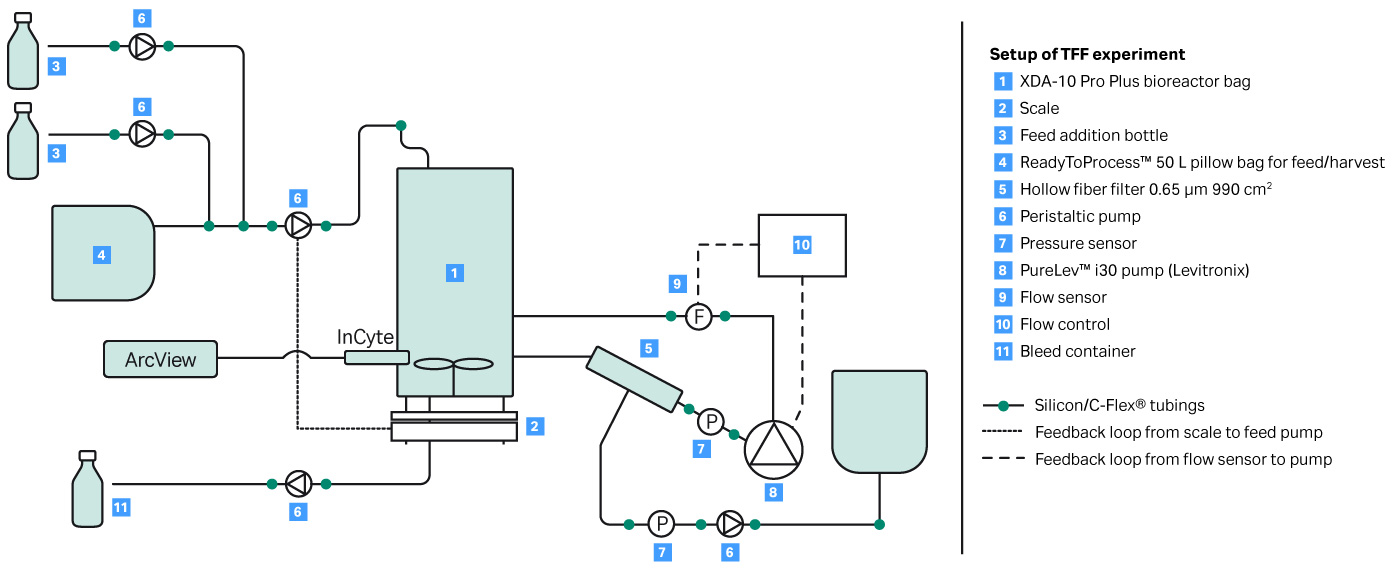
Fig 2. Experimental setup for automated bleeding of perfusion cell culture using VCD.
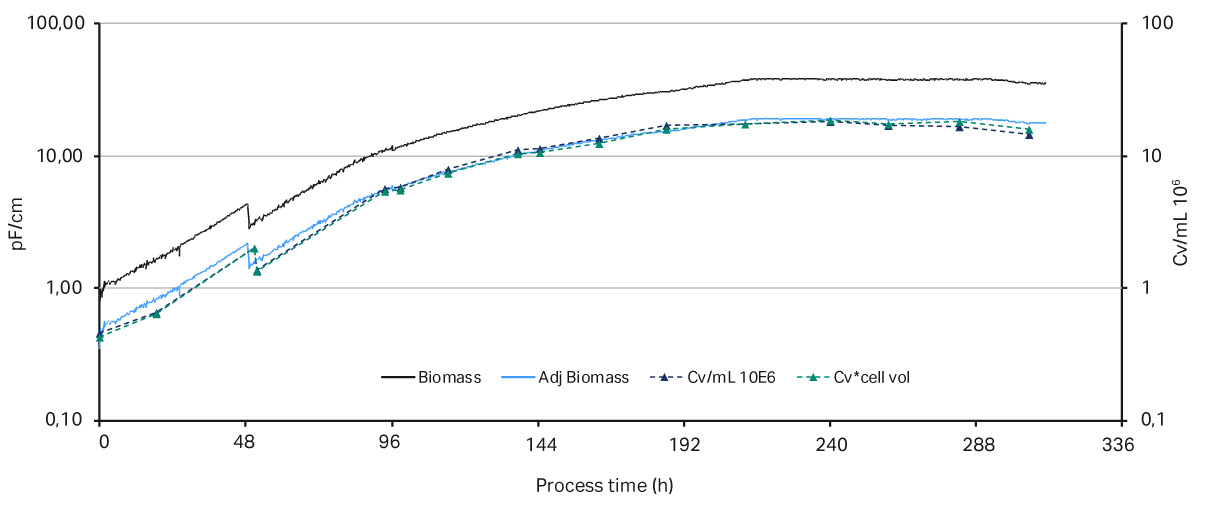
Fig 3. Comparison of the biomass values from Incyte probe vs off-line cell density. The permittivity biomass values (measured in pF/cm) were adjusted in the y-axis by a compensation factor.
Developing an automation loop for controlling glucose addition
By real-time monitoring of specific components, a cell culture can be closely controlled. Feedback loops based on prediction algorithms can be used to further reduce the need for manual handling of cultures and the risk of contamination. In this study, near infared (NIR) spectroscopy was used to predict glucose concentration in a cell culture in real-time. The predicted glucose values were then used to adjust glucose levels to a given set point via an internal pump in an XDR-10 bioreactor.
NIR spectroscopy has been used for decades in the bioprocess industry to analyze individual components from raw materials to product quality control. There are several advantages to using NIR, including:
- Noninvasive, absorption-based measurement
- Quick method of measurement, 16 full spectra scan take less than 1 min
- Can be used for in-line analytics as it requires no sample preparation
- Daylight and fluorescence do not interfere
OPUS software was used to develop a multivariate model to predict glucose, lactate, and VCD in a fed batch culture. A systematic approach, shown in Figure 4, was used to develop the model, which was initially developed on a 2 L benchtop scale.
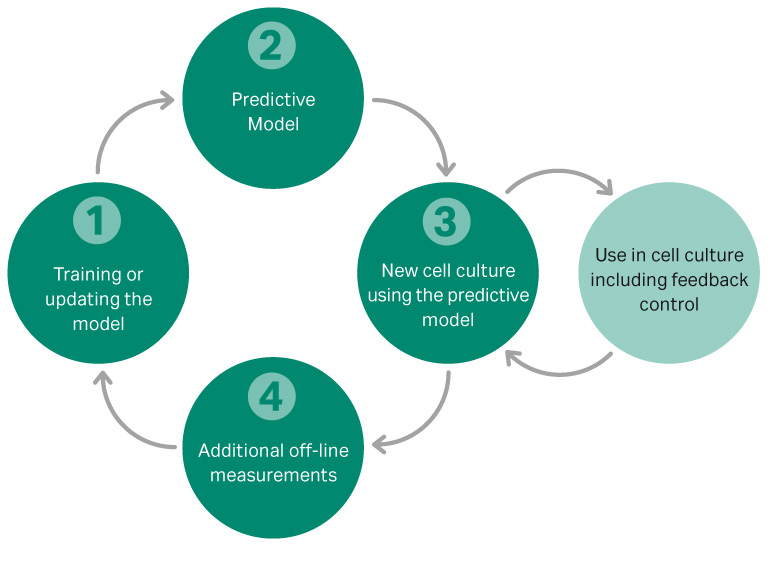
Fig 4.Workflow for the development of a feedback loop model for controlling VCD and glucose.
Material and methods
It is important to perform a well-designed pre-study to investigate factors that may introduce noise into the data and to separate noise from actual parameter information. Parameters investigated in our pre-study included:
- Cell line
- pH
- Dissolved oxygen (DO)
- Probe design
- Glucose and lactate spiking
- Agitation
- Media
- Working volume
The initial model for predicting glucose and VCD was based on five fed-batch cultivations and a set of spiking experiments, where the concentration of glucose and viable cells were altered to expand the experimental space. This glucose prediction model was then used to construct a feedback loop controlling the glucose pump for a SU Xellerex™ XDR-10 bioreactor in real-time.
Results
The results in Figures 5 show that the feedback loop worked, and that glucose was added when the NIR sensor predicted glucose concentrations below 3 g/L. However, when comparing the in-line data with the off-line measurements, as seen in Figure 6, there was a large difference in VCD values, clearly demonstrating that our predictive model was too weak and needed more training data before being able to fully support a glucose feedback loop. Overall this experiment supports further investigation into this area. It also demonstrates that it is fully possible to automate your glucose control via a NIR glucose probe, model, and internal XDR-pump.
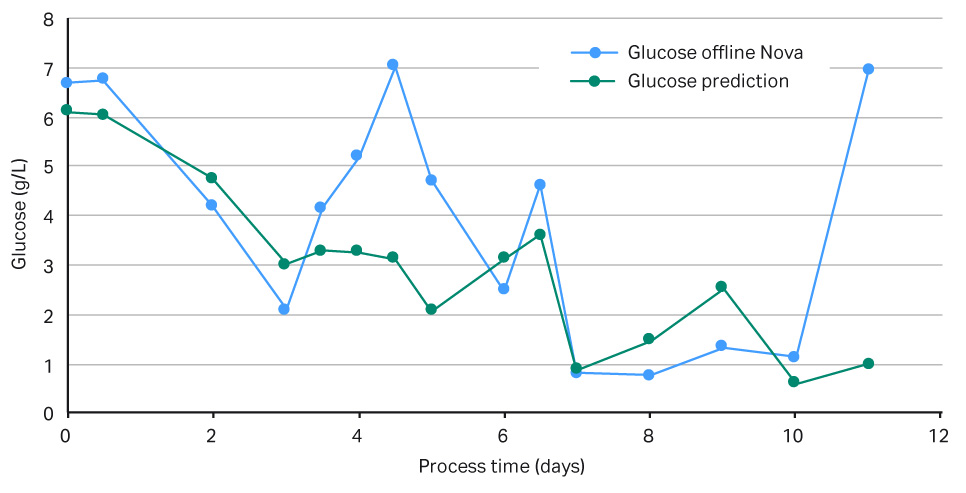
Fig 5.Graph of measured versus predicted glucose levels in g/L.
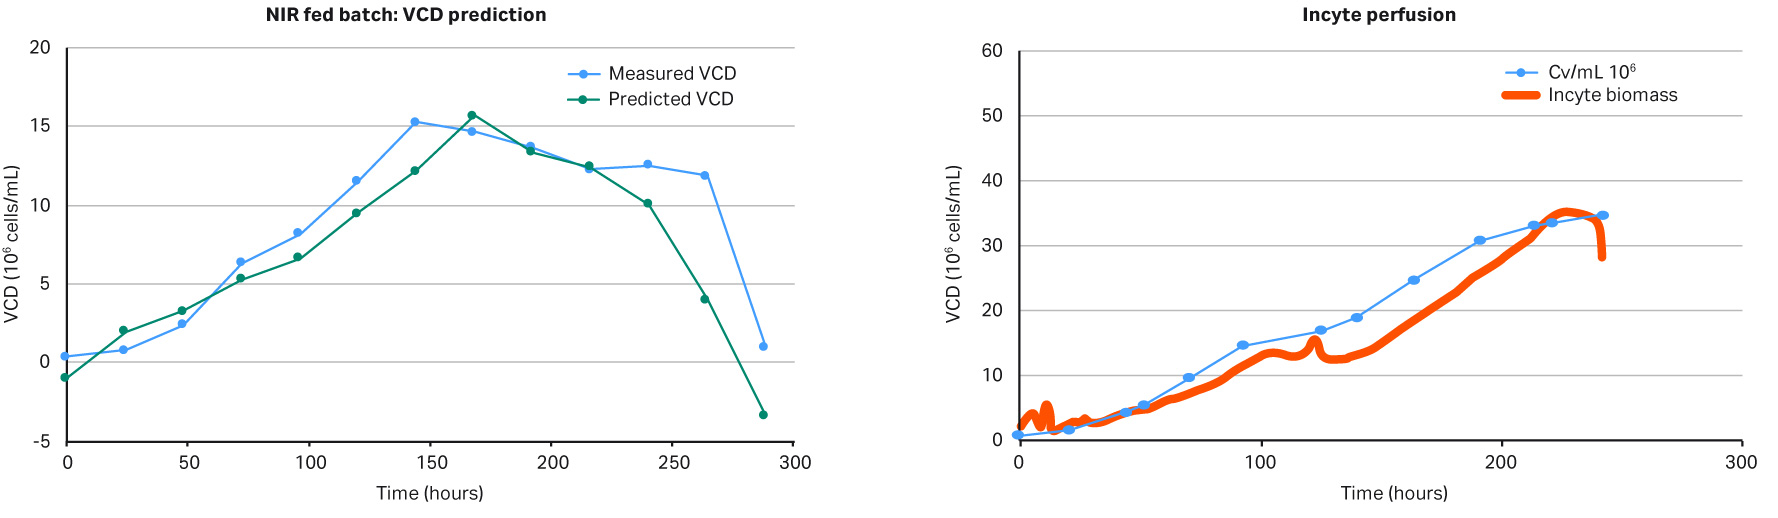
Fig 6.VCD model versus off-line measurements.
Using in-line UV to automate a column switch
Using three-column periodic counter current chromatography for a downstream capture step offers several advantages, including the ability to optimize of resin capacity utilization, dynamic loading based on delta UV using predetermined levels, and the ability to adapt to changes in feed or column performance.
The Delta UV feature on ÄKTA™ pcc system allows column loading to be controlled dynamically using the predicted breakthrough level as a set-point. This means that the system can dynamically adapt to any changes in the feed or column performance. Figure 7 shows how the dynamic control can be used to adjust for changes, even though the column performance is varying during the run. This experiment shows how to optimize the capture step when column capacity varies.
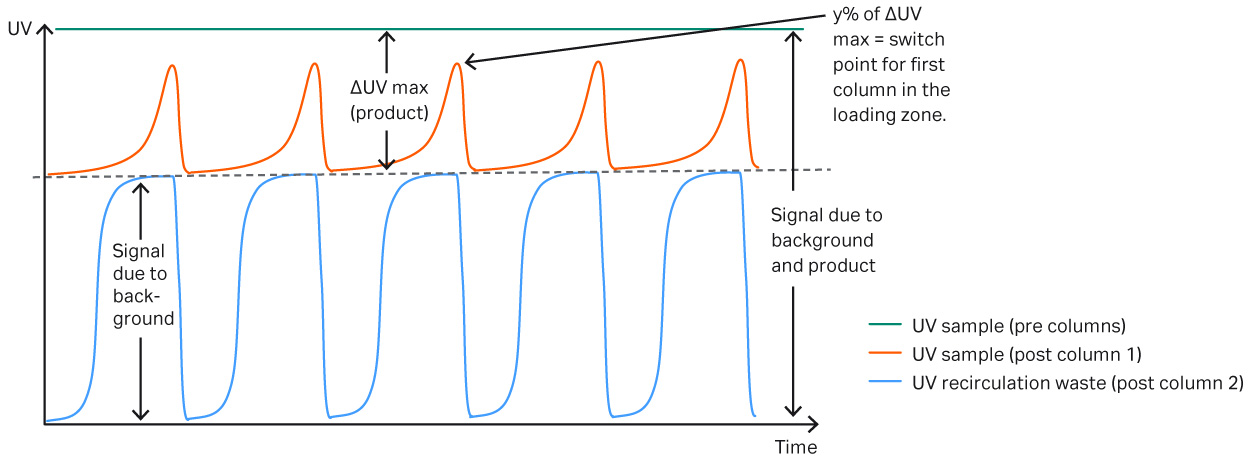
Fig 7.Schematic view of UV curves during loading. The green curve shows the absolute maximum UV value from both the background and product. The red curve is the post column UV signal coming out of the first column in the loading zone, when all mAb applied binds to the resin the UV signal will be equivalent to the absorbance level of the background. Eventually product starts to break through and until it reaches a predefined absorbance level and the primary column in the loading zone is replaced. The blue UV curve displays the absorbance after the second column in the loading zone. This UV curve represents the background in the sample.
In this experiment, the same fed-batch materials were used so that there was no variation in the concentration of the feed. Three different protein A resins with different capacities were used. Column 1 was a MabSelect SuRe™ resin, and columns 2 and 3 were higher capacity MabSelect SuRe LX resins. Due to the lower binding capacity of column 1, break through occurs earlier. The system would put the load on hold until a new column is in place and ready for loading. During the hold there was no change in UV, and the UV peaks “flatten out” (Figure 8). Figure 9 shows that the amount of mAbs is lower in the elution pool for column 1. Demonstrated here, an automated column switch enables a user to get the most out of their column setup.
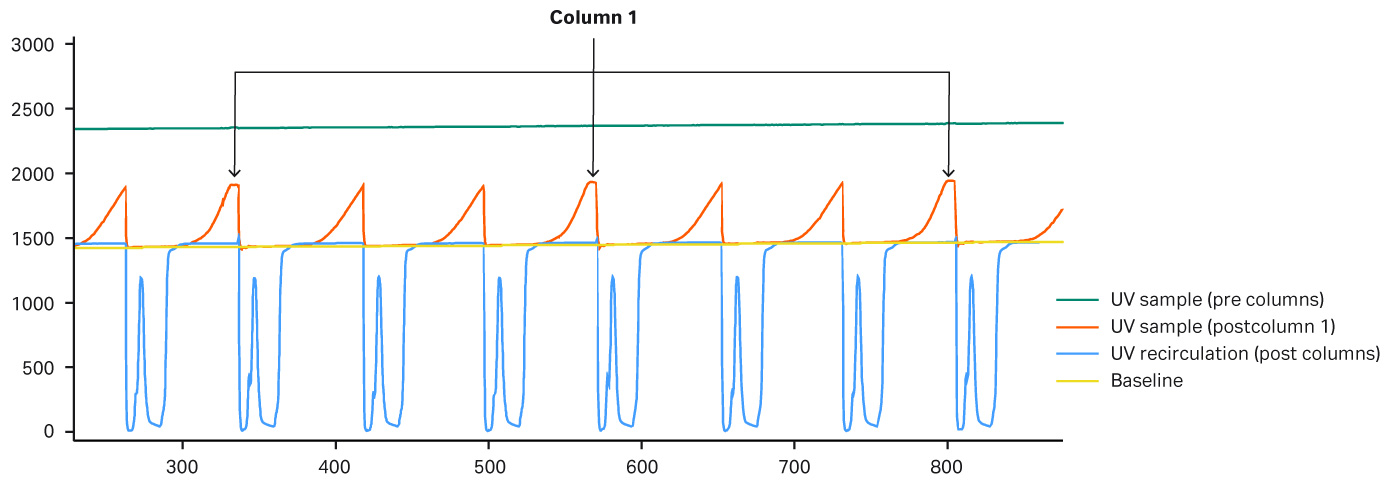
Fig 8.UV curves for column 1 Due to lower binding capacity of column 1 break through occurs earlier causing the peak shape to flatten out in the chromatogram because the system puts the load on hold until a new column is ready to be put in the loading zone. During the hold phase there is no change in UV and the UV peaks therefore “flattens out.” These peaks are marked by arrows in the chromatogram.
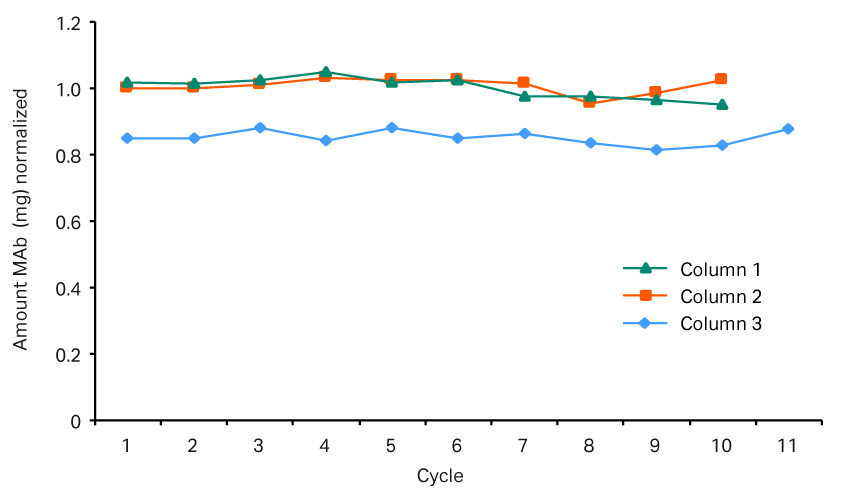
Fig 9.Elution pools for the three columns. Column 1 used a MabSelect SuRe™ resin, and columns 2 and 3 used MabSelect SuRe LX resins. This graph shows that the amount of mAb is lower in column 1 in comparison to columns 2 and 3.
Conclusions
Automation is essential for future continuous bioprocessing, and in order to build reliable and robust predictive models, smart in-line sensors are needed. Automated systems reduce manual sampling and enable in-process control, ensuring greater product quality while decreasing cost. We would like to decrease variability, increase robustness, reduce sampling giving increased yield so that one day CQA can be controlled and predicted. However, before implementing an automation solution, it is important to identify possible value creating steps in your process streams, e.g., flow controllers, pressure sensors, alarm functions, etc. This white paper presented three different experiments of in-line sensors being used to develop basic automated feedback loops for common upstream and downstream bioprocesses. These experiments support further investigation into this field.