In the development of antibody purification protocols, you need to know your Ab molecule and its possible affinity binding sites for the chromatography resins. In this study, we have looked at how different antibody binding sites of a protein A ligand are affected by cleaning in place (CIP). We evaluated NaOH incubation and the effect of performed CIP cycles for two established protein A resins on the market — MabSelect PrismA™ from Cytiva and Amsphere™ A3 from JSR Life Sciences.
Here, we have evaluated the alkaline stability of the resins by analyzing the binding capacity for different Ab domain interactions. In a previous lifetime study with these resins, we analyzed the dynamic binding capacity (DBC) using polyclonal human IgG (pIgG) and a mAb. We observed a discrepancy in the DBC between the pIgG and mAb, which suggests that the domain interactions for protein A are not equally alkaline stable. We therefore analyzed binding capacity, before and after NaOH treatment, using: 1) mAb; 2) fragment antigen-binding (Fab) with and without the presence of VH3 interactions; and 3) fragment crystallizable (Fc) fragments. Amsphere™ A3 resin was shown to have weaker alkaline stability for Fc interaction compared to the VH3 interaction. MabSelect PrismA™ resin showed alkaline stability as the affinity for both the VH3 and the Fc region were maintained after extensive cleaning in place (CIP) cycles. Based on our findings, we conclude that MabSelect PrismA™ is an excellent choice as a platform resin for the capture of antibodies through either VH3 or Fc binding sites.
Introduction
Optimizing yield and productivity are important when setting up efficient antibody capture steps. It is essential to know your Ab molecule types and possible binding sites of the ligand when selecting capture chromatography resins. Over time, the binding capacity is influenced by the cleaning regime and the different antibody binding mechanisms can be affected to a varying degree. This is key knowledge to gain when evaluating resins.
Antibody structure
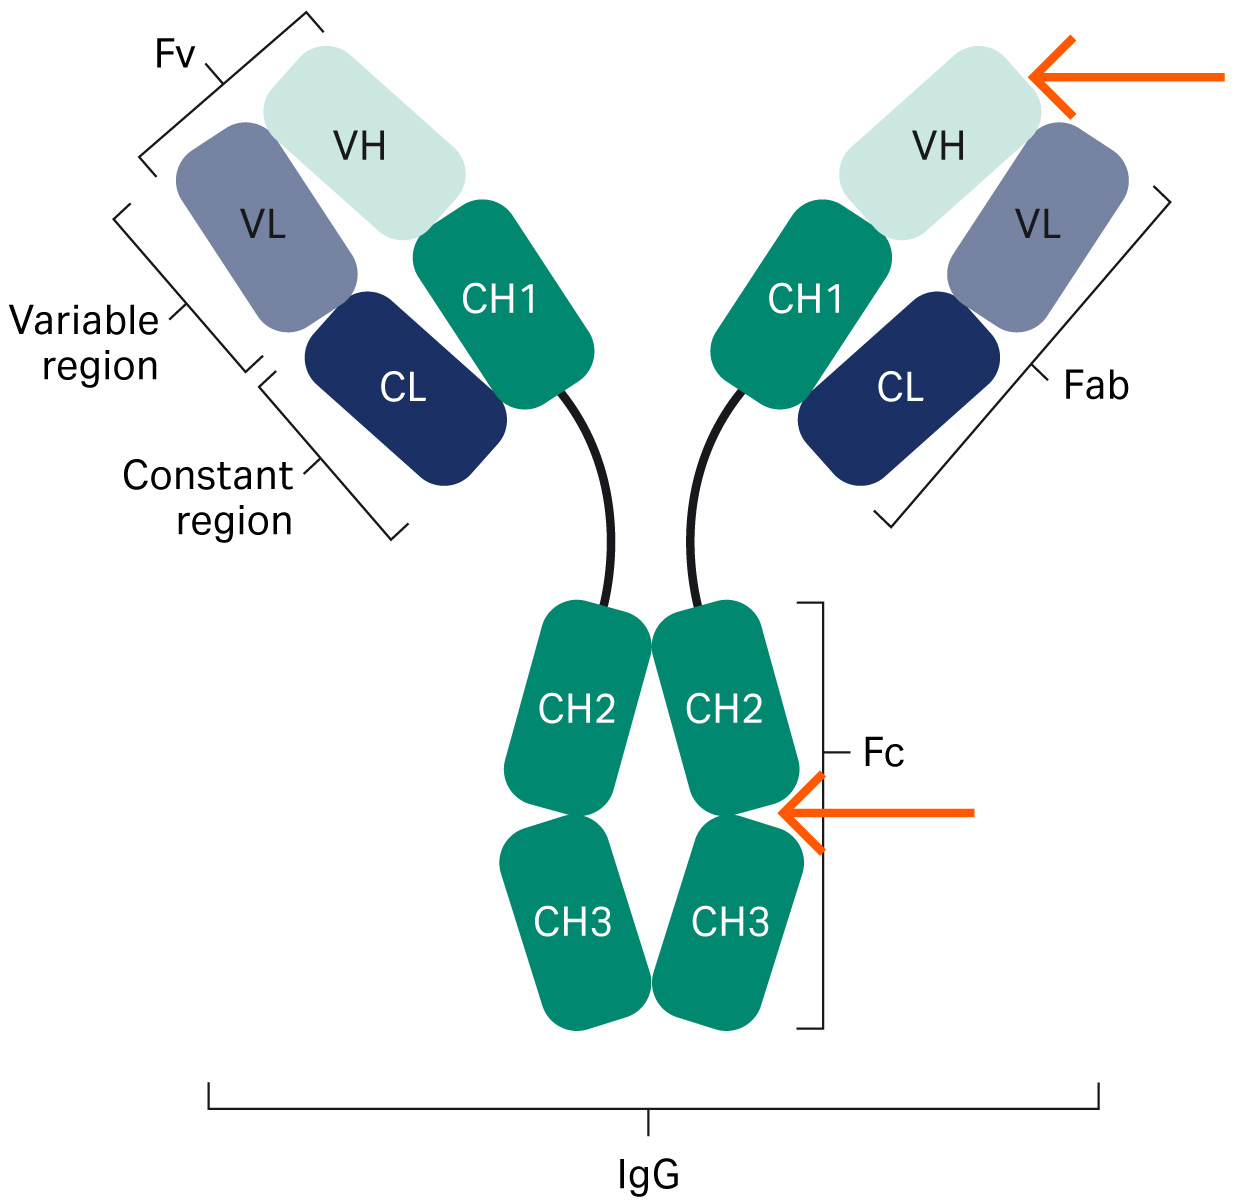
Fig 1. The structure of an antibody. The red arrows indicate where protein A interacts with the antibody.
Figure 1 is an overview structure of an antibody. Protein A resins are used for purifying mAbs by interaction with the Fc region. Today, engineered forms of antibodies exist such as bispecific antibodies and antibody fragments (Fabs, domain antibodies [dAb], single-chain variable fragment [scFv], mini bodies, diabodies, etc.) (1), which may or may not contain an Fc region (Fig 2). When molecules lack the Fc region, interactions with other parts of the antibody need to be identified, such as in the VH3 Fab region.
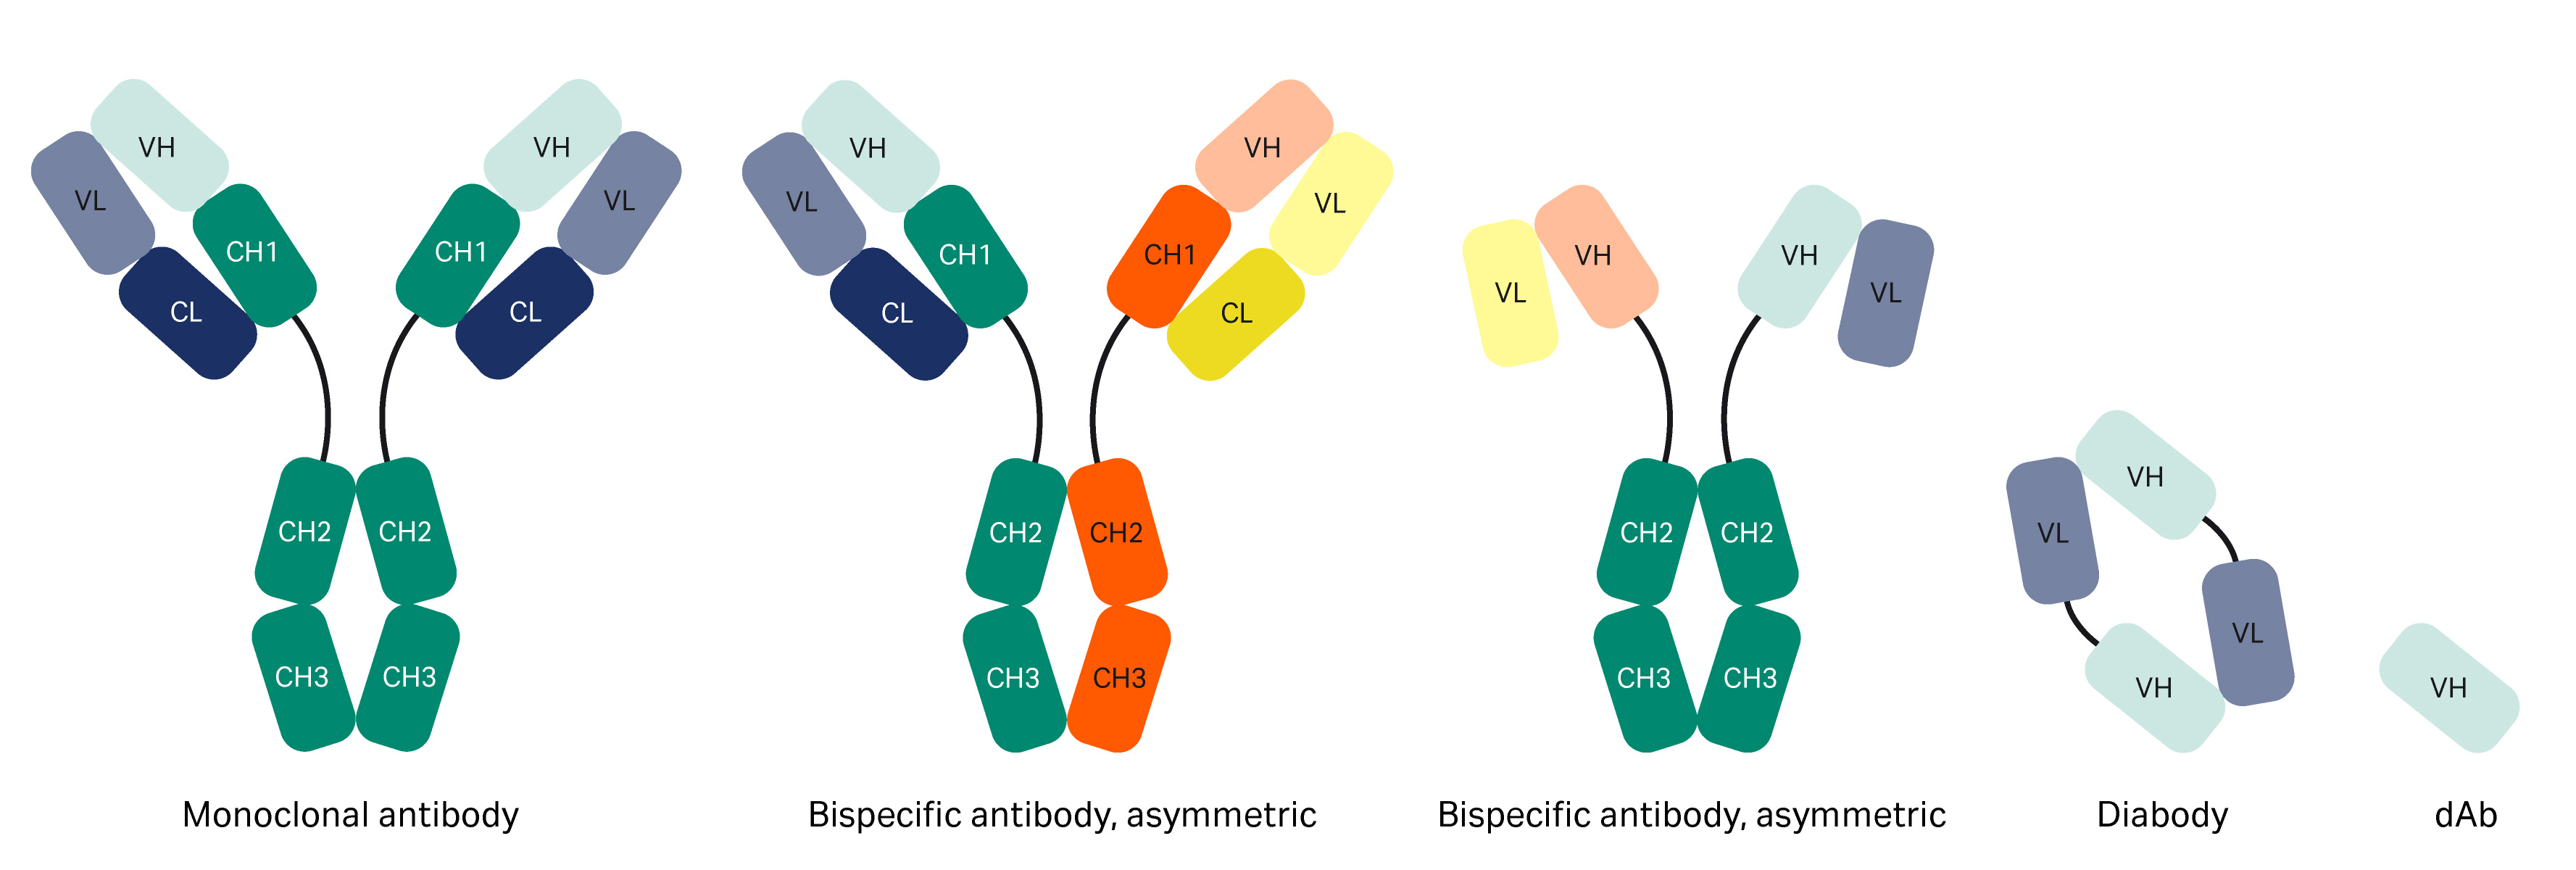
Fig 2. Different forms of antibodies.
Protein A binding interactions
Protein A affinity chromatography is the major purification technique for the capture of antibodies and enables a platform approach to downstream processing. Protein A resins vary in their properties, including material of base matrix, type of protein A ligand, particle size, and pore size. The protein A ligand interacts with the Fc region of most immunoglobulin G (IgG) except IgG3 between the CH2 and CH3 regions and sometimes at the Fab region if it has the right sequence in the VH domain. The amino acid sequence in the VH region varies between various mAbs and some sequences in the VH3 gene family can interact with protein A. For polyclonal antibodies, the distribution between antibodies with and without VH3 interaction can vary, and that in turn affects the binding to the resin. The average content of IgG that belongs to the VH3 gene family is about 50% in serum, which is the source of polyclonal antibodies (pIgG) (2,3).
Lifetime study of MabSelect PrismA™ and Amsphere™ A3 protein A resins
Previously, we investigated the lifetime for MabSelect PrismA™ and Amsphere™ A3 (JSR Life Sciences) resins over several mAb purification cycles that included CIP with 0.5 M NaOH. In the study, mAb1 was purified from a cell culture harvest (CCH) and the DBC at 10% breakthrough (QB10) was analyzed every 10 cycles with pIgG (Fig 3).
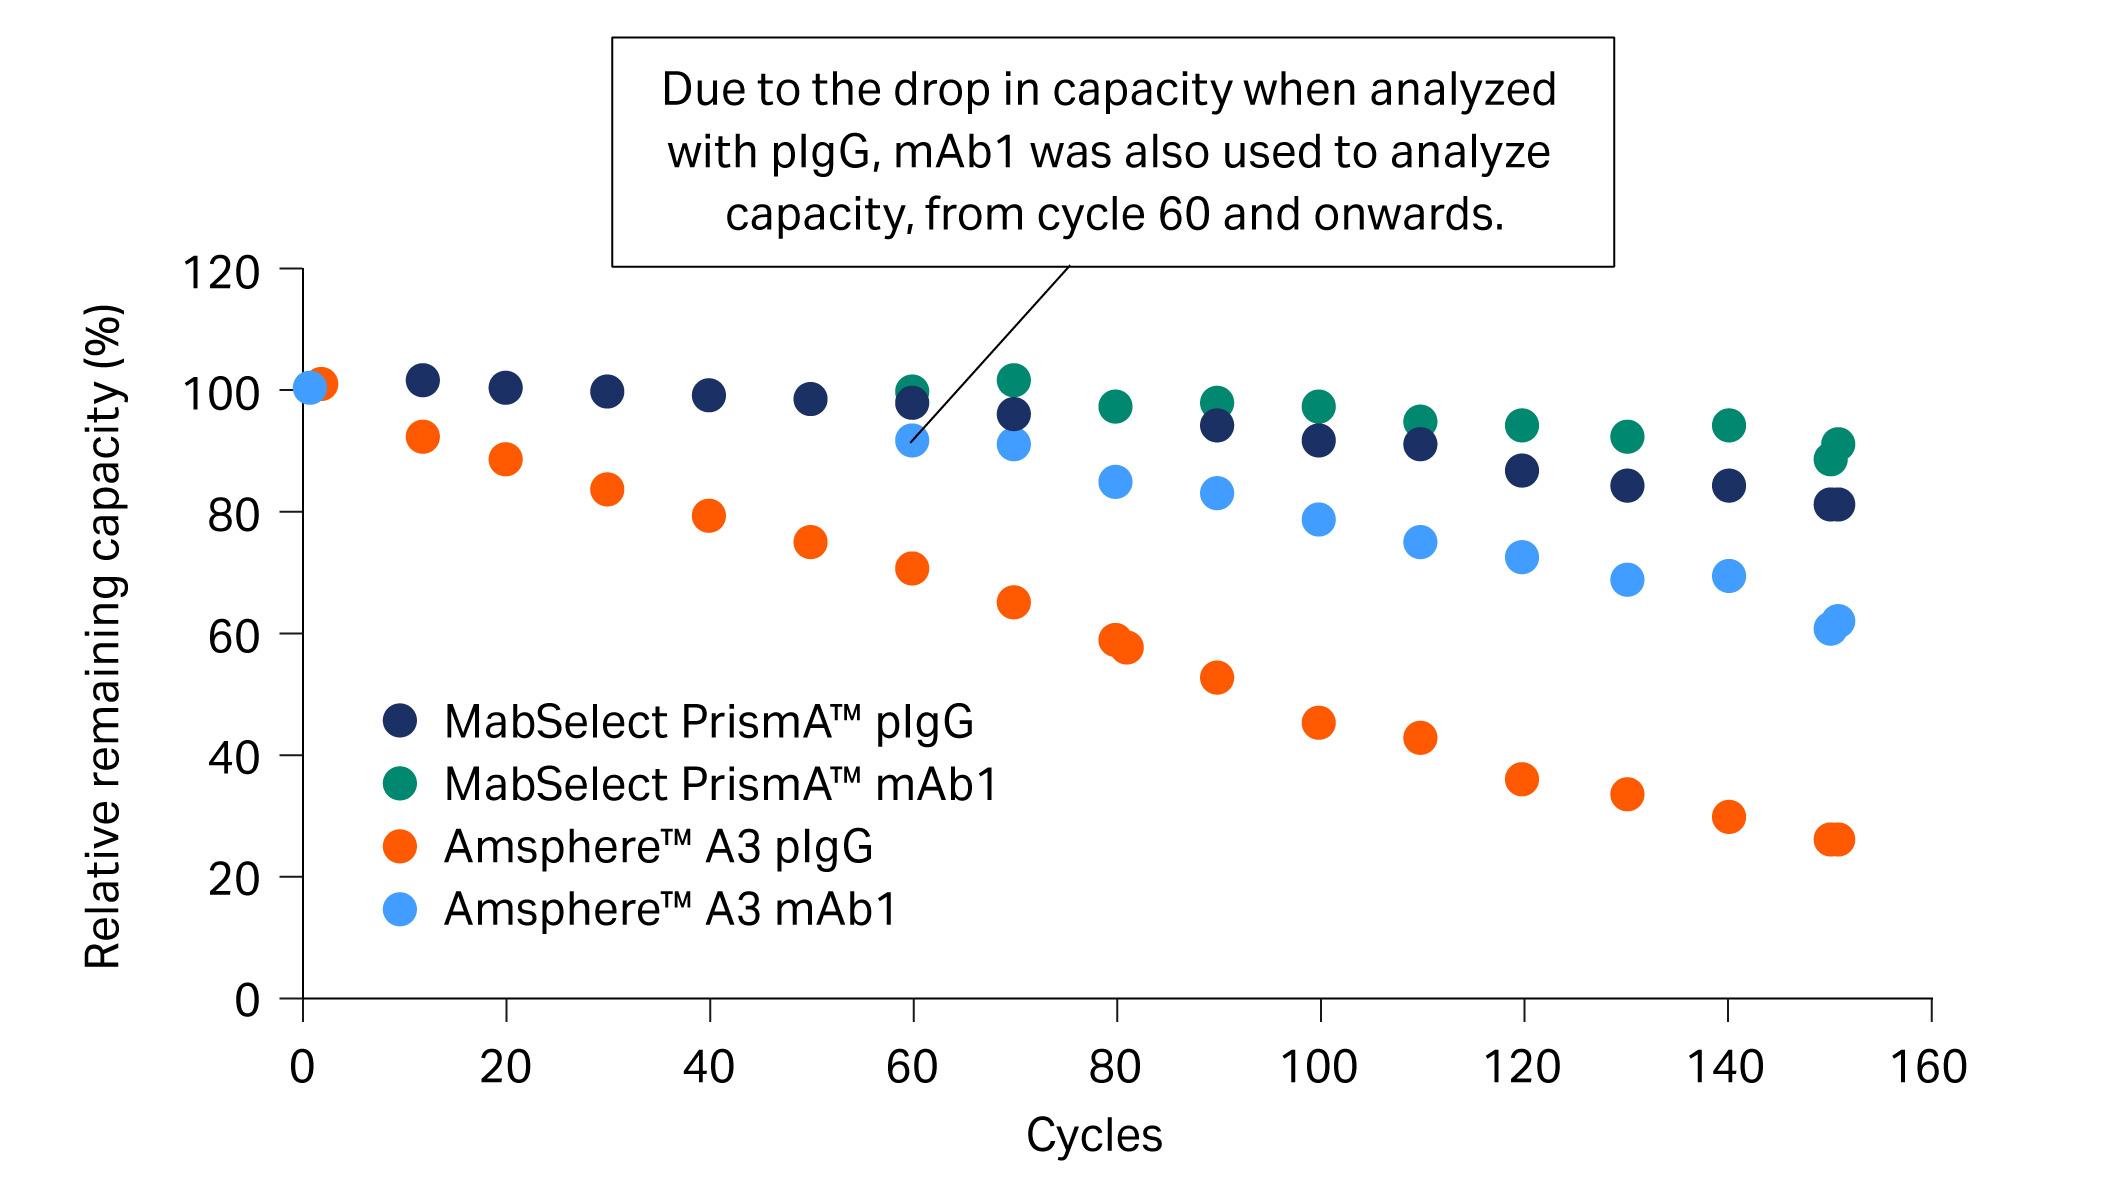
Fig 3. Relative remaining capacity (%) of Amsphere™ A3 compared with MabSelect PrismA™ using both mAb1 and pIgG samples.
Due to the drop in capacity of, in particular, Amsphere™ A3 resin for pIgG at 60 cycles, we decided to also analyze QB10 with mAb1 from cycle 60 and onwards. QB10 analyzed with mAb1 showed high remaining capacity and explained the good yield of approximately 90% observed in the eluate (Fig 4). Our hypothesis for the discrepancy in QB10 analyzed with pIgG and mAb1 is that the NaOH cleaning regime has a different effect on the VH3 and Fc interactions of the protein A resin.
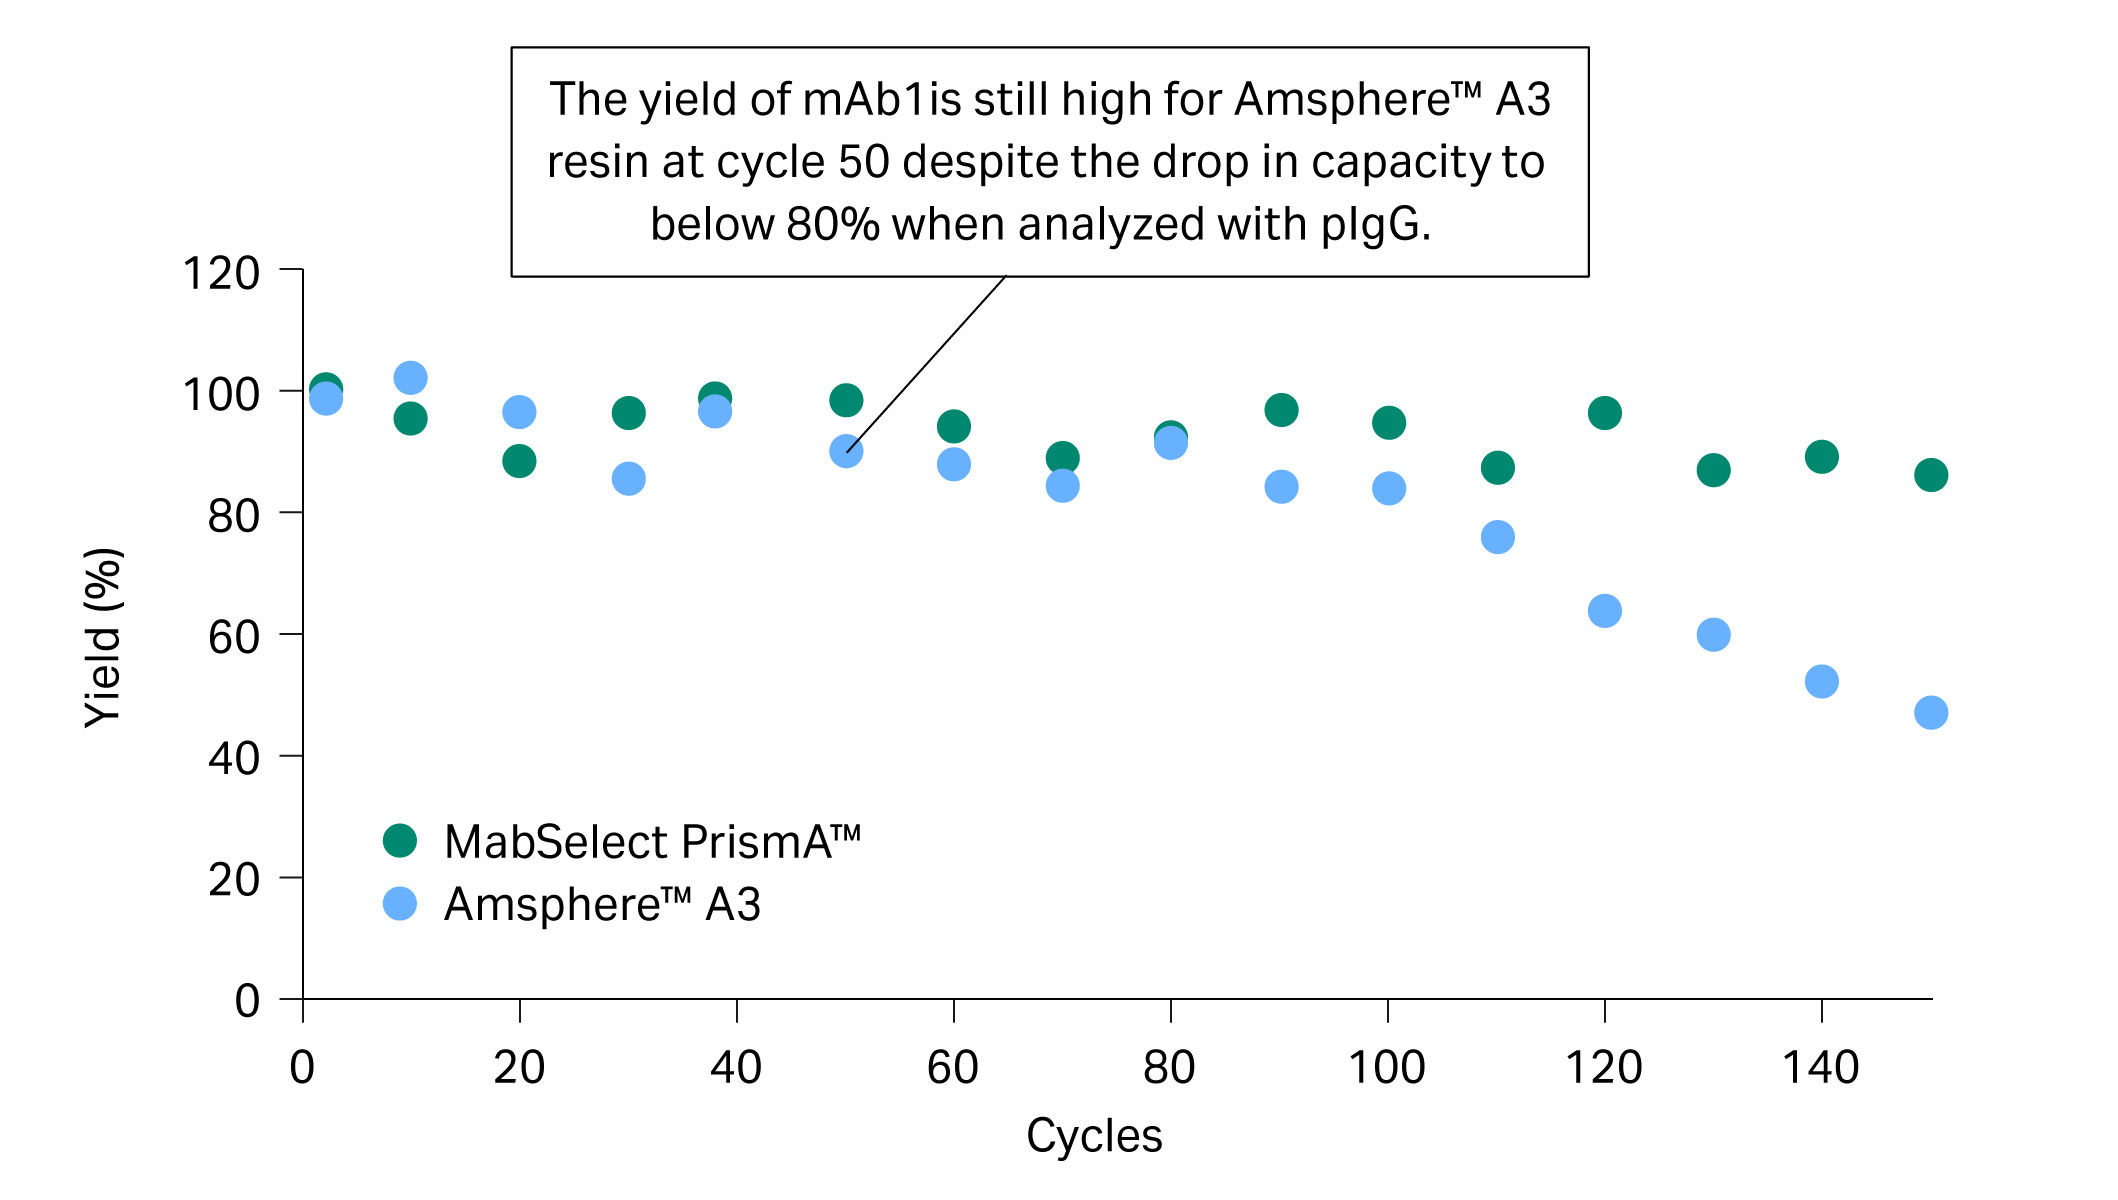
Fig 4. The yield of mAb1 eluate in the lifetime study.
The results from the lifetime study are summarized below:
- At cycle 50, relative remaining capacity was below 80% for pIgG (Fig 3) while yield was still approximately 90% for mAb1 in the elution pool with Amsphere™ A3 resin (Fig 4).
- At cycle 60, the relative remaining capacity for Amsphere™ A3 resin was around 70% for pIgG and 90% for mAb1. The discrepancy explains the good yield when running the purification cycles with mAb1 containing feed.
- We hypothesized that the VH3 and Fc interactions have different alkaline stability for Amsphere™ A3 resin. mAb1 can interact via both Fc and Fab regions, while only less than 50% of the pIgG can interact via the Fab region. The loss in capacity might be explained by a greater alkaline sensitivity of the Amsphere™ A3 resin for the Fc interaction compared to the VH3 interaction.
- A discrepancy in the capacity was not observed for MabSelect PrismA™ where a similar relative loss in capacity was shown for both pIgG and mAb1.
To investigate the alkaline stability of the interactions, we produced Fab and Fc fragments from two mAbs, with and without VH3 interaction, using papain digestion. We incubated fragments, mAb, and pIgG in 96-well filter plates to investigate static binding capacity (SBC) for Amsphere™ A3 and MabSelect PrismA™ resins before and after NaOH treatment.
SBC of MabSelect PrismA™ and Amsphere™ A3 protein A resins
To further identify the specific protein A antibody binding interactions, we separated mAb into Fab and Fc fragments using papain enzyme cleavage followed by purification (see Materials and Methods). The SBC study was conducted using a 96-well filter-plate study. The untreated resin plate was incubated in PBS while another plate was incubated for 24 h with 0.5 M NaOH, which corresponds to 96 CIP cycles of 15 min duration.
A summary of the Fc and VH3 interactions for the antibodies and fragments in the SBC study is found in Table 1.
Table 1. The antibody interactions with protein A of all studied fragments
| pIgG | mAb1 | mAb2 | Fab1 | Fc1 | Fab2 | Fc2 | |
| Interaction with protein A | + | + | + | + | + | - | + |
| Fab interaction (VH3) | +/-* | + | - | + | - | - | - |
| Fc interaction | + | + | + | - | + | - | + |
* Around 50% VH3 interaction, (2,3)
+ = interaction; - = no interaction
* pIgG = mix of antibodies with and without VH3 interaction
† Fc1 and Fab1 were isolated from mAb1 containing the VH3 domain.
‡ Fc2 and Fab2 were isolated from mAb2, which lacks the VH3 domain. Note that Fab2 is not shown as it does not bind to protein A.
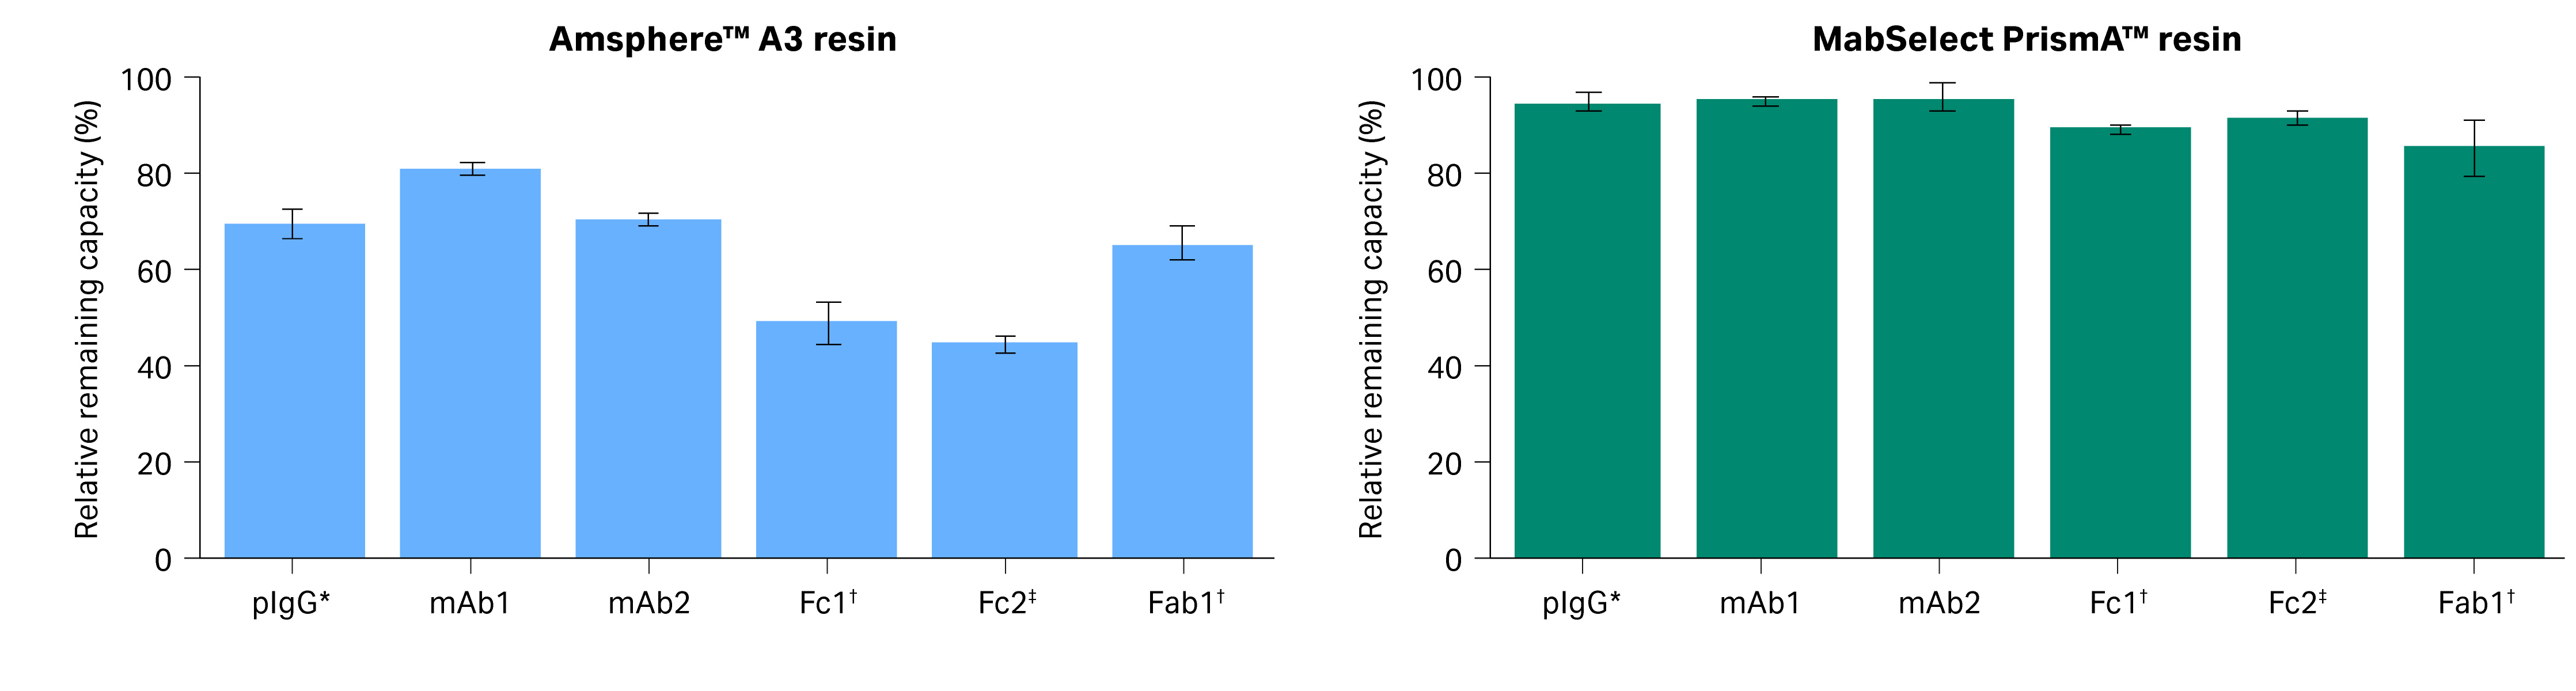
Fig 5. The relative remaining capacity (SBC) for untreated sample vs sample post-treated with 0.5 M NaOH for antibodies and fragments purified using Amsphere™ A3 and MabSelect PrismA™ resins.
- MabSelect PrismA™ or Amsphere™A3 resins do not interact with the Fab2 fragment as it lacks the VH3 domain (Table 2).
- Amsphere™ A3 resin after NaOH treatment showed a 35% loss in binding capacity for Fab1.
- In Fc2 region interactions, only a minor drop in SBC was observed for MabSelect PrismA™ resin after the NaOH treatment. However, for Amsphere™ A3 resin, the SBC decreased to 50%.
The result in Figure 5 supports the hypothesis that Amsphere™ A3 resin is more sensitive to NaOH with respect to Fc interactions compared to the VH3 interactions. This explains why the relative remaining capacity of Amsphere™ A3 is lower when analyzed with pIgG during the lifetime study than with mAb1, which has both Fc and VH3 interactions.
Conclusion
- Static binding capacity (SBC) for Amsphere™ A3 resin with Fc fragment showed a 50% loss in capacity after NaOH treatment. The VH3 interaction was more stable with only a 35% loss in SBC for Fab1 for the Amsphere™ A3 resin. This supports our hypothesis that the Fc interactions are more sensitive to NaOH than VH3 interactions for the Amsphere™ A3 resin.
- MabSelect PrismA™ resin has good alkaline stability for both Fc and VH3 interactions, withstands several CIP cycles, and is therefore a suitable platform resin.
Resin lifetime study
We benchmarked MabSelect PrismA™ resin against Amsphere™ A3 resin in a lifetime study. The columns were cycled with a clarified CCH containing mAb1 with a titer of 2 g/L and the load was set to 80% of QB10 at the start of the cycling. The relative remaining capacity was analyzed every 10 cycles. The columns were cleaned with 0.5 M NaOH with 15 min contact time in every cycle. We analyzed the breakthrough capacity for the two resins using pIgG every 10 cycles. We also analyzed using purified mAb1 from cycle 60 onwards.
SBC study
Two mAbs (mAb1 and mAb2) and one pIgG (Gammanorm™) were investigated in this study, where mAb1 has a known VH3 interaction and mAb2 lacks VH3 interactions.
We performed the study in two steps: 1. The mAbs were cleaved to Fab and Fc fragments and purified. Then all the entities were exchanged into the same buffer and diluted or concentrated to the same concentration of around 3.6 g/L. 2. Then the SBC was measured before and after NaOH treatment for all entities in a plate study.
Cleavage of mAb samples
mAb1 and mAb2 were cleaved with papain enzyme into one Fc and two Fab fragments using a standard protocol.
Purification of Fab and Fc
To obtain a pure test material without mis-cleavage products, we used two different affinity steps to purify Fc and Fab fragments. Capto™ L resin was used to bind the Fab region from mAb1 having kappa 1 class. For mAb2, we used KappaSelect, which is an affinity resin designed for the purification of human Fab (kappa) fragments. We used KappaSelect as mAb2 did not bind to Capto™ L, which is probably due to the kappa 2 class of this mAb.
MabSelect SuRe™ resin was used for the Fc binding since it has a low affinity for the VH3 in the Fab region. In the first column, both flowthrough (FT) and the eluate were collected separately for further purification on an orthogonal resin. The FT from the first column was collected as eluate in the second column. The pool eluate from the first column was collected as FT in the second column (Fig 6).
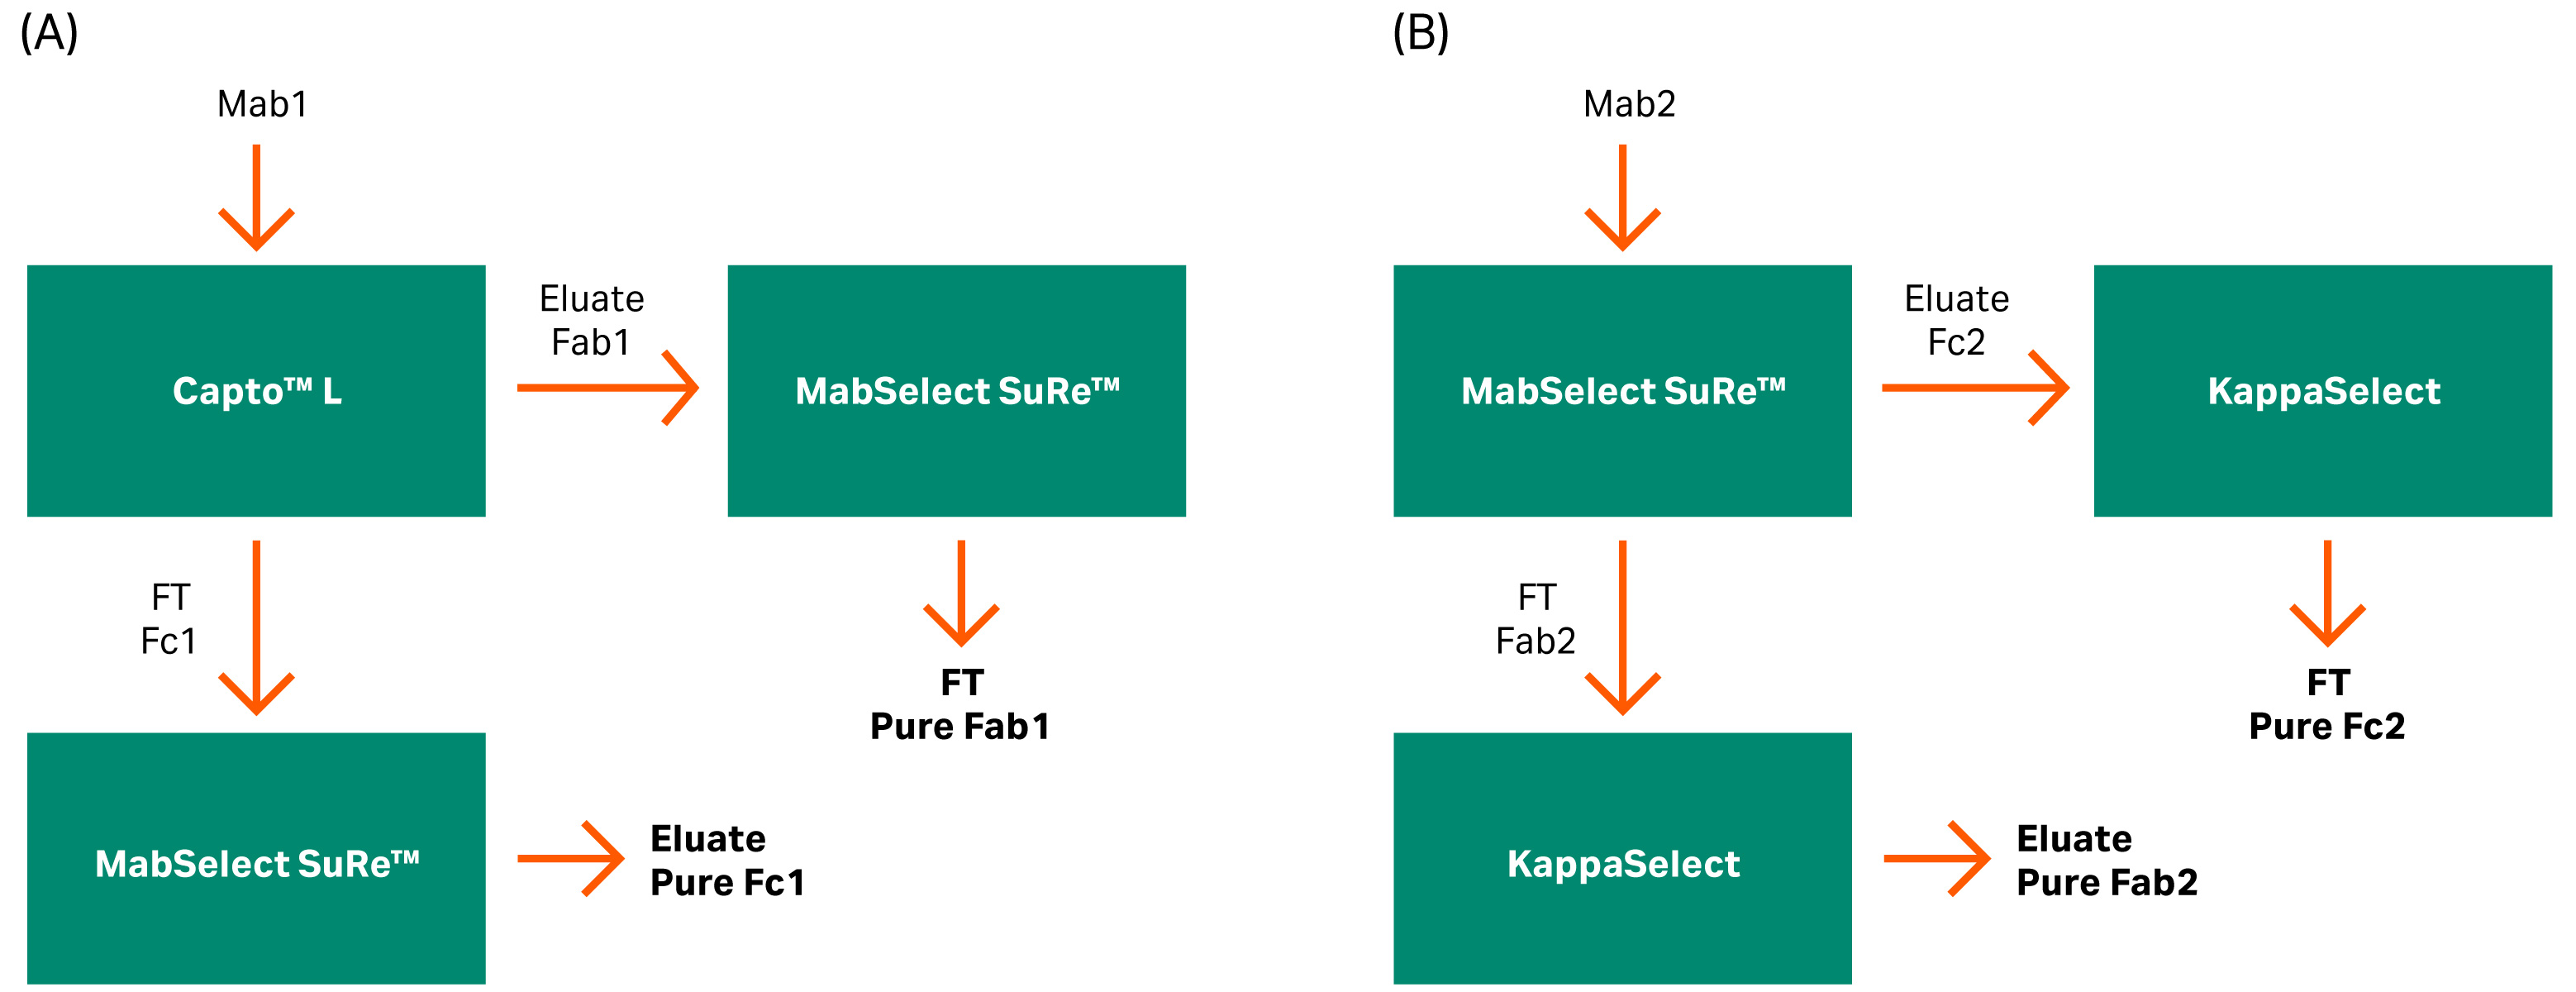
Fig 6. Flow charts for the purification of the mAb fragments into Fab and Fc fragments using different columns based on mAb binding affinity. (A) Capto™ L and MabSelect SuRe™ resins and (B) MabSelect SuRe™ and KappaSelect resins.
Concentration was then determined in a UV microplate at 280 nm in triplicates. The fragments were then analyzed with size exclusion chromatography (SEC) and mass spectroscopy (MS). Both analyses indicated that the fractions are pure (data not shown).
Preparing samples for SBC
Before the plate study, the buffer of all antibodies and antibody fragments was diluted in PBS (phosphate buffer saline).
Outline of SBC filter plates (96-well) study
Below, we briefly describe how the filter plate study was set up. In the plate study, two 96-well filter plates were filled with 6 µL/well of the two resins — MabSelect PrismA™ and Amsphere™ A3.
- We ran two studies in parallel: one plate incubated with 0.5 M NaOH and another with PBS for 24 h without shaking.
- After completed incubation, we ran both plates in parallel. After washing the plates, the wells were incubated with 200 µL of 3.6 g/L Fab1, Fab2, Fc1, Fc2, mAb1, mAb2, and pIgG in PBS, three wells for each molecule and resin (Fig 7). The plates were then put on an orbital shaker for 60 min at 1100 rpm at ambient temperature.
- The supernatant (non-bound) was collected by centrifugation and followed by three washes with PBS and centrifugation in between.
- Finally, we eluted the plates three times to collect all the protein bound to the resins. Centrifugation was used to collect the eluate.
- The amount eluted was determined by reading absorbance at 280 nm or 300 nm.
- To calculate the relative SBC, we determined the ratio between the amount in the eluate from the control plate and the NaOH-treated plate.
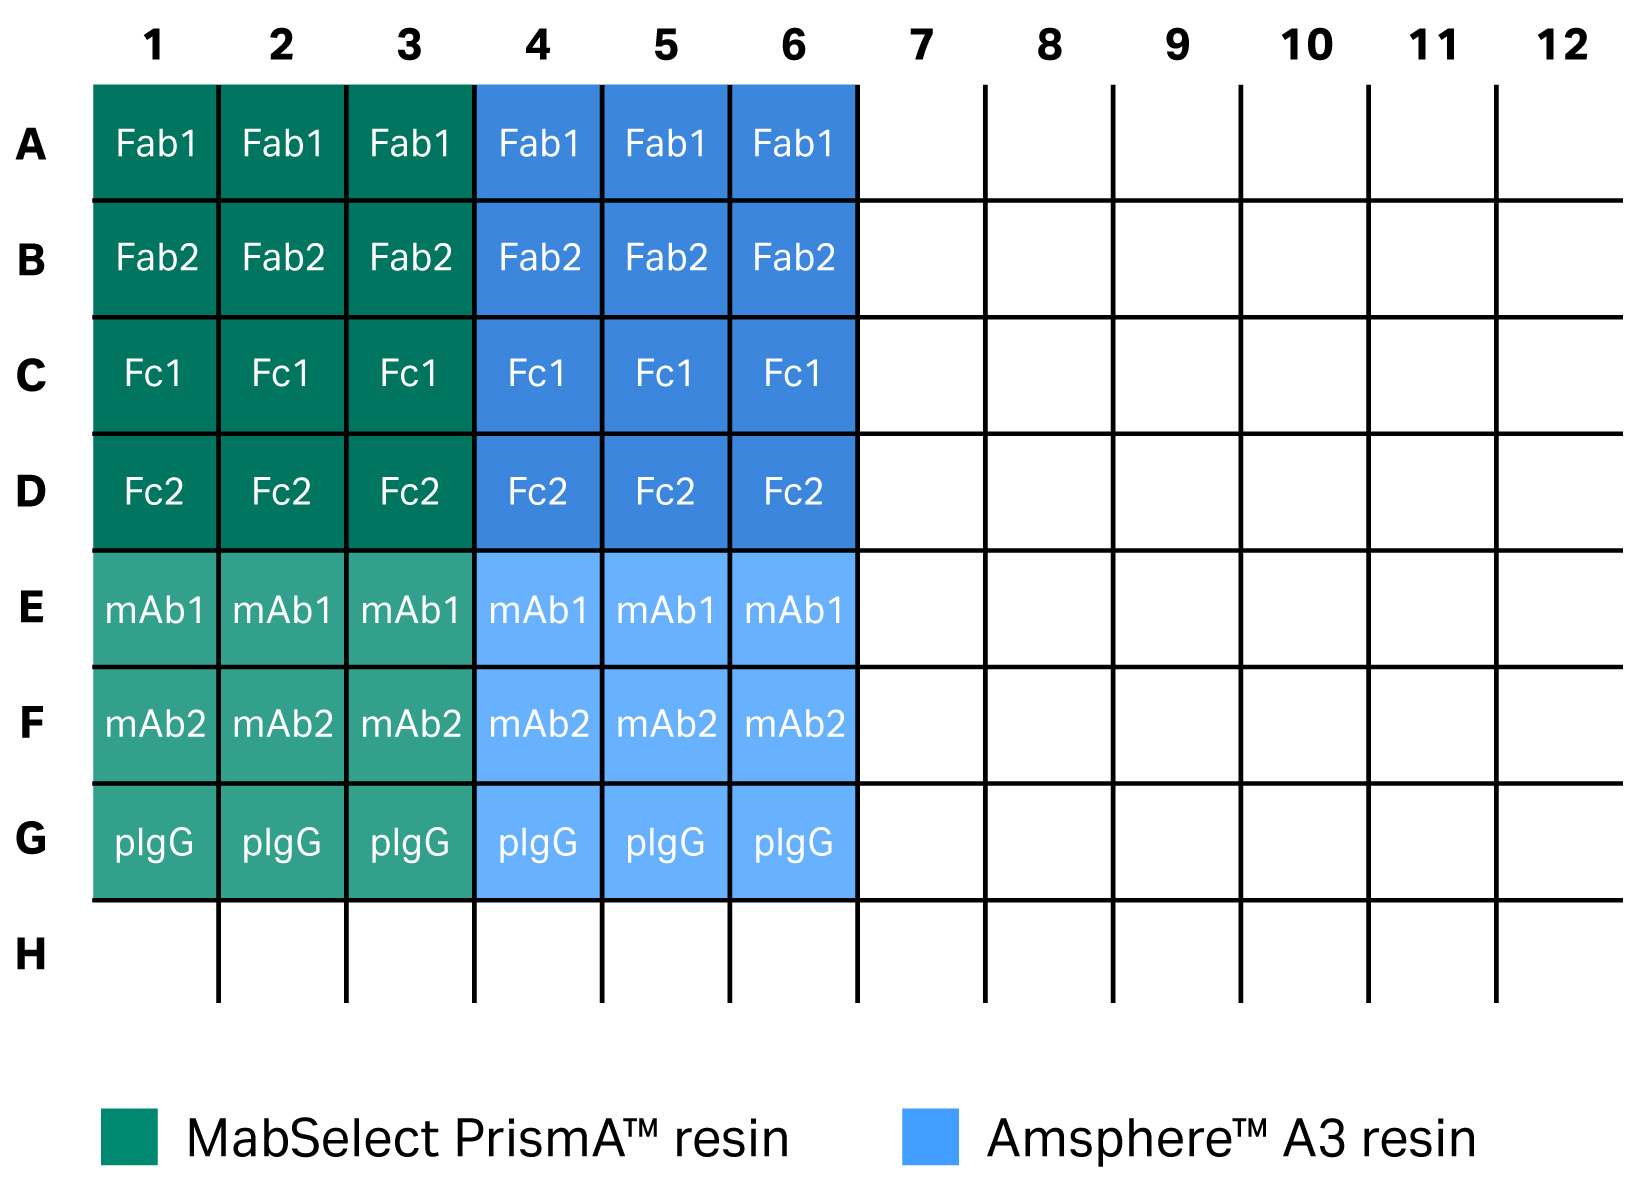
Fig 7. Plate study experimental layout. The same set up was used for incubation for 24 h in PBS and incubation for 24 h in 0.5 M NaOH.
References
- Gihoon Y, Won J, Lee, Y et al. Bispecific antibodies: A smart arsenal for cancer immunotherapies, Vaccines 2021;9(7):724.
- Schroeder H.W, Hillson J.L, Perlmutter R.M, Structure and evolution of mammalian VH families, Int. Immunol. 1990; vol (2): 41-50.
- Walter M.A., Cox D.W., Analysis of genetic variation reveals human immunoglobulin VH-region gene organization, Am. J. Hum. Genet. 1988; vol (42): 446-451.
CY26083-27May22-AN
TR137908