The need for higher throughput and more efficient process development
Biomanufacturing is trending towards higher numbers of monoclonal antibody (mAb) projects and smaller batch sizes, with production of most mAbs below 100 kg/yr (1). These trends are fueling demands to screen more clones faster and improve the efficiency of process development (PD). Current approaches to purify mAbs for high-throughput screening of lead candidates and optimization of process conditions often uses resin-based columns and liquid handling robots. This setup requires a large footprint and capital-intensive equipment. Fiber-based chromatography (Fibro) has an open pore structure where mass transfer is governed by convective flow rather than diffusional flow as for resin-based chromatography (2). The Fibro technology with immobilized protein A ligand allows high mAb binding capacities at very short residence times, which results in cycle times of minutes instead of the hours needed for resin-based chromatography. The rapid cycling using Fibro PrismA units offers new opportunities in high-throughput purification for screening of lead candidates and process conditions.
This study evaluated performance of Fibro units coupled with alkali-stable protein A ligand, HiTrap Fibro PrismA, in automated one- and two-step purification on an ÄKTA pure chromatography system with attached autosampler. Performance was compared with that of a HiTrap MabSelect PrismA column. For the two-step protocol, eluate from the capture step was automatically loaded onto two 5 mL HiTrap Desalting columns connected in series to obtain buffer exchange for subsequent analytic characterization, as illustrated in Figure 1. Recovery and total purification time were evaluated, as were critical product quality attributes (PQAs) including charge variants, aggregate and fragment content, peptide mapping, and N-glycosylation analysis. Peptide mapping and N-glycosylation analysis were performed using MAM-MS. Total run time was substantially lower for the HiTrap Fibro PrismA unit, while recovery and evaluated PQAs were comparable across both technologies.

Fig 1. Schematic illustration of the automated one-step and two-step mAb purification.
See detailed materials and methods.
Results
Purification time and carryover
An ÄKTA pure system was connected to a Teledyne™ autosampler and set up to purify 10 mAb samples from days 3–12 of fed-batch culture. The one-step capture purification on a 0.4 mL HiTrap Fibro PrismA unit and a 1 mL HiTrap MabSelect PrismA column was compared. With the HiTrap Fibro PrismA unit the time per sample was reduced from 54 minutes to 10 minutes, including ~ 5 minutes to clean the column or unit and prepare the autosampler between samples. In total a 5-fold reduction in cycle time with Fibro was achieved for the one-step protocol. See chromatograms in Figure 2.

Fig 2. Affinity purification of mAb using HiTrap Fibro PrismA (blue curve) and HiTrap MabSelect PrismA (orange curve).
An automated two-step tandem purification of mAb feed samples was set up with the captured peak from the HiTrap Fibro PrismA unit directly transferred to 2 × 5 mL HiTrap Desalting columns containing Sephadex G-25 resin. High recovery between the capture and the buffer exchange steps was obtained, and cycle time was reduced almost 4-fold compared with HiTrap MabSelect PrismA (Table 1).
Table 1. Recovery and run time of two-step tandem purification for one mAb sample
| Purification format | Recovery – UV measuring elution area of affinity step (mL × mAU) | Recovery – UV measuring elution area of desalting step (mL × mAU) | Total run time, including CIP and cleaning of autosampler lines (min) |
| HiTrap MabSelect PrismA column, 1 mL | 1036 | 1027 | 84 |
| HiTrap Fibro PrismA unit, 0.4 mL | 1175 | 1109 | 22 |
CIP = cleaning in place.
To check for carryover between runs of different samples, an SDS-PAGE analysis was performed on blank runs after the protein A step. Figure 3 shows SDS-PAGE analysis of mAb samples (lanes 1–7) and blank runs (lanes 8 and 9). No protein bands were visible in lanes 8 and 9, indicating lack of carryover from the protein A step.

Fig 3. SDS-PAGE analysis after protein A step. Blank runs are samples 8 and 9.
Sample
- mAb feed sampled 8 d before harvest, purified using HiTrap Fibro PrismA unit
- mAb feed sampled 8 d before harvest, purified using HiTrap MabSelect PrismA
- harvest purified using HiTrap Fibro PrismA unit
- harvest purified using HiTrap MabSelect PrismA
- harvest purified using HiTrap Fibro PrismA unit with desalting
- harvest purified using HiTrap MabSelect PrismA with desalting
- harvest purified using HiTrap MabSelect PrismA with desalting (duplicates of lane 6)
- blank run on HiTrap Fibro PrismA unit
- blank run on HiTrap MabSelect PrismA
Charge variants profile
Figure 4 presents the relative distribution of mAb charge variants over the cell culture process using either HiTrap Fibro PrismA or HiTrap MabSelect PrismA for capture. There are no major differences in the distribution of charge variants between the Fibro unit and column.


Fig 4. Charge variants over the fed-batch culture process for a mAb after capture with a HiTrap Fibro PrismA unit or a HiTrap MabSelect PrismA column. Cation exchange chromatography (CEX) was used for analysis. (A) Acidic, (B) main peak, and (C) basic charge variants.
Aggregate and fragments profile
Figure 5 provides the relative distribution of mAb monomer, aggregates, and fragments over the cell culture process using either HiTrap Fibro PrismA or HiTrap MabSelect PrismA for capture. As can be seen, there are no appreciable differences in the distribution of these species using either capture method.
Note that the relative abundance of aggregates and fragments did not markedly increase over the culture period, indicating a stable production process.


Fig 5. Abundance of monomer, aggregates, and fragments over the fed-batch culture process for a mAb after capture with a HiTrap Fibro PrismA unit or a HiTrap MabSelect PrismA column. Analysis was conducted using size exclusion chromatography (SEC). (A) Monomer, (B) aggregates, and (C) fragments. MS PrismA is MabSelect PrismA.
Analysis of PQAs using mass spectrometry with multi-attribute monitoring
The classical approach to monitoring PQAs has been to use a different analytical method for each attribute. This is rather time consuming and often requires multiple systems, consumables, and methods to monitor all the key attributes. Recently, mass spectrometry (MS) with multi-attribute monitoring (MAM) has emerged as an alternative to measure multiple attributes in one analysis (3, 4). In addition, this method allows further in-depth analysis on the molecular level and the discovery of new important PQAs. Figure 6 summarizes PQAs that can be monitored using MAM-MS.

Fig 6. Overview of PQAs that can be monitored with MAM-MS and with traditional chromatography methods. Green indicates the method can be used; red indicates that it cannot be used. HILIC is hydrophobic interaction liquid chromatography.
Peptide mapping profile
Figure 7 provides the peptide profiles from the multi-attribute monitoring–mass spectrometry (MAM-MS) analysis following mAb capture with either Fibro PrismA or MabSelect PrismA. The individual and overlaid profiles match, indicating no substantial difference between the two capture methods.

Fig 7. Peptide profiles of cell culture day 8 mAb sample captured with HiTrap Fibro PrismA or HiTrap MabSelect PrismA.
Profile correlation
The 200 most common features in the Figure 7 chromatograms were extracted and correlated in triplicate runs. As seen in Figure 8, the abundance of the features (peptides) is represented by circle size. Complete correlation between the 200 features further indicates no observed or measured difference between mAb captured by the Fibro unit or column.

Fig 8. Correlation plot of the 200 most common peptide features from the chromatograms in Figure 7. Data based on triplicate runs for the Fibro unit and the column.
N-glycosylation comparison
The N-glycosylation profile is a very important PQA for the final product. The dominating N-glycosylation species for IgG1 type mAbs expressed in CHO cells are G0F and G1F as depicted in Figure 9. Thus, the G0F and G1F profiles for the mAb captured by either a Fibro unit or column were compared. Both the G0F and G1F glycosylation profiles are similar after capture using either a Fibro unit or a column. These results confirm that these N-glycan profiles are comparable.


Fig 9. N-glycan profiles of mAb samples over the culture period after capture using either a HiTrap Fibro PrismA unit or a HiTrap MabSelect PrismA column. (A) G0F and (B) G1F glycosylation.
Conclusions
In this study, a HiTrap Fibro PrismA unit was used to automatically purify multiple mAb feed samples on an ÄKTA pure chromatography system with a commercially available autosampler. Cycle times were reduced compared with HiTrap MabSelect PrismA columns, more than 5-fold with a one-step protocol and almost 4-fold with a two-step protocol. Recovery was similar between the Fibro unit and column, with no carryover between capture of different mAb feeds as determined by SDS-PAGE analysis of Cy5 labeled samples. Purity was comparable between the Fibro unit and column, with similar charge variant profiles and relative abundances of monomer, aggregate, and fragment. MAM-MS analysis also provided comparable peptide profiles, profile correlation, and N-glycan pattern for two important N-glycosylations.
Taken together, these results show that substantial time savings can be made using the Fibro unit, with a performance equivalent to a column. Serial setup with an autosampler on an ÄKTA system provides full chromatograms in high-throughput mode, which automates purification of large numbers of samples. This setup, which does not require liquid handling robotics, enables increased throughput of screening mAb clones and can be useful in applications such as upstream process development to optimize culture conditions.
Learn more about Fibro technology for mAb purification.
Acknowledgements
We acknowledge Richard Blankley at Agilent Technologies UK for assistance in creating the LC-MS/MS method and MS quant data evaluation method. We also express our gratitude to Teledyne Technologies Inc for making our work more effective by lending us the ASX-560 autosampler.
References
- Data derived from BDO’s BioProcess Technology Consultants bioTRAK™ database.
- Data file: HiTrap Fibro PrismA and HiScreen Fibro PrismA chromatography, Cytiva, CY7145-08Apr20-DF (2020).
- Rogers R. S. et al. Development of a quantitative mass spectrometry multi-attribute method for characterization, quality control testing and disposition of biologics. MAbs 7, 881–890 (2015).
- Rogers R. S. et al. A view on the importance of multi-attribute method for measuring purity of biopharmaceuticals and improving overall control strategy. AAPS J. 20, 7 (2017).
Fed-batch culture
A mAb-producing Chinese hamster ovary (CHO) cell line was cultured in shake flasks in HyClone ActiPro medium. Cultures were fed with Cell Boost 7a and 7b daily from day 3 until harvest at 87% viability on day 12. The culture was sampled daily from day 3, and cells were removed by centrifugation and filtration. Collected samples were stored at -20°C during the culture time and transferred to -80°C after completion of the culture run. IgG titer and metabolites were monitored by Cedex™ Bio (Roche).
Automated one-step purification
Purification of day 3–11 mAb samples and harvest samples were evaluated on HiTrap Fibro PrismA (0.4 mL unit) and HiTrap MabSelect PrismA (1 mL column) run on an ÄKTA pure system with attached Teledyne ASX-560 autosampler (Teledyne CETAC Technologies) (Fig 10). The protocols for protein A purification used for the Fibro and column runs are listed in Table 2.
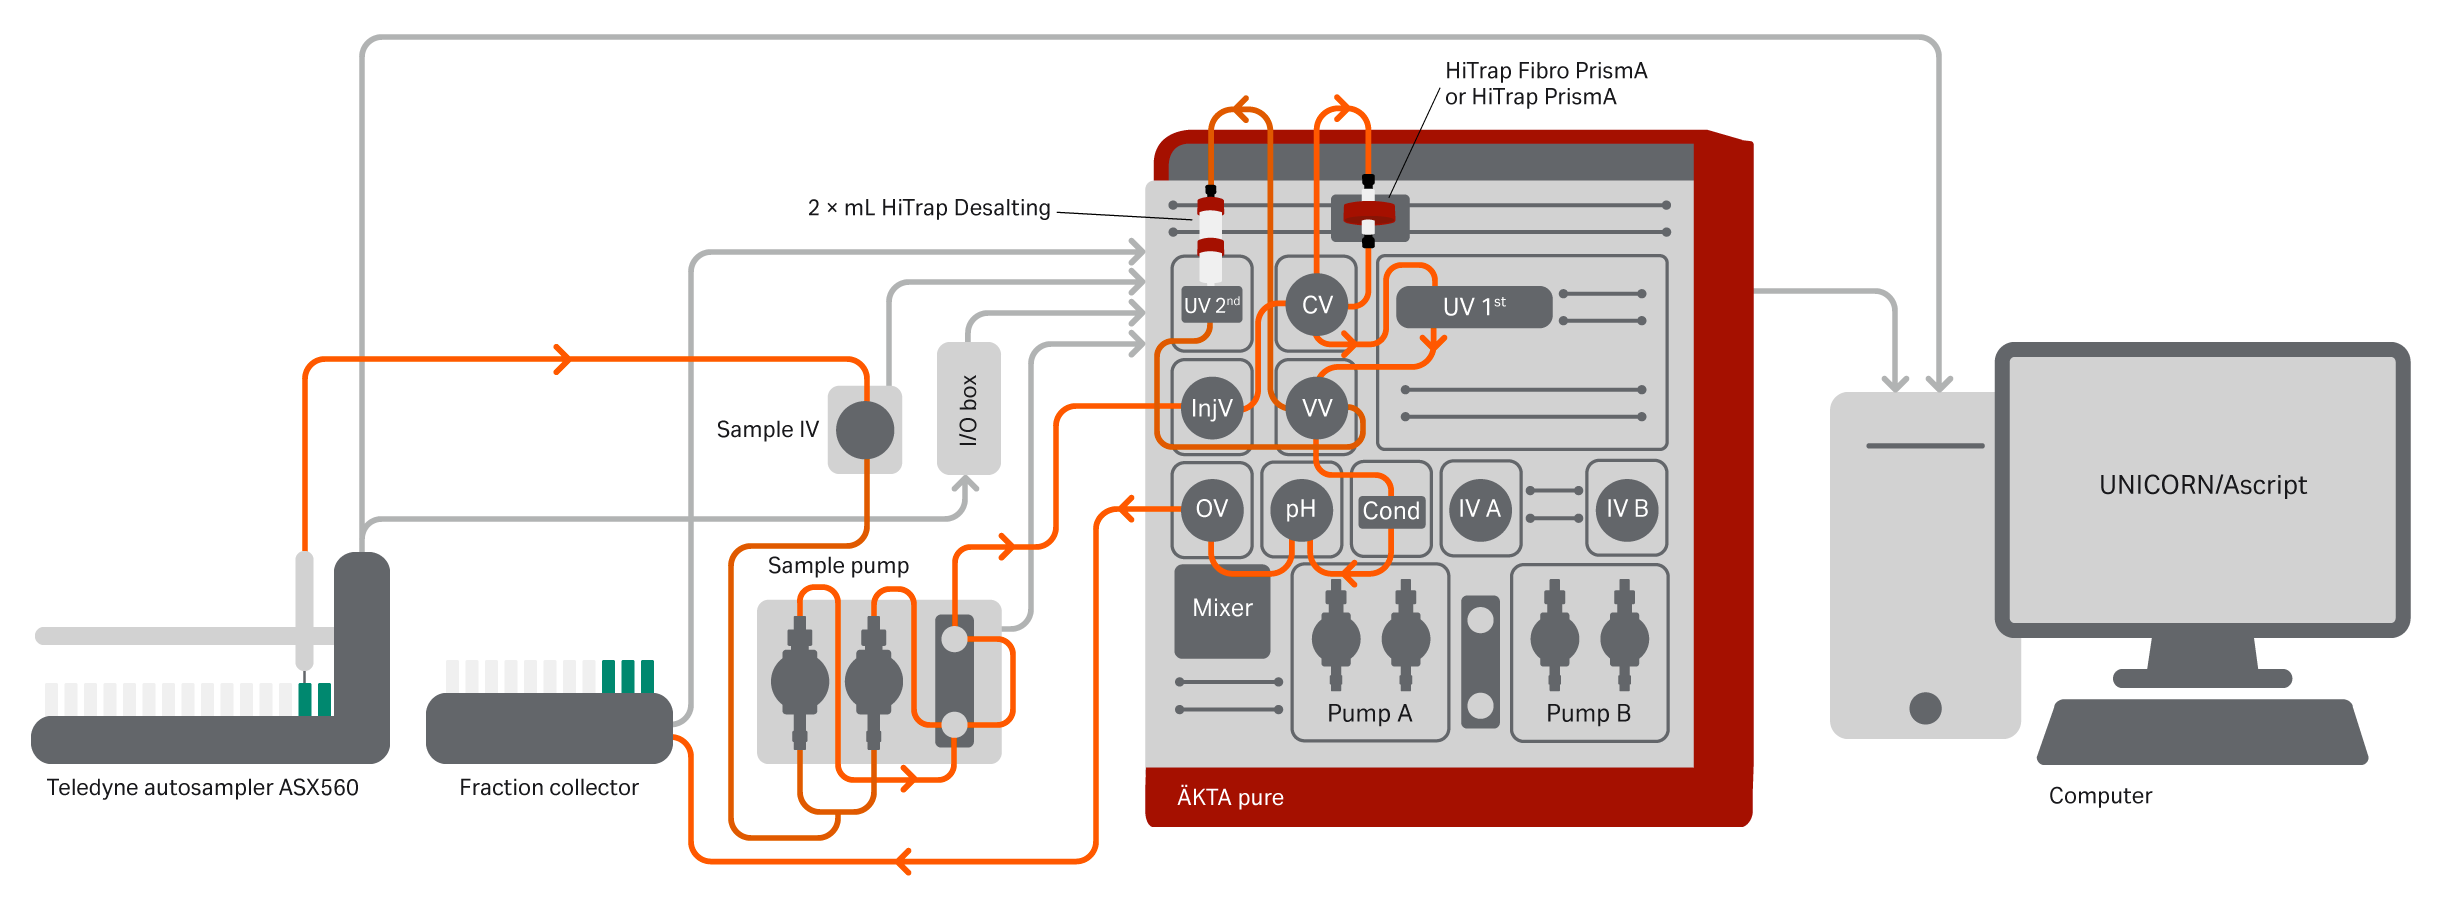
Fig 10. ÄKTA pure system configured for automatic one- and two-step purification schemes. Additional components are a versatile valve and LED UV. The schematic also shows the connected Teledyne autosampler ASX-560, which uses the sample pump for injections. When the first UV sees an eluting peak from the HiTrap Fibro PrismA unit a watch function initiates, turning the versatile valve so that the peak is directed to the 2× HiTrap Desalting columns. The flow will then pass the second UV, the conductivity monitor, and via the outlet valve to the fraction collector. The autosampler was connected via the I/O box using a custom-made cable for matching the input and output signals. The digital output I/O box signals were initially set to 0 for all outputs. The ASX-560 is connected to a host computer using a USB interface. It is controlled using AScript software (v1.5) (Teledyne Technologies Inc), and the software and autosampler actions are initiated by the digital output signals programmed in the UNICORN method.
Table 2. Protocols for protein A purification
| HiTrap Fibro PrismA | HiTrap MabSelect PrismA | |
| Equilibration | 16 mL/min 20 mM phosphate, 150 mM NaCl, pH 7.4, 6 mL (auto zero UV) | 1 mL/min 20 mM phosphate, 150 mM NaCl, pH 7.4, 4 mL |
| Sample load | 16 mL/min 5 mL or 3 mL based on titer | 0.5 mL/min 5 mL or 3 mL based on titer |
| Wash | 16 mL/min 20 mM phosphate, 150 mM NaCl, pH 7.4, 6 mL | 0.5 mL/min 20 mM phosphate, 150 mM NaCl, pH 7.4, 1.5 mL |
| Elution | 4 mL/min 50 mM acetate, pH 3.5, 6 mL Collect eluate based on UV (start level 20 mAU, end level 100 mAU) | 1 mL/min 50 mM acetate, pH 3.5, 4 mL Collect eluate based on UV (start level 20 mAU, end level 100 mAU) |
| Two-step CIP | 16 mL/min 1. 1 M NaOH, 16 mL (up flow) 2. 20 mM phosphate, 150 mM NaCl, pH 7.4, 8 mL (up flow) | 1. 1 mL/min 3 CV 20 mM phosphate, 150 mM NaCl, pH 7.4 (down flow) 2. 0.3 mL/min 4.5 CV (mL) 1 M NaOH (15 min) (down flow) |
| Re-equilibration | 16 mL/min 20 mM phosphate, 150 mM NaCl, pH 7.4, 12 mL | 1 mL/min 20 mM phosphate, 150 mM NaCl, pH 7.4, 5 mL |
| Autosampler CIP sample inlet | 1 M NaOH | 1 M NaOH |
| Autosampler wash sample inlet | 20 mM phosphate, 150 mM NaCl, pH 7.4 | 20 mM phosphate, 150 mM NaCl, pH 7.4 |
Automated two-step purification
In this study we used an autosampler from Teledyne Cetac Technologies (ASX-560), which allows for loading of various larger sample volumes (up to several hundred mL).
Further, an automated two-step tandem purification of mAb feed samples was set up on an ÄKTA pure system. The system was also equipped with a versatile valve (V9-V) and an LED-UV (280 nm, V9-L) placed between the multiple wavelength UV (U9-M) and the conductivity monitor (U9-C). The captured peak from a HiTrap Fibro PrismA unit or from a HiTrap MabSelect PrismA column was directed automatically for buffer exchange to appropriate buffer conditions using 2 × 5 mL HiTrap Desalting columns. This is achieved by programming the UNICORN software with a watch function on the UV level (50 mAU), which sends a command to turn the versatile valve directing the eluate from the Fibro unit or column directly to the two 5 mL HiTrap Desalting columns connected in series.
The purification protocol for the first step was the same as the protocol for the one-step purification (Table 2). The protocol for the second step is shown in Table 3. A schematic view and details of the UNICORN two-step method are shown in Figure 11.
Table 3. Protocols for buffer exchange
| 2 × 5 mL HiTrap Desalting for buffer exchange | |
| Equilibration | 10 mL/min 10 mM HEPES, 150 mM NaCl, pH 7.4, 15 mL (fill system) |
| Sample load | Loading the eluting peak from step one. Programmed as a watch function allowing turning the versatile valve. |
| Elution | 10 mL/min 10 mM HEPES, 150 mM NaCl, pH 7.4, 15 mL (fill system) |
| CIP | 5 mL/min 1 CV 2 min (down flow) 0.1 M NaOH |
| Re-equilibration | 10 mL/mL 2 CV 10 mM HEPES, 150 mM NaCl, pH 7.4 (down flow) |
| Autosampler CIP sample inlet | 1 M NaOH |
| Autosampler wash sample inlet | 20 mM phosphate, 150 mM NaCl, pH 7.4 |
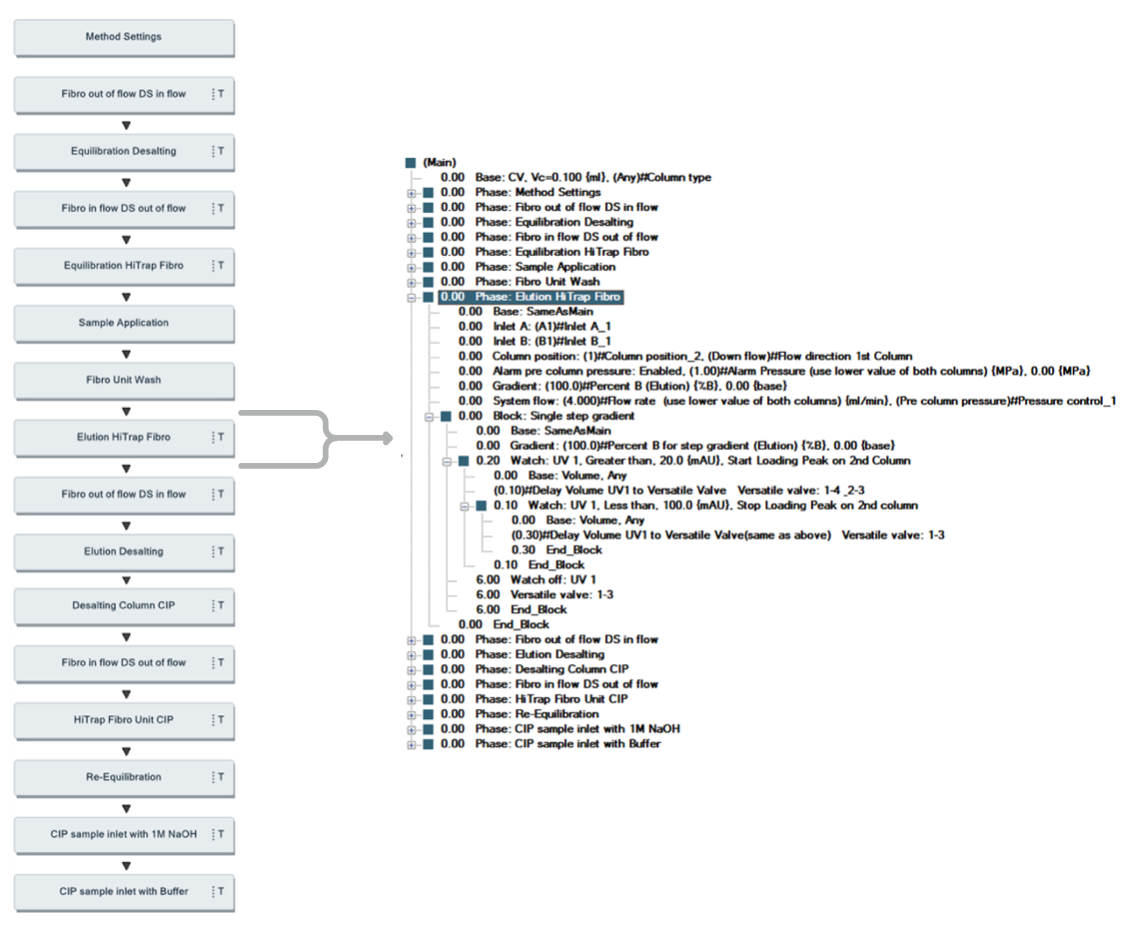
Fig 11. UNICORN method and details for programming watch function for direct load onto the second chromatography step.
SDS-PAGE analysis for carryover analysis
To check for carryover between runs of different samples, blank runs were performed with buffer after the protein A step. Samples were labeled with Cy5 dye then subjected to SDS-PAGE analysis.
Charge variants profile
CIEX was performed on a ProPac™ WCX-10 2x250 mm column (Thermo Fisher) on an Agilent™ 1290 UPLC system with OpenLab™ software (Agilent). Approximately 40 µg sample was injected onto the column. Buffer A was 2.5 mM Tris, 10 mM NaH2PO4 × H2O, pH 6.5–6.6. Buffer B was 2 mM Tris, 10 mM Na2HPO4 × 2 H2O, pH 9.5–9.6.
Aggregate and fragments profile
SEC was performed on a Superdex 200 Increase 10/300 GL on an Agilent 1290 UPLC system with OpenLab. Approximately 40 µg sample was injected onto the column. The buffer was 200 mM phosphate, pH 6.8.
Multi-attribute monitoring–mass spectrometry (MAM-MS)
The HiTrap Fibro PrismA and HiTrap MabSelect PrismA purified mAb samples were reduced, alkylated, and enzymatically digested using trypsin for 4 hours at 37°C. The digestion was quenched by acidifying the samples with formic acid, and the peptides were analyzed by LC-MS/MS in all ions mode using an AdvanceBio Peptide Map 2.1 x 150 mm 2.7-Micron column (Agilent) over an Agilent 1290 Infinity™ II UPLC coupled to a 6550 iFunnel™ Q-TOF LC/MS (Agilent). The LC-MS/MS profiles for mAb samples captured with a Fibro unit or a column were compared in a correlation plot using the Agilent MS Profiler software. The most abundant N-glycosylation profiles (G0F and G1F) were quantitatively compared for the same samples using the Agilent MS Quant software.
The N-linked glycosylation profile is one of the most important PQAs to monitor and control, as N-glycosylations have large biological and immunogenic effects. The most abundant N-glycosylations of human IgG expressed in CHO cells, G0F and G1F, were measured by the MAM-MS method from samples taken daily over the cell culture and captured by either Fibro PrismA or MabSelect PrismA.