Introduction
As the development and manufacturing of biologics for subcutaneous injection grows, new challenges arise in filtration processes. These processes play a crucial role in contamination control during drug substance production, as well as for sterility assurance during the final drug product filling.
When antibody concentrations exceed 100 g/L, fluid viscosity markedly increases. High concentration feeds typically range from 10 to 30 cP compared to just 1 to 5 cP for formulations with concentrations of less than 30 mg/L. This increase in viscosity leads to a reduction in the typical flow rate achieved by any given filter selection. These higher concentrations may also increase filter fouling which reduces the average process flow rate further. Consequently, larger filters are required to process the batch and to maintain targeted flow rates during the final filtration of drug substance and drug product. These larger filters can lead to greater unrecoverable volumes of high-value drugs due to the hold-up volumes of the filter and associated filtration system. In addition, larger filters also have an environmental impact such as greater consumption of water during processing, an increased mass of polymer and corresponding increased weight during shipment and disposal. Such factors are increasingly common contributors to the filter selection criteria.
When reviewing filter performance, relative flow rates may be indicated by a comparison of water flow rates published by the filter manufacturer. However, this alone is not an accurate predictor of in-process performance when a degree of filter blockage is expected. In these instances, filter throughput performance can be evaluated with simple small-scale filterability studies using a fluid sample that is representative of the process material. While testing is relatively easy, the volume of material available during development process restricts opportunities for extensive filter benchmarking even when using predictive modeling to reduce the fluid volumes required. This results in a risk of suboptimal filter selection.
In this application note, we compare the throughput performance of our Supor™ Prime filters with other sterilizing grade filters in a range of moderate-to-high concentrations of monoclonal antibodies (mAbs) and immunoglobulins (IgG)
Throughput testing
We performed filter throughput testing using 17 fluids with antibody concentrations ranging from 70 to 220 g/L. Of these fluids, 14 were supplied by end-users and a further 3 were tested from a bank of internal test fluids. Details of each fluid and filter test format used in the study are shown in Appendix 1.
Table 1. Filters evaluated in this study and published specifications of production scale 254 mm (10 in.) formats
| Filter | Manufacturer | Filter membrane material of construction | Rating |
Area per 254 mm (10 in.) filter (m2) |
Water flowrates per 254 mm (10 in.) filter (L/min/100 mbar) |
| Supor™ Prime | Cytiva | Polyethersulfone | 0.2 µm | 1.34 | 18 |
| Express® SHC | Merck Millipore EMD | Polyethersulfone | 0.2 µm | 1.0*† | ~8† |
| Sartopore® Platinum | Sartorius KGa | Polyethersulfone | 0.2 µm | 1.0‡ | ~8‡ |
* High area variant
† Lit. No. MK_PG1284EN Ver 2.0 39880 03/2022
‡ Publication No.:SPK2157-e | Status: 08 | 01 | 2022
Test method
Filterability tests were performed using the most suited small-scale device available given the volume of fluid available. The test device areas and descriptions can be found in Appendix 1.
Each study was performed using the same feed material for each filter using a constant pressure of 0.69 bar (10 psi) and an automated data collection system to record the decline in flow rate.
Throughput for each filter and fluid combination was calculated from these data using the standard pore plugging model1 and reported as the calculated volumetric throughput at 90% flux decay (V90) in L/m2. All subsequent analyses assume the stated area of the device used is accurate and scales linearly based on the quoted area for larger devices.
1 Grace H.P., Structure and performance of filter media. II. Performance of filter media in liquid service, AIChE Journal, 2 (1956) 316–336. Doi10.1002/ aic.690020308
Results
We observed that the calculated throughput (V90) for Supor™ Prime filters varied by several orders of magnitude, from ~25 to ~6000 L/m2, across the range of fluids in this study (Fig 1). The relative performance of the other filters tested compared to Supor™ Prime filters are shown in Figures 2a and 2b.

Fig 1.Throughput performance per m2 of filter area. Each data point is n=1 tested in parallel with other filters. Individual feed comparisons may vary upon replication.

Fig 2a. Relative throughput performance per m2 of filter area. Each data point is n=1 tested in parallel with other filters and individual feed comparisons may vary upon replication.
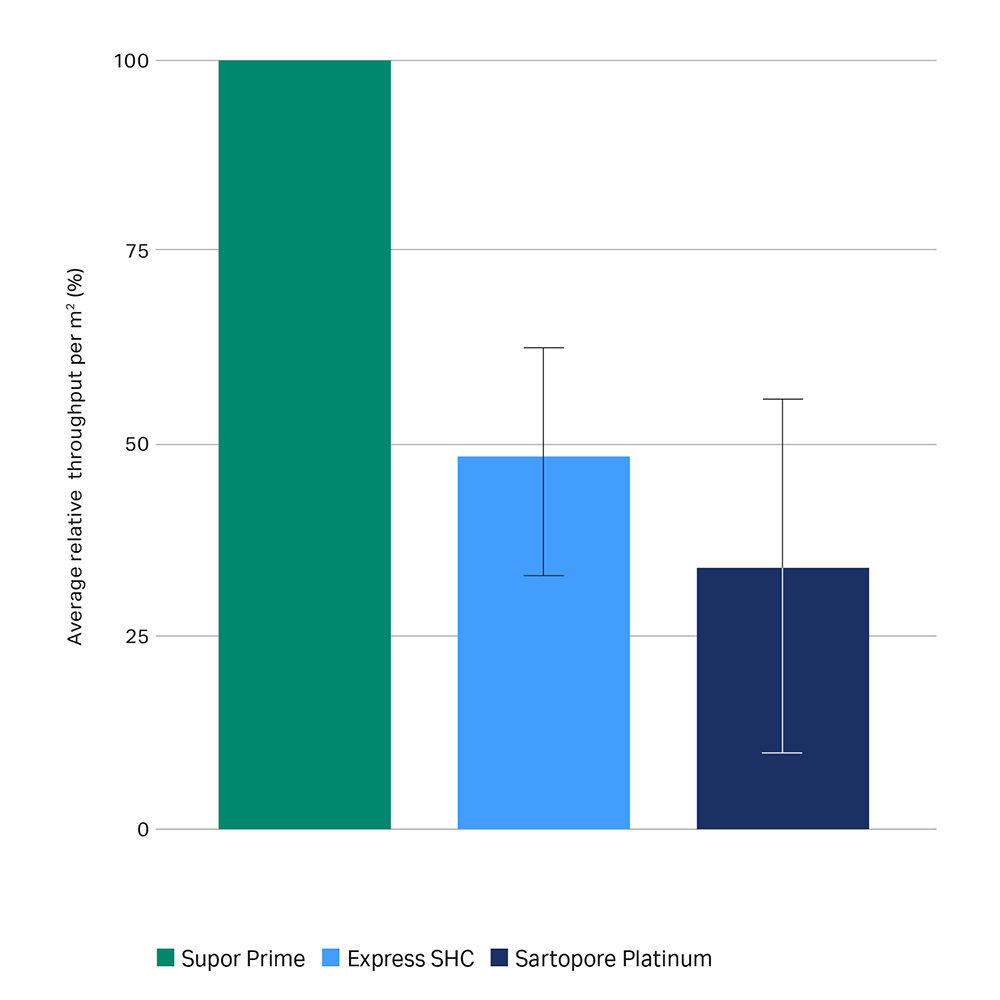
Fig 2b. Average relative throughput performance per m2 of filter area. Error bars represent one standard deviation of the mean. The difference in the mean is highly significant (p<0.01) for Express SHC (n=17) and Sartopore Platinum (n=17) using a two-tailed paired Student’s t-test. Results for individual feeds will vary.
Analysis
The wide range of throughput results obtained for all filters tested highlights the importance of throughput testing to establish the likely performance for each process fluid. While the relative throughput per filtration area is an indicator of performance, an assessment of filter throughput for each filter format taking the area of that format into consideration should be made before making a direct comparison.
The data shown in Figures 3a and 3b is adapted from data shown in Figure 2a and 2b to account for the different filter areas in this reference format. In this scenario the higher area of the Supor™ Prime filter extends the average performance margin of Supor™ Prime filters compared to other filters in this study.

Fig 3a. Relative throughput performance per 254mm (10 in.) filter. Each data point is n=1, tested in parallel with other filters and scaled up using published filtration areas. Individual feed comparisons may vary upon replication..

Fig 3b. Average relative throughput performance per 254 mm (10 in.) filter. Each data point scaled up using published filtration areas. Error bars represent one standard deviation of the mean. The difference in the mean is highly significant (p<0.01) for Express SHC (n=17) and Sartopore Platinum (n=17) using a two-tailed paired Student’s t-test. Results for individual feeds will vary.
Impact of filter performance on process filter sizing
Filter sizing needs to consider the critical process parameters that must be achieved during each filtration operation. The bulk filtration of high concentration fluids is typically driven by the capacity of the filter. The final filtration of drug product may also need to consider a minimum acceptable average flow rate and filter blockage may be reduced due to previous filtration of the fluid. However, low fouling should not be assumed as storage, transportation or any freeze/thaw process may generate multimers and aggregates that may increase filter blockage despite previous filtration. Filter testing is always recommended.
Sizing example
The maximum volumetric capacity is typically the filter performance attribute that influences filter sizing the most. The following example uses the mean throughput performance from this dataset based upon a typical relative performance shown in Figure 2a. The impact of the effective filtration area of the targeted filter configuration is also included to represent a real-world filter sizing exercise, including a nominal safety margin of 50%.
Table 2. Impact of throughput of filter sizing
| Filter membrane | Throughput, V90 (L/m2) | Minimum filter area for 250 L batch† (m2) | Recommended filter size‡ | Recommended filter device area (m2) |
| Supor™ Prime | 1000 | 0.38 | 1 × 5 in. | 0.63 |
| Express SHC | 491 + 155 = 646* | 0.59* | 1 × 10 in. | 1.00 |
| Sartopore Platinum | 344 + 235 = 579* | 0.65* | 1 × 10 in. | 1.00 |
* Calculated using average relative throughput performance (mean + 1σ) shown in figure 1b
† Including 50% area safety margin
‡ Based on published areas of filter modules. Other filter configurations may be available.
Conclusion
Throughput performance varies significantly across different feed streams however, these data demonstrate a significant increase in average relative performance when compared to the other filters tested.
Across the range of high concentration antibody feed streams tested ranging from 70 to 220 g/L, the average throughput of Supor™ Prime filters is shown to be 2x the other filters tested.
Summary
Selecting the right sterilizing grade filter for highly concentrated and viscous mAb solutions requires careful thought and consideration. Often, during process development, there’s a limited amount of fluid available, making it impractical to test numerous filtration products. This limitation can lead to a risk of not including the ideal filter grade in the test panel, resulting in potentially oversized filters, and reduced yields due to the increased filter hold-up volumes of these larger than necessary filters.
This study confirms that, on average, Supor™ Prime filters outperform the other filters tested in a range of high concentration and viscous feeds. On average, Supor™ Prime filters deliver twice the volumetric throughput, enabling operational benefits associated with smaller filter such as increased yield.
Additional benefits such as reduced water consumption may also be realized alongside the environmental benefits of reduced shipping and disposal weights associated with the use of smaller products. Furthermore, for low fouling applications the comparatively high water flow rate compared to similar published values indicates shorter filtration times are likely in both high and low fouling feeds.
Every process formulation comes with a unique filtration challenge. It is recommended that these should be quantified early in the process development pathway. These findings emphasize the value of including Supor™ Prime sterilizing grade filters when evaluating filter options, particularly for challenging fluids such as high concentration mAbs and viscous drug formulations.