In this article, we will show and discuss our workflow used for the purification of a recombinant protein expressed in E. coli utilizing hydrophobic interaction chromatography (HIC). Our workflow includes the use of high-throughput process development (HTPD) plates to facilitate the choice of resin and initial conditions for column chromatography. The range of buffer conditions we used in this study was based on the results of an initial solubility study, and all the resins used were Capto™ high productivity resins. Based on the chromatographic results we found that a wash step before the elution step reduced the amount of impurities. We also performed a design of experiments (DoE) to optimize the wash step and the results were confirmed in a verification run.
Introduction
In downstream bioprocessing, the first step in a typical three-step chromatographic purification process is the capture step. Its aim is to concentrate the target protein and isolate it from harmful, host cell-derived components, for example, proteases, that otherwise may degrade the target protein. The next step is an intermediate purification step designed to remove the bulk of impurities. Finally, a polishing step is used to remove the trace amounts of harder-to-remove impurities that are more closely related to the molecule of interest. It is important to ensure that the techniques used for a multistep purification protocol are selected in an orthogonal manner to ensure that each step leverages a different characteristic of the molecule of interest for the separation.
If an affinity chromatography solution is available for the target molecule, for example, monoclonal antibodies, this may reduce the need for an intermediate polishing step, as the purity is often already high after the first step.
In this study, we focused on developing the workflow for an intermediate purification step using HIC (Fig 1, see A guide to polishing chromatography for more background information). HIC was chosen as a suitable technique as it is orthogonal to the first step, the capture step, where a cation exchanger was used to process the material. For the last step, polishing, anion exchange or multimodal chromatography with anionic groups could be used to enable clearance of negatively charged impurities such as DNA, viruses, and other product-related impurities that were not removed in the two former steps.
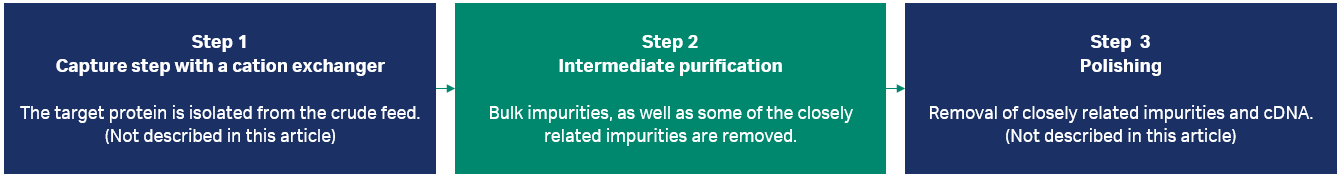
Fig 1. In this study, we focused on improving the second step in the process, intermediate purification.
Overview of the intermediate purification process workflow
The recombinant protein sample used for this study contained fragments of the target molecule. An important goal for this intermediate purification step was to significantly reduce these fragments while maximizing the yield of the full-length target protein. Additionally, as a step-wise large-scale purification was the desired end result, the goal of this study was to also find the conditions for the step-wise elution. We first deployed gradient elution to explore the optimal condition for the step-wise elution later in the study. As the solubility of the protein is essential for the success of purification, the protein solubility study was performed first. When deciding on which resin to use for this study, the resin chosen should be able to selectively bind either the protein fragments or the target protein to elute the target protein with a high yield. As a bind/elute step is influenced by the resin used and by the buffer conditions, both should be screened in parallel.
The workflow used in the process development for the intermediate purification step was:
- Investigation of solubility
To understand how salt additives and pH influence the solubility of the target protein. The study was performed in 96-well UV plates.
- Screening of binding conditions and resin selection
To minimize use of sample, the screening was performed as static binding experiments utilizing PreDictor™ plates. The operational range of buffer conditions used in the study were determined from the solubility study and the following resins were screened: Capto™ Butyl ImpRes, Capto™ Phenyl ImpRes, and Capto™ Phenyl (High Sub). The optimal conditions are defined by high binding of the target protein and low levels of fragments in the eluted fraction.
- Column studies based on plate results — binding capacity
The selected resin (Capto™ Butyl ImpRes) with the most promising binding conditions was further investigated in a column format study to determine the dynamic binding capacity.
- Column studies based on plate results — selectivity study
The conditions found in the PreDictor™ plate study was used for a gradient elution study in columns. The purpose was to verify the salt concentration for the elution step and evaluate the selectivity. The results of the study suggested that fragments could be removed in a wash step before elution.
- Screening of elution conditions
The results from former steps indicated that both the pH and salt concentration should be altered compared to the loading condition. To achieve complete elution of the target protein, we screened the elution conditions using a 96-well PreDictor™ plate by applying varied pH and salt concentrations in elution buffers.
- Optimization of wash step in column studies
To optimize the wash step, we evaluated the wash step conditions of salt concentration, loading amount, and length of wash. The optimization was performed with a design of experiment (DoE) methodology approach in a column format. A central composite orthogonal (CCO) design was deployed, and promising conditions were identified from the statistical evaluation. The robustness of found conditions were further verified by applying Monte Carlo simulation.
- Verification runs
The conditions identified in the Monte Carlo simulation were used in a verifying column experiment to compare the outcome with expectations in respect to purity and yield.
Start material for the intermediate polishing step
The start material for the experiments described was a recombinant protein with a truncated fragment as a major impurity. As the impurity can be resolved on size exclusion chromatography (SEC), this technique was used for analysis of the starting material as well as the collected fractions and pools throughout the experiments. The results from analysis of the start material are shown in Figure 2, and Table 1, and it can be concluded that the fragment content corresponded to approximately 14% of the total protein content.
Column: Superdex™ 200 Increase 10/300 GL
Sample: The recombinant protein sample prepurified on a cation exchanger
Sample load: 20 µL
Equilibrium buffer: PBS buffer
Flow rate: 0.8 mL/min
System: ÄKTA™ system
Detection: 215 nm
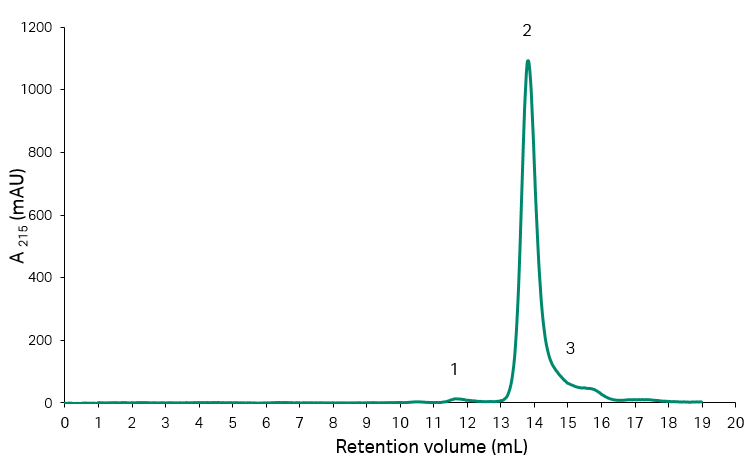
Fig 2. SEC analysis of initial recombinant protein sample on Superdex™ 200 Increase 10/300 GL with UV-detection at 215 nm.
Table 1. Resulting peak areas and percentage area from SEC analysis of start material for the HIC-step.
| Area number | Peak area (mAU × mL) | Peak area/total area (%) |
| 1 (aggregates) | 7.40 | 1.0 |
| 2 (main) | 617.7 | 85.7 |
| 3 (fragments) | 104.2 | 14.3 |
Process development steps
In this section, each step of the process development workflow is detailed. Click on each title to expand the various sections.
Investigation of solubility
It is critical to have a soluble protein during the purification steps, therefore the solubility should be investigated first. The parameters such as pH, salt type, and salt concentration in buffer are the major factors that affect the solubility of the protein.
In this study, the solubility of the protein was tested in 96-well plates with three different salts in varied concentrations added to a sodium acetate buffer in the pH range of 3.0 to 6.0. The salts evaluated were sodium chloride, sodium sulfate, and ammonium sulfate. The buffers were prepared using a Tecan robot.
In each well on the 96-well UV plates, 180 µL of buffer was added and followed by addition of 20 µL of sample with a concentration of 16 mg/mL, achieving a final protein concentration of 1.6 g/L in each well. The plates were incubated for 30 min at room temperature and then read on a UV reader at 400 and 600 nm. An increase in absorbance at both these wavelengths was interpreted as precipitation of the protein.
Results
In Figure 3 and Figure 4, we marked the results from UV observation among all the tested buffer conditions. The orange areas indicate the precipitation of protein where we found an increase of UV absorbance, whereas the green areas indicate that no precipitation was observed. In this solubility study, we found:
- The limited solubility at lower pH levels resulted in the exclusion of sodium chloride from further experiments.
- Ammonium sulfate works well up to a concentration of 1 M, while at higher concentrations the target protein precipitates as shown in Figure 4. This salt was taken forward for further experiments (at salt concentrations < 1 M).
- Sodium sulfate also worked well in all conditions studied and was also chosen for further experiments.
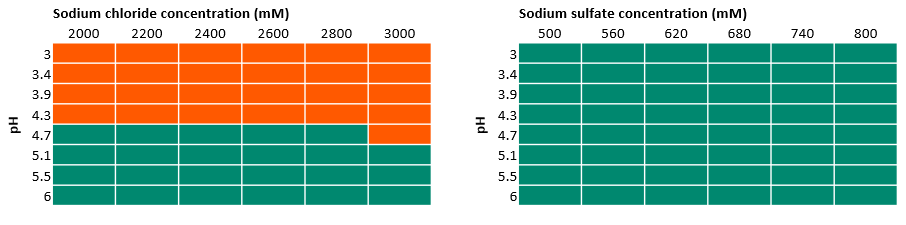
Fig 3. Results of 96-well experiments with 100 mM acetate buffer at different pH values and varied sodium chloride and sodium sulfate concentrations. Absorbance was measured at 400 and 600 nm. Green indicates there was no precipitation, while orange indicates precipitation.
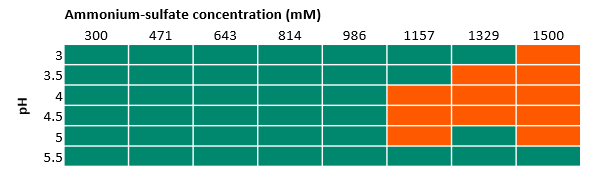
Fig 4. Results of 96-well experiments with 100 mM acetate buffer at different pH and varied ammonium sulfate concentrations. Absorbance was measured at 400 and 600 nm. Green indicates there was no precipitation, while orange indicates precipitation.
Screening of binding conditions and resin selection
In this step, we screened the buffer conditions by varying the salt type, salt concentration, and pH in parallel with the different resins. With four variable parameters in a study, a PreDictor™ plate study is a good choice. A 96-well PreDictor™ plate with three resins of different hydrophobicity was used for resin screening. As the intention was to design a bind/elute polishing step, high resolution Capto™ ImpRes resins were considered as candidate resins for this study. The third resin on the PreDictor™ plate was Capto™ Phenyl (High Sub) to see the impact of hydrophobicity. We screened for binding conditions by investigating static binding capacity (SBC) using PreDictor™ plates with 6 µL resin/well because it requires less protein samples. The disposition of resins in plates study is presented in Figure 5.
The experiment was performed on two plates, one with ammonium sulfate, and the other one with sodium sulfate as the added salt. The salt concentration was varied from 100 to 800 mM while pH varied from 3.0 to 4.5 (acetate buffer). The PreDictor™ plates were equilibrated to their respective conditions before applying the sample (200 µL liquid volume) at a concentration of 2.7 g/L. The concentration was chosen to enable an excess of protein during the incubation. The plates were incubated for 60 min on an orbital shaker (1100 rpm). The buffer was removed by centrifugation (flowthrough fraction), collected in a UV-plate, and the UV absorbance of collected buffers was then measured at 237 and 276 nm. We used the Assist software to evaluate the results.
Results
We observed higher SBC on the plate studies when using sodium sulfate compared to ammonium sulfate (data for ammonium sulfate not shown here). In addition, sodium sulfate was used in the buffer in the previous capture step, thus no buffer exchange is needed. Therefore, we chose sodium sulfate for further investigation. The determined SBC was close to 40 g/L resin for both the Capto™ Butyl ImpRes resin and Capto™ Phenyl (High sub) resin with the optimal binding conditions (pH, salt, and salt type) (Fig 6). However, when inspecting the plate results for nonbinding conditions, that is, tentative good elution conditions, Capto™ Butyl ImpRes was more promising, with low SBC at low salt concentrations across almost the full pH range investigated. On the other hand, the binding of Capto™ Phenyl (High Sub) was too strong and no promising elution conditions could be identified. Therefore, Capto™ Butyl ImpRes resin was selected for this purification.
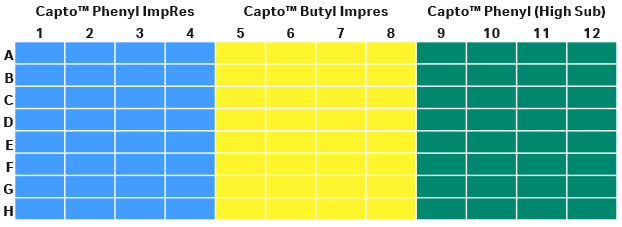
Fig 5. Disposition of resins in the filter plate for SBC study.
(A) Capto™ Phenyl ImpRes
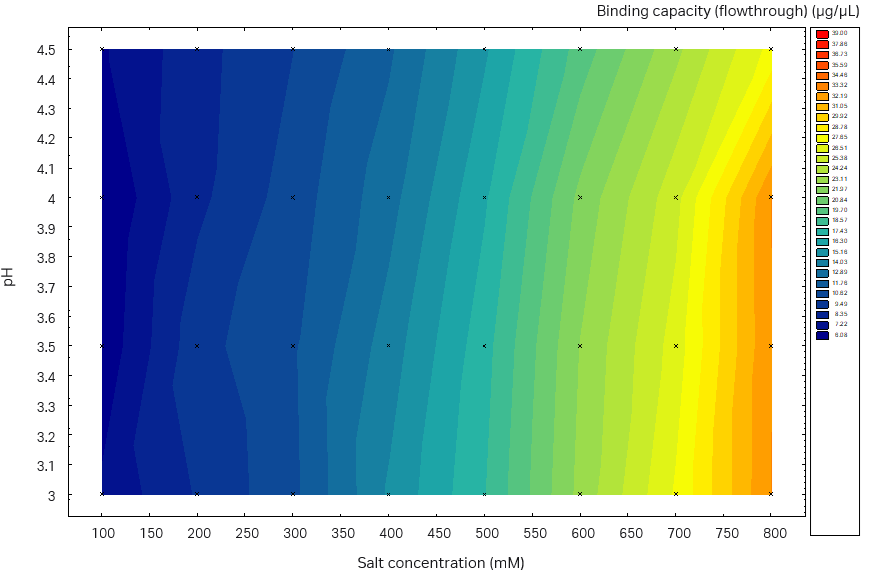
(B) Capto™ Butyl ImpRes
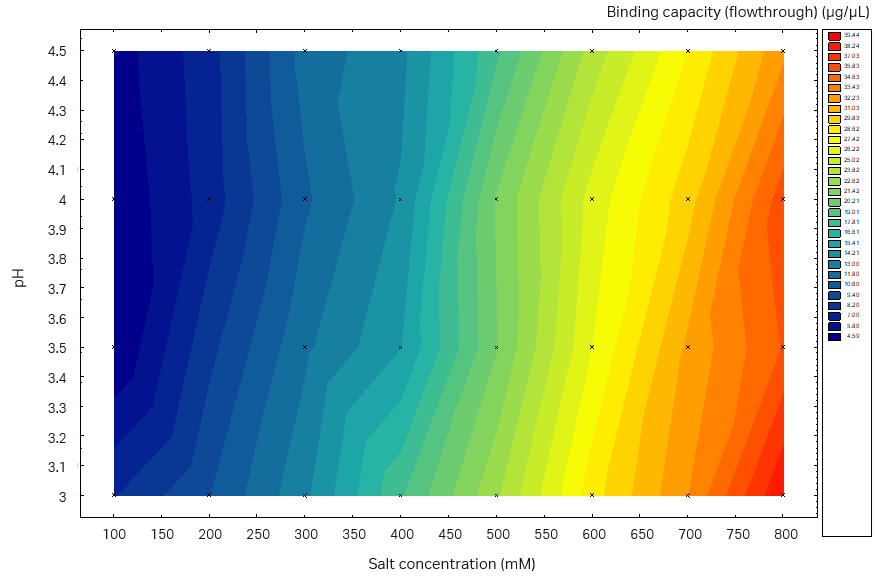
(C) Capto™ Phenyl (High Sub)
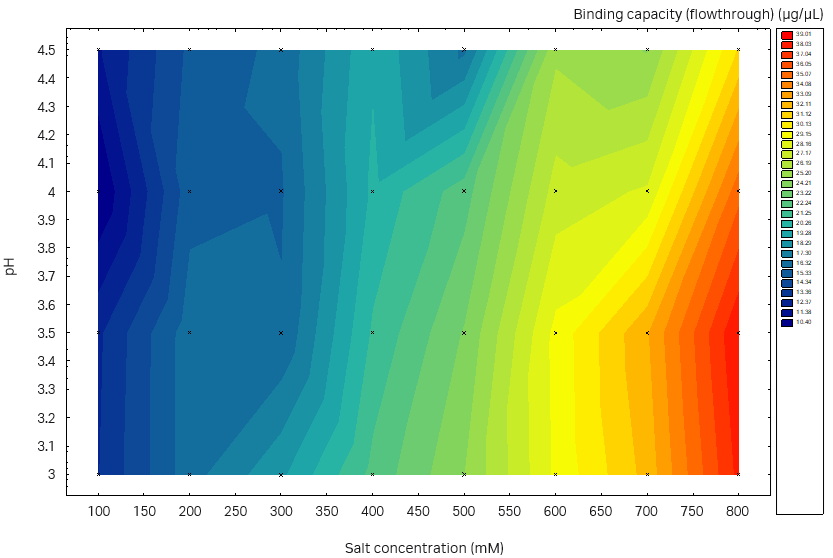
Fig 6. Static binding capacity for mAb in different buffer compositions (100 mM acetate buffer, pH 3.0 to 4.5 with the addition of 100 to 800 mM sodium sulfate). (A) Capto™ Phenyl ImpRes, maximum SBC 33 mg/mL resin, (B) Capto™ Butyl ImpRes, maximum SBC 39 mg/mL resin, (C) Capto™ Phenyl (High Sub), maximum SBC 39 mg/mL.
Column studies based on plate results — binding capacity
Before running the first selectivity studies on a column, a relevant load of protein sample needed to be determined. Static binding capacity from the plate studies gives results close to the maximum binding capacity, but for running the purification on columns which are dynamic processes, the binding capacity should be tested at relevant residence time. Thus, we tested the dynamic binding capacity (DBC) of Capto™ Butyl ImpRes resin for the protein sample by running a frontal analysis at 4 min residence time.
A Tricorn™ 5/50 chromatography column with a bed height of 5.5 cm was used. Based on the results from the PreDictor™ plate studies, the conditions used for the experiment were 800 mM sodium sulfate in 100 mM acetate buffer at pH 3.0. Protein concentration was 2.0 mg/mL, and an ÄKTA™ chromatography system with a Superloop™ assembly to facilitate the loading of large sample volumes was used for the experiment. We loaded the sample until the absorbance of the flow-through fraction reached 80% of the absorbance of the loaded protein solution. The DBC was calculated using extensions for UNICORN™ 7 software, and the results are summarized in Table 2.
Find out how to determine DBC in this article.
Table 2. Results for DBC of recombinant protein on Capto™ Butyl ImpRes resin
| QB5(DBC at 5% breakthrough) | 23.5 mg/mL resin |
| QB10 (DBC at 10% breakthrough | 24.2 mg/mL resin |
| QB80 (DBC at 80% breakthrough) | 40.0 mg/mL resin |
Column studies based on plate results — selectivity study
The first chromatographic runs were performed to evaluate the selectivity of the resin on the target protein and the impurities. For the amount of loaded protein, 50% of DBC at 10% breakthrough (QB10) was chosen. Using the results of the plate study, the elution was performed as a gradient from 800 mM to 0 mM of sodium sulfate in 10 column volumes (CV) and a simultaneous increase in pH from 3.0 to 5.5. During elution, fractions were collected and analyzed for fragments with SEC.
Results
We found that the low molecular weight (LMW) fragments eluted in the front part of the elution peak, suggesting that a wash step before elution could improve the purity of the elution pool (Fig 7). The salt concentration during the wash step should also be kept high to prevent elution of the target protein from the column as it elutes late in the gradient. The elution of target protein at low salt condition indicated the probability of eluting the target protein without additive salt in a step wise elution procedure. This works synergistically with the later polishing step. Based on our previous results from the condition screening study, we identified that pH may play a role in the elution. Hence, we had pH in the elution buffer as a variable parameter in the next static elution study.
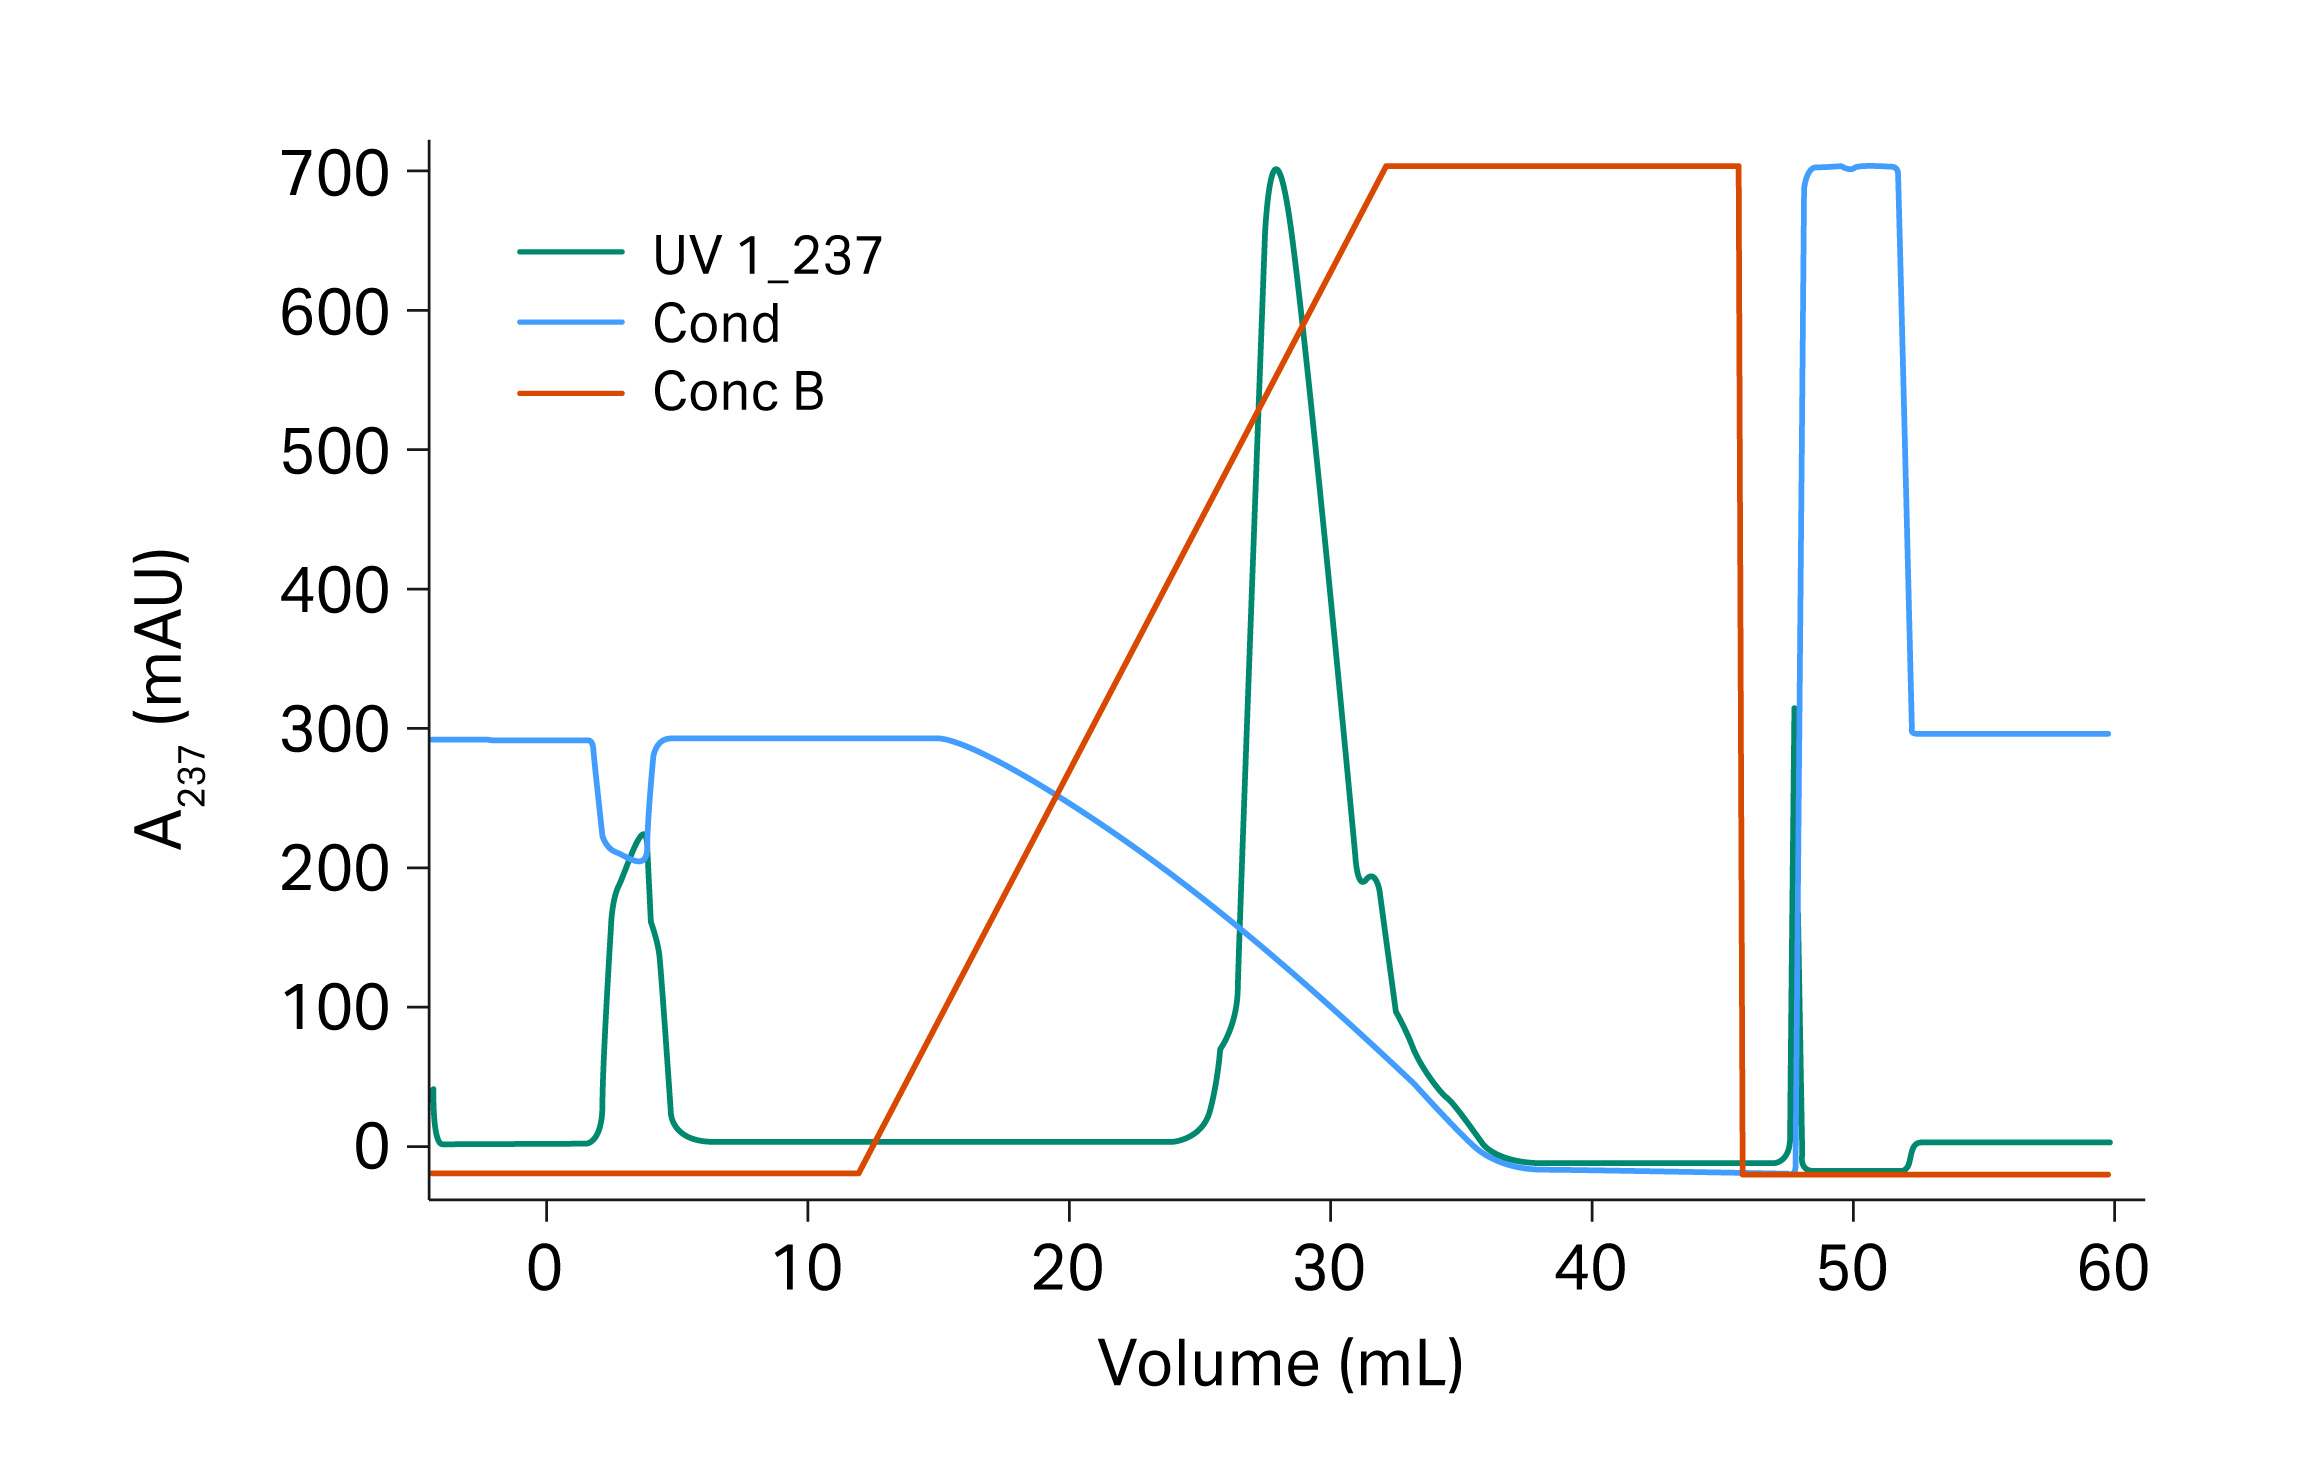
Fig 7. Selectivity runs with gradients from 800 mM to 0 M sodium sulfate in 10 CV. The first peak in the chromatogram corresponded to additives that were present in our first sample preparations but were later removed.
Investigation of elution conditions
The protein sample conditioned in 800 mM sodium sulfate at pH 3 was added to each well in a 96-wells PreDictor™ plate filled with 20 µL of CaptoTM Butyl ImpRes resin. The amount of loaded protein corresponded to 50% of DBC at QB10 of the resin. After washing with loading buffer, the elution was performed three times with elution buffer. For the elution buffer, the pH and salt concentration were varied. All eluates were analysed, and total yield was calculated.
A detailed procedure for performing a plate study can be found here.
Results
From the Capto™ Butyl ImpRes PreDictor™ plate study, the highest yield was obtained at pH 4.5 to 5.5 (Fig 8). We decided to use pH 5.5 for the elution, and to introduce an intermediate wash step to remove the LMW fragments that were eluted in the front of the elution peak. The wash step should be performed at high salt concentration to avoid the elution of the target protein.
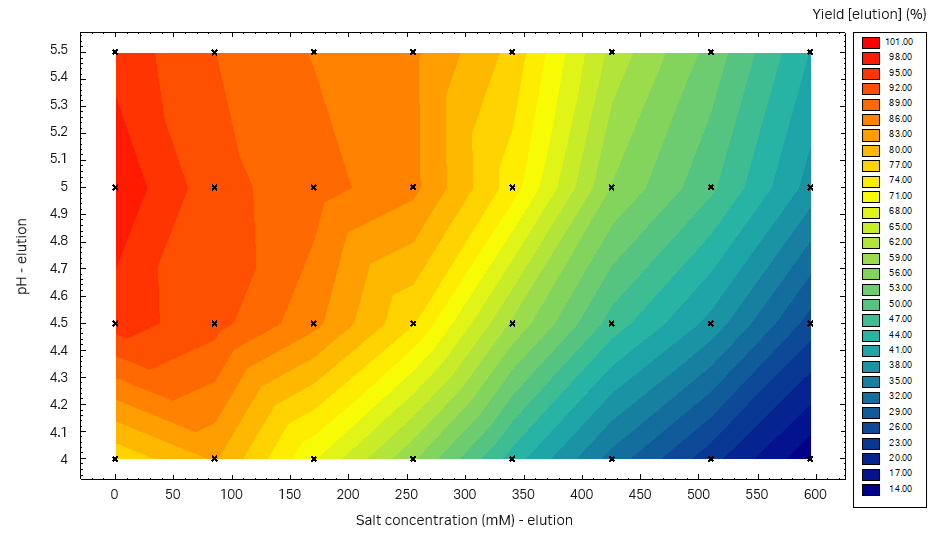
Fig 8. Yield at different pH-salt conditions in three consecutive elutions from a Capto™ Butyl ImpRes PreDictor™ plate study.
Optimization of the wash step
The parameters that needed to be optimized in the wash step were the salt concentration and wash volume. The load volume was also important for resolution, so it was included in this study. In this study, we chose a Design of Experiment (DoE) methodology to identify the best conditions. Through the DoE approach, using CCO design, we can optimize the conditions and reveal the correlations between all the parameters that can't be analyzed via One Factor at a Time (OFAT) approach. In the DoE set-up, the CCO design resulted in 17 experimental runs shown in Table 3. Yield and purity were chosen as responses, that is, the outcome to monitor in these 17 experiments.
Results
The outcome of the study from the first 17 experiments is illustrated as surface plots in Figures 9 and 10. After checking that the model achieved was statistically robust (R2 < 0.9 and Q2 > 0.8 for both yield and removal of fragments), the model showed a balance between yield of target protein and purity. As can be seen in the plots, high wash volumes at low salt concentrations will give the highest purity. However, at these conditions the yield would be low. After evaluating the DoE, we found that the load should be at most 14 g/L resin and thus two additional experiments were performed at a lower load (Table 3, experiments 18 and 19, results not shown).
A Monte Carlo simulation was then performed where limits for yield and purity were set. The limits used were a yield of recombinant protein > 95% and LMW impurities < 6%. From the Monte Carlo simulation, the optimal conditions that fulfilled the requirements with a 1% risk of failure were a protein load at 11.3 g/L resin and a wash at 600 mM salt for 4.36 CV (Fig 11). The influence of salt concentration on purity and yield according to the Monte Carlo simulation is presented in Table. 4. The influence of salt concentration may also be seen from the green area in Figure 11, where both load volume and salt concentration in the wash may vary but are still within the acceptable range.
Table 3. DoE experimental runs with chromatographic conditions
| Experiment number | Experiment name | Run order | Load (g/L) | Wash salt (mM) | Wash CV |
| 1 | N1 | 1 | 14 | 580 | 4 |
| 2 | N2 | 9 | 19 | 580 | 4 |
| 3 | N3 | 6 | 14 | 650 | 4 |
| 4 | N4 | 7 | 19 | 650 | 4 |
| 5 | N5 | 11 | 14 | 580 | 10 |
| 6 | N6 | 10 | 19 | 580 | 10 |
| 7 | N7 | 8 | 14 | 650 | 10 |
| 8 | N8 | 2 | 19 | 650 | 10 |
| 9 | N9 | 13 | 13.5 | 615 | 7 |
| 10 | N10 | 14 | 19.5 | 615 | 7 |
| 11 | N11 | 4 | 16.5 | 573 | 7 |
| 12 | N12 | 5 | 16.5 |
657 | 7 |
| 13 | N13 | 12 | 16.5 |
615 | 3.4 |
| 14 | N14 | 16 | 16.5 |
615 | 10.6 |
| 15 | N15 | 3 | 16.5 |
615 | 7 |
| 16 | N16 | 15 | 16.5 |
615 | 7 |
| 17 | N17 | 17 | 16.5 |
615 | 7 |
| 18 | N18 | 18 | 10 | 590 | 4 |
| 19 | N19 | 19 | 10 | 590 | 10 |
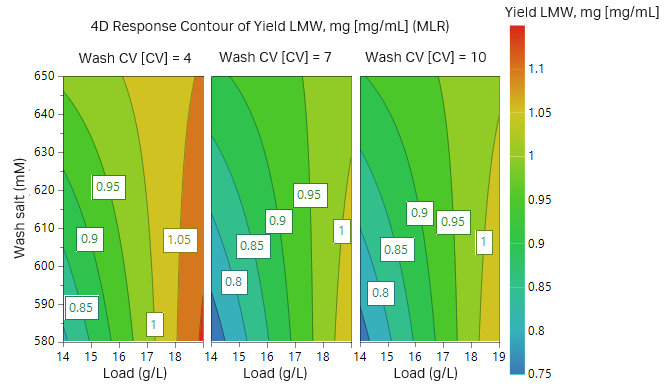
Fig 9. Contour plot for recombinant protein purity (low LMW yield = high protein purity) in respect to sample load, wash salt concentration, and wash volume.
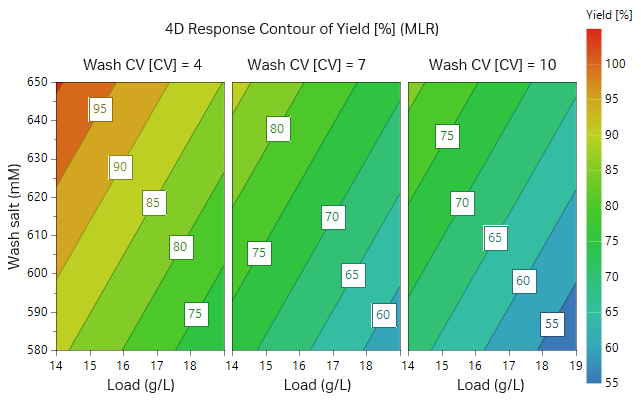
Fig 10. Contour plot for recombinant protein yield in respect to sample load, wash salt concentration, and wash volume.
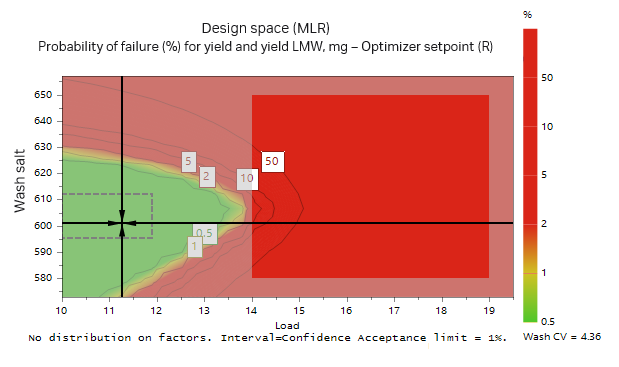
Fig 11. Monte Carlo simulation of the model found in the DoE. The green area illustrates area where the probability of failure is less than 1% when using a wash volume of 4.36 CV. The accepted outcome was > 95% yield of target protein and < 6% of LMW fragments.
Table 4. Expected influence of wash salt concentration on yield and purity
| Load (mg) | Wash salt (nM) | Wash (CV) | Yield target protein (%) | Lower (%) | Upper (%) | Yield LMW (mg) | Lower (mg) | Upper (mg) | Amount target protein (mg) | Remaining LMW |
| 11.3 | 600 | 4.36 | 96.5 | 91.8 | 101.0 | 0.6955 | 0.6287 | 0.7622 | 10.90 | 6.00 |
| 11.3 | 590 | 4.36 | 94.4 | 89.7 | 99.1 | 0.6530 | 0.5809 | 0.7251 | 10.67 | 5.77 |
| 11.3 | 610 | 4.36 | 95.8 | 93.9 | 103.1 | 0.7379 | 0.6672 | 0.8087 | 10.13 | 6.22 |
Verification runs for recombinant protein
The conditions used for the verification run were the optimal conditions suggested by the Monte Carlo simulation (Fig 12). The verification run was performed in a 20 cm Tricorn™ 5/200 column (previous experiments were performed at 10 cm bed height) and the result was expected to be close to the results from the Monto Carlo simulation.
Column: Tricorn™ 5/200
Sample: recombinant protein (2.0 mg/mL)
Sample load: 11.3 mg/mL
Equilibration buffer and sample buffer: 100 mM acetate, 800 mM sodium sulfate, pH 3.0
Wash: 100 mM acetate 600 mM sodium sulfate, pH 5.5, 0.25 mL/min, 4.36 CV
Elution buffer: 100 mM acetate, pH 5.5, 5 CV
CIP: 1 M NaOH, 0.25 mL/min, 2 CV
Re-equilibration: equilibration buffer, 0.5 mL/min, 5 CV
System: ÄKTA pure™ 25
Detection: 237 nm
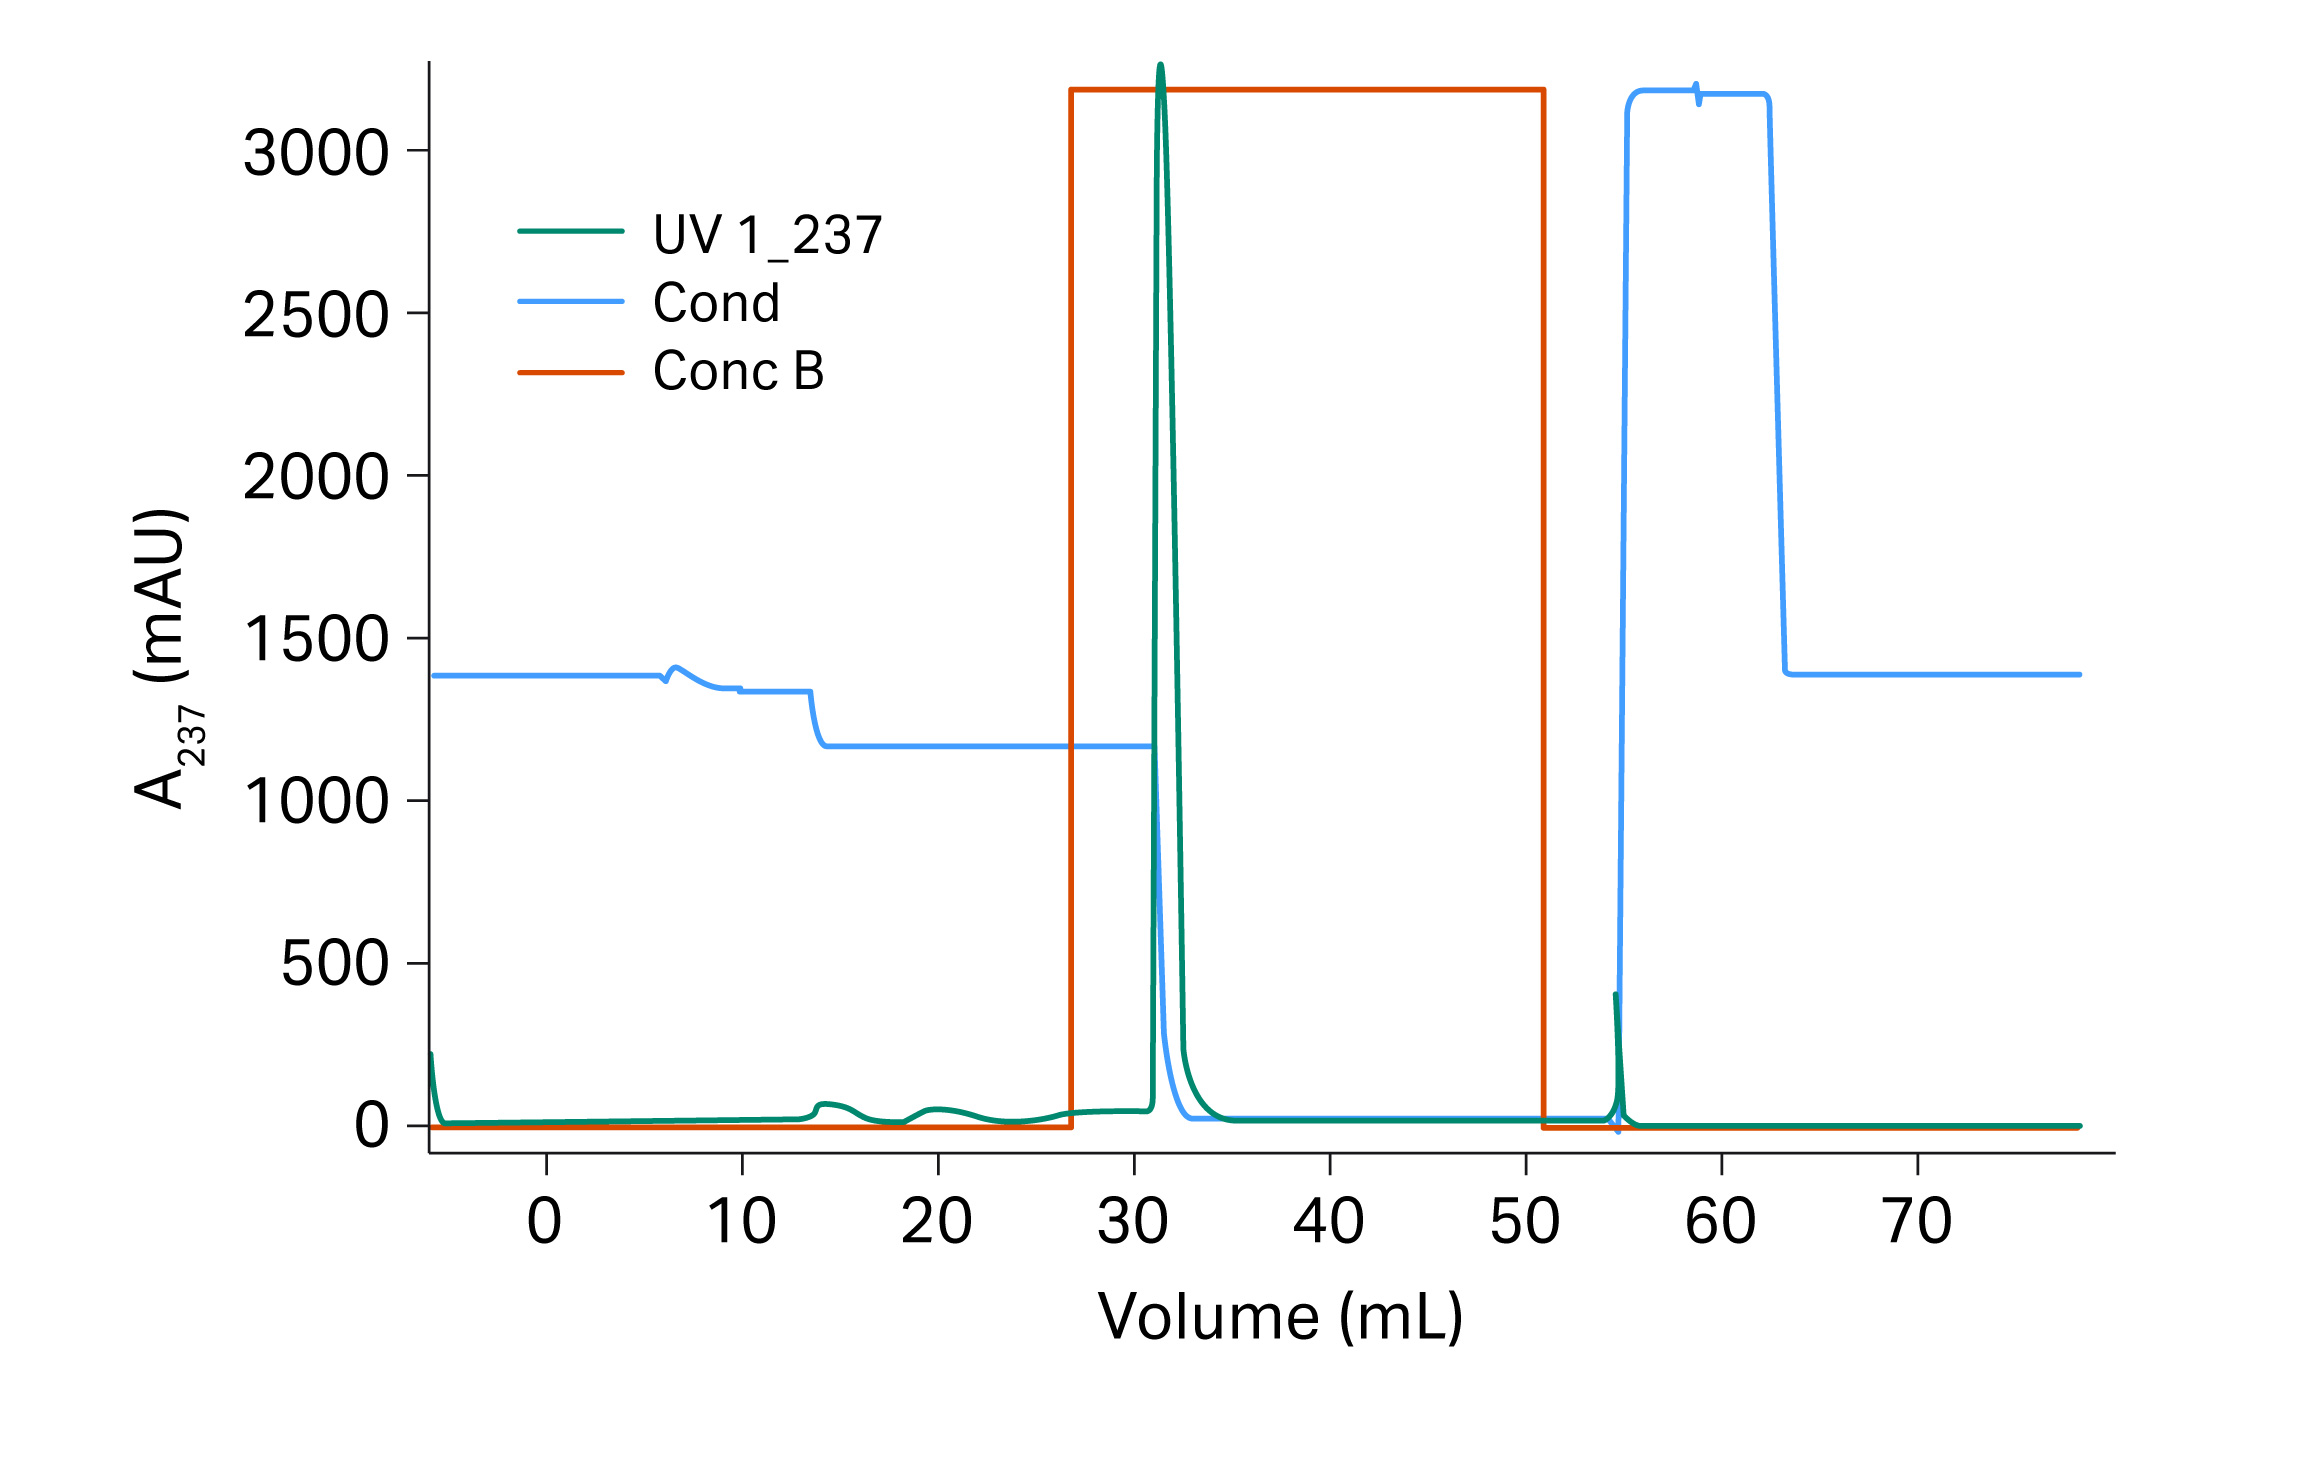
Fig 12. Verification runs for recombinant protein on Capto™ Butyl ImpRes.
Results
The monomer yield was 98% and the fragment content in the eluate was 6.0% for the verification run. Impurities were reduced up to 2.5 times compared to the start sample which contained 14.9% fragments. The results are also presented in Table 5 where it is shown that the outcome was in good agreement with the expected results from the Monte Carlo simulation.
Table 5. Expected outcome compared to the result of the verification experiment
| Expected from Monte Carlo simulation | Experimental result | |
| Yield (%) | 96 (91 to 101) | 98 |
| Remaining LMW impurity (%) | 6.0 | 6.0 |
Conclusions
We have shown the workflow for optimizing the conditions in an intermediate purification step for a recombinant protein using a HIC resin. The goal was to achieve a high yield of target molecule with a significant increase in purity, in this case by reduction of the LMW fragment content.
For this study the binding capacity of three resins, Capto™ Butyl ImpRes, Capto™ Phenyl ImpRes, and Capto™ Phenyl (High Sub), were analyzed using plate studies. Capto™ Butyl ImpRes was chosen for the column study due to its high binding capacity and potential for good yield at the elution conditions identified.
A DoE was performed to optimize the wash step and other chromatographic parameters to improve the recombinant protein purity, and the results from the DoE were confirmed in a verification run using Tricorn™ 5/100 column. A Monte Carlo simulation was then performed to identify robust conditions to reach the intended yield and purity. A verification run at the identified conditions was performed and achieved the expected results, that is, a reduction of fragments from 15% to 6% with a monomer yield of 98%.
From the results of our analysis, we found it would be beneficial to add a polishing step to further reduce impurities, including other impurities not studied here. The choice for the polishing step should be of orthogonal character; in this case, anion exchange chromatography may be used.
Additionally, another tool that can be used to save time and create more robustness processes is mechanistic modeling. Mechanistic models use computer simulations to decrease the number of experiments.
CY27574-27Oct22-AN
TR29795027
Related links
- HIC resource center
- HTPD resource center
- Overview of Cytiva resins
- HIC resins
- HIC prepacked columns
- Design of experiments