Oncolytic viruses including adenovirus
Oncolytic viruses constitute a promising therapeutic approach for treatment of cancer. These viruses selectively replicate in tumor cells and effectively kill these cells without harming normal cells. Selectively engineered, the virus not only destructs the target tumor cell, but also stimulates the host’s anti-tumor immune response.
Adenovirus is an extensively characterized and well-studied viral vector that infects both dividing and nondividing cells without the risk of integration into the host genome. Also, generally causing a mild nature of disease, adenoviruses are commonly used as delivery vectors for gene therapy applications. Recently, oncolytic adenovirus has been applied successfully as cancer immunotherapies or tumor vaccines. As one of the most studied vectors for experimental and clinical use, adenovirus serotype 5 (AdV5) is a suitable system for development of a process for oncolytic adenovirus production.
Summary of upstream and downstream processing
Human lung carcinoma cells (A549) are commonly used to produce recombinant adenovirus for human gene therapy, including oncolytic adenovirus. A549 cells are traditionally propagated in adherent culture with serum-containing medium. Because scaling up of anchorage-dependent cells can be a challenge, suspension cell cultures are therefore preferred as these are more easily scaled. However, adaptation of suspension cells can be time-consuming and difficult and might affect virus titer negatively, making alternative solutions more feasible for laboratory- and clinical-scale production.
One attractive alternative for scale-up of adherent cells is the use of microcarriers.
Previous work has demonstrated adenovirus production in HEK293 suspension cells using the ReadyToProcess WAVE 25 bioreactor system (1–4). In this work, performed by iBET, Oeiras, PT, anchorage-dependent A549 cells were grown in serum-containing medium using HYPERFlask™ cell culture vessels, and thereafter in suspension for production of oncolytic adenovirus in serum-free medium using the ReadyToProcess WAVE 25 bioreactor system.
In the harvest step, 0.5% Tween™ 20 was used for cell lysis to release adenovirus from the host cell instead of the commonly used Triton™ X-100, now on the authorization list (Annex XIV) of registration, evaluation, authorization, and restriction of chemicals (REACH) (5). For adenovirus purification, normal flow filtration (NFF) was used for clarification and tangential flow filtration (TFF) was used for concentration and buffer exchange.
Purification was continued via column chromatography. Two anion exchange (AEX) resins were evaluated for the capture step. Following a second concentration step, polishing was conducted by size exclusion chromatography (SEC) before sterile filtration of the final bulk product. An overview of the process is given in Figure 1.
For detailed materials and methods, click the + sign on the bottom of the article.
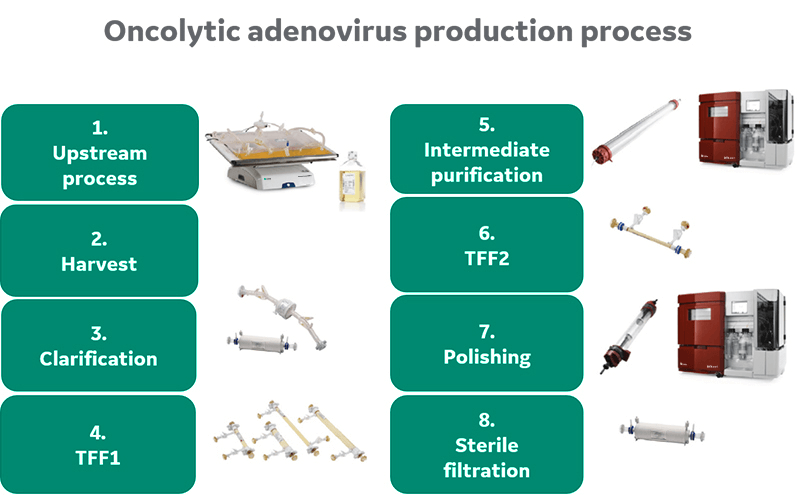
Fig 1. Process overview.
Results and discussion
Upstream process
After stepwise evaluation on individual process steps for oncolytic AdV5 production and purification, the complete process was performed. Adherent A549 cell expansion was conducted in HYPERFlask vessels using Ham´s F12 medium, Kaighn´s modification supplemented with 10% FBS. Harvested cells were centrifuged to remove serum, resuspended in complete CDM4HEK293 medium, and inoculated (0.54 × 10 6 cells/mL) in the Cellbag culture vessel at 5 L working volume (Fig 2).
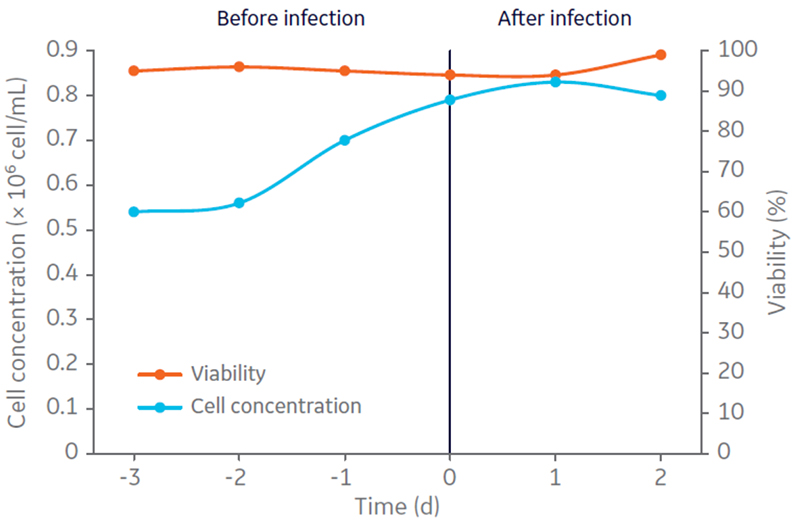
Fig 2. A549 cell concentration (× 106 cells/mL) and viability (%) in 5 L CDM4HEK293 medium, determined in bioreactor culture before and after infection for production of oncolytic adenovirus in suspension culture.
Three days post-inoculation, when grown to 0.8 × 10⁶cells/mL in suspension, the cells were infected with oncolytic AdV5 at multiplicity of infection (MOI) 10. The culture was harvested by addition of Tween 20 to a concentration of 0.5% in 10 mM Tris, pH 8 to lyse the cells, 100 U/mL of Benzonase™ for DNA fragmentation. The culture was then incubated for 4 h at 37ºC. Volumetric productivities of infectious virus particles (IP) and viral genomes (VG) were assessed by TCID50 and determined to be 1.17 × 10¹⁰ IP/mL and 1.12 × 10¹¹ VG/mL, respectively (Fig 3). The VG/IP ratio after harvest was calculated to be 9.5.
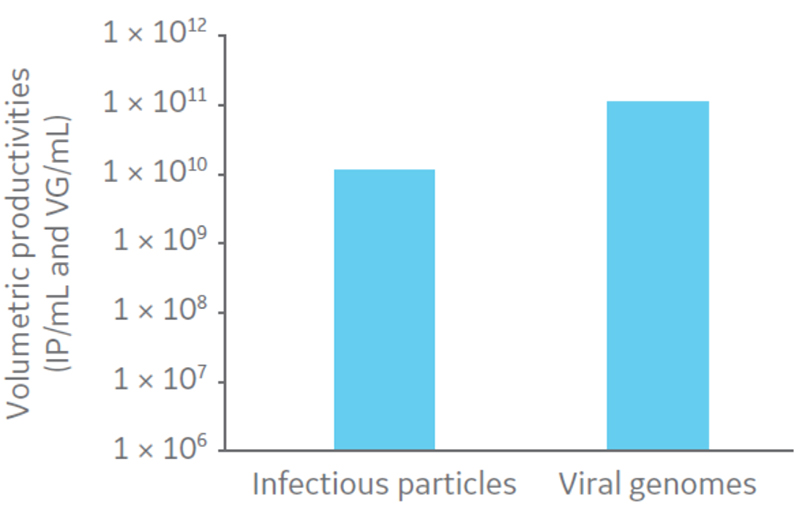
Fig 3. Volumetric productivities of infectious virus particles (IP) and viral genomes (VG).
Downstream processing
Clarification filters were evaluated in two steps, with initial trials performed with 1 L bioreactor harvest and scale-up with 5 L bioreactor harvest (Table 1).
Table 1. Total protein, total DNA, turbidity reduction, and total virus recovery (%) before and after each clarification step with 2 μm GF and 0.2 μm CG (trials) and 5 μm and 0.2 μm CG (scale up) filters
| Sample | Turbidity | Protein | DNA | Viral particles | |
| Removal (%) | Recovery (%) | ||||
| Trials | Initial | – | – | – | – |
| 2.0 µm GF | 80 | 25 | 47 | 95 | |
| 0.2 µm CG | 61 | 7 | 35 | 93 | |
| Scale up | Initial | – | – | – | 9 |
| 5.0 µm GF | 65 | 5 | 7 | 90 | |
| 0.2 µm CG | 78 | 6 | 32 | 92 | |
The two filters, 5 μm GF followed by 0.2 μm SG, and resulted in removal of cell debris and initial reduction of proteins and DNA with high virus recovery, showing no substantial reduction in total virus particles/mL (vp/mL). The turbidity level was also substantially reduced.
Ultrafiltration/diafiltration (UF/DF) was evaluated on hollow fiber filters with three different membrane NMWCs of Mr 300 000, 500 000, and 750 000 according to Table 2.
Table 2. Characteristics and conditions for evaluation of hollow fiber filters
| Hollow fiber | Area (cm2) | ID (mm) | Feed flow (mL/min) | Feed vol. (mL) | Particles (VG/mL) | TMP (bar) |
| 750-C | 26 | 0.5 | 30 | 200 | 1.43 × 10⁹ | 1 |
| 500-C | 26 | 0.5 | 50 | 250 | 1.43 × 10⁹ | 1 |
| 300-C | 50 | 0.5 | 30 | 347 | 1.43 × 10⁹ | 1 |
VG is viral genomes
Samples were concentrated 4 times and diafiltrated 5 times. Results suggest that DNA and protein removal in all the hollow fiber filters converges to the same removal percentage (Fig 4). Moreover, maximum impurity removal was achieved sooner with Mr 750 000, which can be justified by the larger pore size that facilitates impurity permeation.
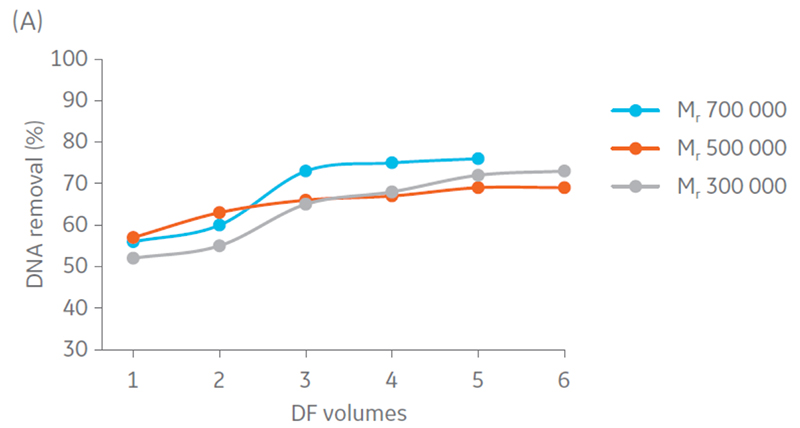
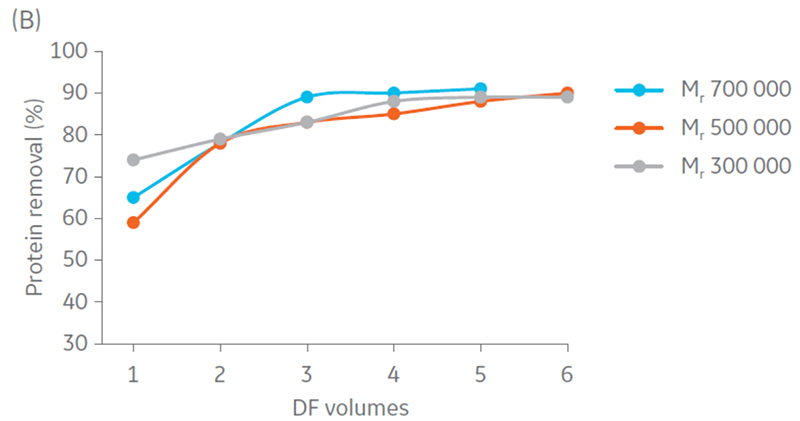
Fig 4. Removal of A) DNA and B) protein content in the retentate in each step of UF/DF using hollow fiber filters with NMWC of Mr 300 000, 500 000, and 750 000.
Total particle comparison between the different hollow fiber filters displayed highest recovery with Mr 500 000 and 750 000 (Fig 5). Considering impurity removal and virus recovery, the Mr 750 000 filter presented the best performance of the filters evaluated and was therefore selected for process evaluation.
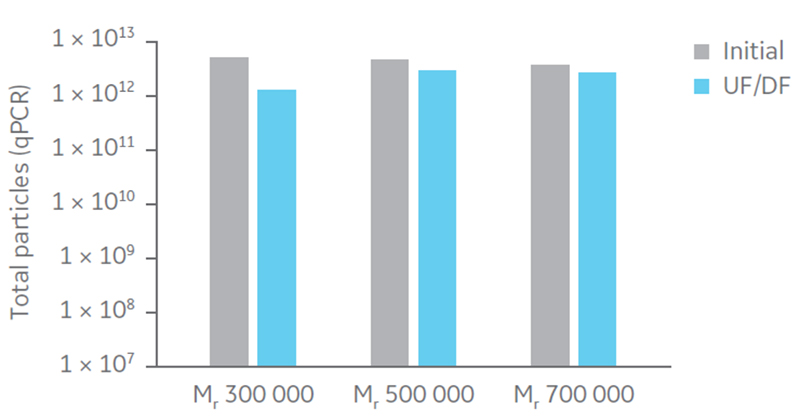
Fig 5. Total particles (qPCR) for UF/DF using hollow fiber filters with NMWC of Mr 300 000, 500 000, and 750 000.
Traditional intermediate purification protocols commonly use AEX column chromatography. Two resins, Capto Q and Capto Q ImpRes, were evaluated. Capto Q ImpRes showed 3.6 times higher dynamic binding capacity (DBC) and higher virus recovery at similar impurity removal (Table 3).
Table 3. Capacity screening for two different chromatographic resins in terms of DBC at 10% (QB10) breakthrough (vp/mL), virus recovery, and protein/DNA removal percentage (%) after an elution step with 2 M NaCl at a flow velocity of 300 cm/h
| Chromatographic resin | Column volume (mL) | QB10 (TP/mL) | 2 M NaCl elution, recovery (%) | Total protein and DNA removal (%) |
| Capto Q | 4.7 | 1.7 × 10¹¹ | 74 | 94/95 |
| Capto Q ImpRes | 4.7 | 6.2 × 10¹¹ | 85 | 90/90 |
TP is total particles
The higher DBC seen with the Capto Q ImpRes resin can be explained by the smaller bead size, offering a larger surface area for virus binding. Capto Q ImpRes was therefore selected for the capture step.
The removal of host cell DNA is facilitated by fragmentation using nuclease treatment (Benzonase). Shorter DNA fragments will be removed in the permeate of the UF step. Remaining DNA is removed in the wash fractions of the AEX step, because shorter fragments bind less strong and elute at lower salt concentration than longer DNA fragments do. Any remaining long DNA fragments after the nuclease treatment can be removed in the final SEC polishing step.
Sepharose Fast Flow 4 was used for the polishing step. Sepharose Fast Flow allows users to inject between 0.1 to 0.3 CV of sample to optimize removal of remaining impurities. Different ratios of sample volume (SV) to CV were evaluated for the polishing step (Fig 6).
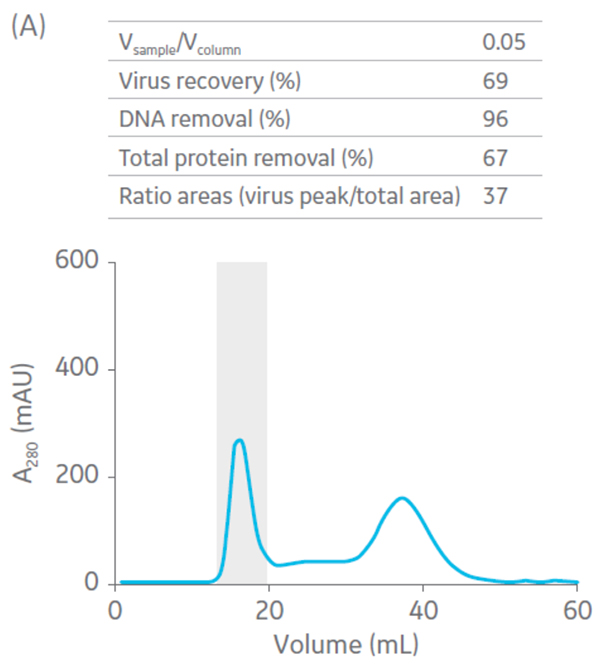
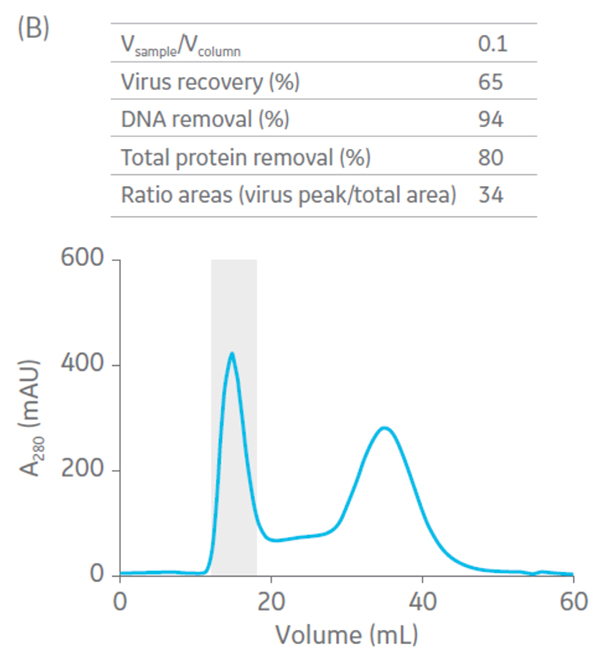
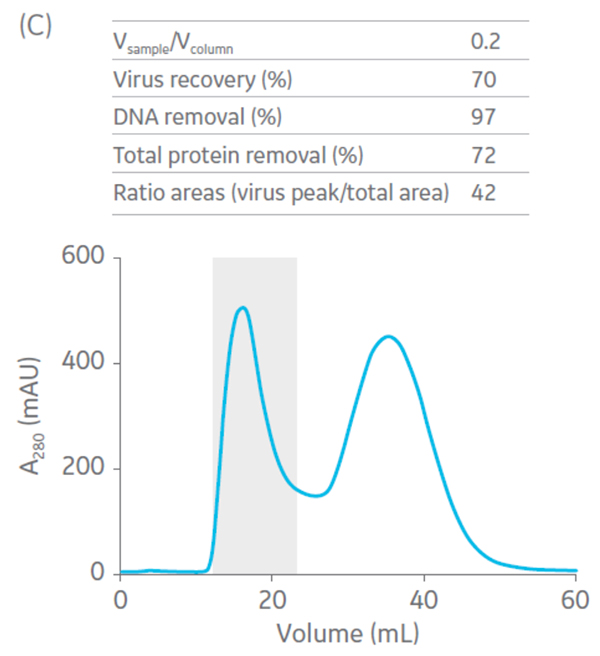
Fig 6. Summary of virus recovery and impurity removal by SEC on Sepharose 4 Fast Flow using SV-to-CV ratios of (A) 0.05, (B) 0.1, and (C) 0.2. The shadowed area represents the collected fractions. The recovery and impurity removal results are presented in the table on top of each chromatogram.
As an alternative for the polishing step, Capto Core 700, with the advantage of a 100- to 300-fold higher load capacity, can be used instead of SEC (4) provided that the majority of longer DNA fragments has been removed in the prior steps. Longer DNA fragments may not be efficiently reduced by Capto Core 700 due to the cut-off of this resin.
Upstream and downstream process runs
Two complete processes of 2 L oncolytic adenovirus production, from a 5 L bioreactor culture were used for process verification. First, the 2 L productions were harvested by adding Tween 20 to a concentration 0.5% (v/v), using a stock solution containing 5% Tween 20 in 10 mM Tris, pH 8 and 100 U/mL of Benzonase, to the bulk previously diluted in 50 mL of medium and incubated for 4 h at 37°C.
The downstream process steps were conducted as described in Table 4. Product recovery for all steps of the process was assessed by quantification of viral genomes (VG) by qPCR, and infectious particles (IP) by TCID50 assay. Removal of dsDNA, total protein, and HCP throughout the process was also evaluated, as was the residual Benzonase concentration in the final sample.
Table 4. Materials used in each step of the downstream process train
| Step | Material | Parameters/conditions |
| Clarification | ULTA 5 μm GF 6 inch ULTA 0.2 μm CG 4 inch | 600 L/m2/h |
| Concentration and buffer exchange TFF1 | Hollow fiber 750-C | 2× UF/4× DF 50 mM Hepes, pH 6.5 + 150 mM NaCl |
| Intermediate purification | 200 mL Capto Q ImpRes in HiScale 50/20 | Flow velocity: 300 cm/h Load: 1.5 × 10¹¹ vp/mL resin Equilibration: 50 mM Hepes, pH 6.5 + 150 mM NaCl Step elution: 50 mM Hepes, pH 6.5 + 1 M NaCl followed by dilution 1:4 with 20 mM Tris, pH 8 + 25 mM NaCl |
| Concentration and buffer exchange TFF2 | Hollow fiber 300-C | 9× UF/2× DF 20 mM Tris, pH 8 + 25 mM NaCl |
| Polishing | 300 mL Sepharose 4 Fast Flow in XK50/60 | 0.2 CV load, 20 mM Tris, pH 8 + 25 mM NaCl, flow rate 4 mL/min |
| Formulation | Addition of glycerol to final conc. of 2.5% | 20 mM Tris, pH 8 + 25 mM NaCl, 2.5 glycerol |
| Sterile filtration | ULTA 0.2 μm CG 47 cm2 disc | 600 L/m2/h |
The VG and IP recoveries are listed in Table 5. The recovery of each step in the process will affect the overall process recovery, and optimization of each step is therefore important. Average overall recovery was 52% and 61% for VG and IP, respectively.
Table 5. Average recoveries (%) for all process steps for two separate runs
| Sample | Viral genome (VG) particles | Infectious particles (IP) |
| Recovery (%) | Recovery (%) | |
| Harvest | – | – |
| Clarification | 96.5 | 98 |
| UF1 | 93.5 | 93.5 |
| AEX | 82 | 86.5 |
| UF2 | 95.5 | 92.5 |
| SEC | 62 | 72.5 |
| Final | 100 | 100 |
| Total | 52 | 61 |
However, overall recoveries varied, ranging from 34% to 70% in the two successful proof-of-concept runs. The lower recovery in the first run can be explained by the difference of almost 1 log in virus concentration throughout the process. This might indicate that the process favors higher virus concentrations (~ 1011). Average impurity removal, total protein, dsDNA, and HCP for both runs are shown in Table 6.
Table 6. Average total protein, dsDNA, and HCP removal (%) for each process steps for two separate runs
| Total protein | dsDNA | HCP | |
| Removal (%) | Recovery (%) | Recovery (%) | |
| Harvest | – | – | – |
| Clarification | 13.5 | 29.5 | 36 |
| UF1 | 81 | 49 | 36.5 |
| AEX | 69.5 | 37.5 | 94.5 |
| UF2 | 40.5 | 46 | 17.5 |
| SEC | 83.5 | 68 | 99.5 |
| Final | 17.5 | 16.5 | 34.5 |
| Total | 99.52 | 97.05 | 99.99 |
In the first run, more that 99% of all impurities were removed. As expected, DNA was the most difficult impurity to remove. In the second run, only 94.5% of the dsDNA was removed. This might be due to the presence of higher concentration of virus in the sample. Because the virus can form virus-DNA complexes, the amount of Benzonase added in the beginning of the process might not have been enough to break such complexes and the DNA removal thus less effective throughout the process.
The VG/IP ratio was similar in the final sample as obtained after harvest, which suggests that the process steps did not affect infectivity of the virus negatively. The purity of the final samples meets the regulatory requirements (Table 7).
Table 7. Summary of average impurities and virus particles observed in the final samples of the two runs and the purity targets requested for the sterile filtered bulk
| Purity results | Purity target | |
| DNA (ng/dose*) | 2.5 | 10 |
| HCP (µg/mL) | 2.8 | 1–100 |
| Benzonase (ng/mL) | BDL** | < 5 |
| Viral genomes qPCR (VG/mL) | 8.2 × 10¹¹ | – |
| Infectious particles TCID50 | 1.3 × 10¹¹ | – |
| (IP/mL) | ||
| Ratio TP/IP | 6.3 | < 30 |
* Dose 1 × 10¹⁰, ** below detection limit (BDL), TP is total particles
Conclusion
The described oncolytic AdV5 production process ranges from cell expansion to purified virus bulk product. In the upstream process, adherent A549 cells were amplified in serum-containing medium, after which virus was produced in suspension bioreactor cultures using serum-free medium in working volumes ranging from 1 to 5 L. CDM4HEK293 medium was selected to support A549 cell growth and productivity in suspension culture using the single-use ReadyToProcess WAVE 25 rocking bioreactor system. This system was used because it supports a smooth rocking motion that lowers shear force for sensitive cells. The system is also favorable for its simplicity when performing laboratory-scale production cultivations.
Two complete downstream process runs, using Capto Q ImpRes for the capture step and Sepharose 4 Fast Flow for the polishing step, were executed. Both runs confirmed impurity removal of above 94% and virus recovery of up to 70%. It was shown that a higher virus particle concentration in the bulk after harvest favors process recovery. The column chromatography-based downstream process provided high virus purity, with impurity concentrations below target in the final sample for both processes.
Read about other solutions for viral vector production.
Acknowledgment
We thank iBET, Oeiras, Portugal for producing and sharing data and for good collaboration.
References
- Application note: Evaluation of HEK293 cell growth and adenovirus productivity in HyClone CDM4HEK293 medium. Cytiva, 29264715, Edition AA (2017).
- Application note: Adenovirus production in single-use Xcellerex XDR-10 bioreactor system. Cytiva, KA874021017AN (2017).
- Application note: Adenovirus production in single-use ReadyToProcess WAVE 25 bioreactor system. Cytiva, KA879160418AN (2018).
- Application note: Scalable process for adenovirus production. Cytiva, KA877080618AN (2018).
- Application note: Optimization of midstream cell lysis and virus filtration steps in an adenovirus purification process. Cytiva, KA875220218AN (2018).
Ordering information
| Product | Product code | ||||
| ReadyToProcess WAVE 25 rocker | 28988000 | ||||
| ReadyToProcess CBCU full control unit | 29044081 | ||||
| CDM4HEK293 cell culture media | SH30858.02 | ||||
| Cellbag Bioclear 11, 10 L, pHOPT, DOOPT II | CB0010L11-31 | ||||
| Ham’s F12 medium, Kaighn’s modification | SH30526.01 | ||||
| Fetal Bovine Serum | SH30071.03 | ||||
| ULTA Disc GF: 2.0 μm, 47 cm2 | DGF-A-02-470 | ||||
| ULTA Disc CG: 0.2 μm, 47 cm2 | DMP-CG92-470 | ||||
| ULTA Prime GF: 5 μm, capsule 6 inch, 0.19 m2 | KGF-A-0506GG | ||||
| ULTA Prime CG: 0.2 μm, Capsule 4 inch, 0.10 m2 | KMP-CG9204GG | ||||
| Start AXH Ultrafiltration Cartridges | 11000547, 29014304,56410053 | ||||
| Xampler ultrafiltration cartridges | 29011051, 56410151 | ||||
| Capto Q chromatography resin | 17531602 | ||||
| Capto Q ImpRes chromatography resin | 17547002 | ||||
| Sepharose 4 Fast Flow chromatography resin | 17014901 | ||||
| ÄKTA avant 150 chromatography system | 28976337 | ||||
| HiScale empty chromatography column, 50/20 | 28964445 | ||||
| XK empty chromatography columns 16/20 and 50/60 | 28988937, 28988964 | ||||
| TR 29314587 | |||||
Cell expansion and bioreactor culture
A549 cell line (ATCC) was routinely propagated in tissue culture flasks at an inoculum density of 3 × 10³ cells/cm2 using Ham´s F12 medium, Kaighn´s modification supplemented with 10% fetal bovine serum (FBS). Prior to bioreactor cultivation, adherent A549 cells were amplified in HYPERFlask vessels. At approximately 90% confluence, cells were harvested by trypsinization and centrifuged at room temperature to remove serum-containing medium. Cells were resuspended in HyClone CDM4HEK293 medium supplemented with 4 mM L-glutamine for growth in suspension bioreactor culture using the ReadyToProcess WAVE 25 system equipped with a 10 L Cellbag culture vessel. Cells were inoculated at 0.5 × 10⁶ cells/mL in a working volume of 5 L. Samples were taken every 24 h for determination of cell density and viability.
Virus propagation and harvest
The cells were infected with oncolytic AdV5 at a multiplicity of infection (MOI) of 10 at 72 h after inoculation. Cell lysis was performed 48 h post infection by the addition of Triton X-100 to a final concentration of 0.1% (evaluation experiments) or Tween 20 to a final concentration of 0.5% (scale-up experiments). Benzonase was added at 100 U/mL at the initiation of cell lysis for digestion of host cell DNA (hcDNA). Digestion was allowed to proceed for 4 h at 37°C and 16 rpm.
Clarification, concentration, and buffer exchange
Clarification of the harvest material was performed by NFF, using 47 cm2 ULTA filter discs (2 μm GF and 0.2 μm CG) for the trials in 1 L scale and ULTA Prime capsules (5 μm GF 6 inch and 0.2 μm CG 4 inch) for 5 L scale up. These clarifications were performed with fixed pressure of 0.2 bar for 2 μm GF and 0.1 bar for 0.2 μm CG. For the 5 L scaled-up culture, the clarification was performed with constant flow of 600 L/m2/h.
The clarified bulk was thereafter concentrated using hollow fibers with 26 and 50 cm2 area for pore size trials nominal molecular weight cut-off (NMWC) Mr 300 000, Mr 500 000, and Mr 750 000 at a feed flow of 40 mL/min and a constant transmembrane pressure (TMP) of 1 bar. For the 5 L scaled-up culture, 290 cm2 hollow fiber filter with NMWC Mr 750 000 at a feed flow of 300 mL/min and a constant TMP of 1 bar. The bulk was concentrated 2 times and diafiltrated 4 times, with 50 mM HEPES, pH 6.5 + 150 mM NaCl.
Intermediate purification
The intermediate purification step was executed using 120 mL of Capto Q or Capto Q ImpRes resin packed in HiScale 50/20 columns. The column was packed according to manufacturer’s recommendation on compression factor and thereafter qualified by determination of height equivalent to the theoretical plate (HETP) and asymmetry. The column was equilibrated with 50 mM HEPES, pH 6.5 + 150 mM NaCl and loaded with 1.5 × 10¹¹ virus particles (VP)/mL resin. The runs were performed at 300 cm/h. The column was washed with 2 column volumes (CV) of 50 mM HEPES, pH 6.5 + 150 mM NaCl. A one-step elution was performed using 50 mM HEPES, pH 6.5 + 1 M NaCl. The pooled fractions for each run were diluted 1:4 with 20 mM Tris, pH 8 + 25 mM NaCl.
Concentration and polishing
The semi-purified samples were concentrated 9 times using a 290 cm2 hollow fiber filter with an NMWC of Mr 300 000 (UFP-300-C-3X2MA) with a flow of 200 mL/min and a TMP of 1 bar. The samples were diafiltrated 2 times with 20 mM Tris, pH 8 + 25 mM NaCl. For evaluation of loading volumes, an XK16/20 column packed with 34.5 mL Sepharose 4 Fast Flow was used. Obtained samples were thereafter loaded onto 300 mL Sepharose 4 Fast Flow resin packed in an XK50/60 column pre-equilibrated with 20 mM Tris, pH 8 + 25 mM NaCl. The virus-containing fractions were collected, pooled, and formulated by the addition of a stock solution of 20 mM Tris-HCl, pH 8 + 25 mM NaCl + 25% glycerol to a final concentration of 2.5% of glycerol.
Sterile filtration
For the sterile filtration, an ULTA Prime CG disc was used. The membranes were pre-equilibrated with 20 mM Tris-HCl, 25 mM NaCl, 2.5% glycerol, pH 8. The filtration was performed at a flow of 600 L/m2/h.
Analyses
Total protein quantification
Total protein concentration was determined by BCA protein assay kit (23225, Thermo Fisher).
Total DNA quantification
Total DNA was assessed using the Quant-iT™ Picogreen™ dsDNA Assay Kit (P7589, Invitrogen), according to the manufacturer‘s instructions.
A549 host cell protein ELISA
A549 host cell protein (HCP) was measured using an ELISA method (F230, Cygnus Technologies).
Benzonase quantification
To ensure that the endonuclease added in the process was removed, the Benzonase concentration in the final sample was measured using the Benzonase ELISA kit II (1016810001, Merck).
Infectious particle quantification
Oncolytic AdV5 infectious titer was determined by an end-point dilution method (TCID50). In brief, 100 μL A549 cells (0.5 × 10⁶ cells/mL) were seeded in 96-well tissue culture plates and incubated overnight at 37°C in 5% CO2. The next day, the supernatant was replaced by serial dilutions (10-1 to 10-11) of virus. Cytopathic effect on cells was determined 10 days later using inverted microscope and the TCID50 titer determined using Spearman-Karber statistical method.
Viral genome particle quantification
Oncolytic AdV5 quantification of viral genome copies was determined by quantitative real-time polymerase chain reaction (qPCR). Before DNA extraction, samples were treated with 10 U DNase for 30 min at 37°C. The reaction was stopped by addition of 8 mM EDTA and incubation at 75°C for 10 min. Viral copies were thereafter extracted using High Pure Viral Nucleic Acid Kit (11858874001, Roche). The viral genome copies were quantified by qPCR using the LightCycler™ 480 Probe Master (0470749001, Roche) and the LightCycler 480 instrument (Roche).