Sustainability in cryopreservation
Sustainability, re-usability, running costs, and recyclability are some of the key considerations when purchasing laboratory equipment. Carbon emissions throughout the life cycle of a product influence its overall environmental impact. Along with running costs, this is an increasingly important factor to understand and consider for equipment funding submissions and requests.
This study focuses on the running costs and carbon emissions associated with cryopreservation equipment. Specifically, it compares a liquid nitrogen (LN2)-free controlled-rate freezer with a typical liquid nitrogen-based system. Using liquid nitrogen requires additional infrastructure and so brings extra considerations for environmental impact, expenditure, and potentially creates challenges when scaling up cryopreservation.
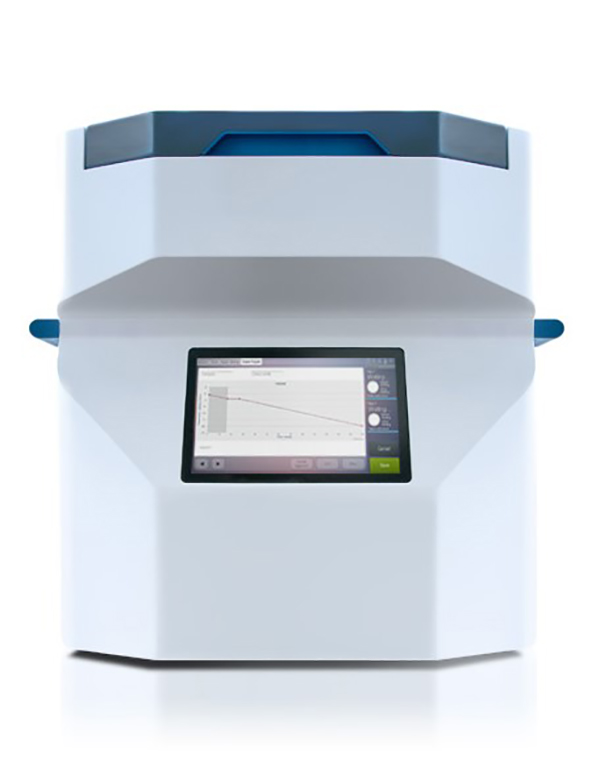
Fig 1. VIA Freeze Quad liquid nitrogen-free controlled rate freezer, part of a range to suit all processing requirements.
By comparison, the VIA Freeze Quad controlled-rate freezer (Fig 1) uses a closed-circuit Stirling engine to remove heat from a sample using only electricity. This approach reduces the cost, carbon footprint, and infrastructure required in a lab for the cryopreservation of cells compared to an LN2-based system. It also enables extremely accurate control of heat removal.
This investigation focuses on the environmental implications of using liquid nitrogen for cell freezing. It compares carbon emissions during the manufacture, transportation, and operation of LN2-free controlled-rate freezers and systems that use liquid nitrogen for cooling. Linked to this, the study also analyzes running costs and electrical consumption.
The results indicate that switching to an LN2-free cryopreservation system, such as the VIA Freeze Quad freezer, could reduce carbon emissions by 87% over 10 years, and decrease operating costs by up to 97%. Being independent of LN2 and the associated infrastructure requirements, these types of freezers also simplify the scale-up of cryopreservation. A laboratory can start with a small system suited to a few samples, and upgrade to higher capacity systems as the need develops.
Carbon cost of cell freezing equipment manufacture and transport
In any new equipment purchase, the carbon cost of manufacture and specifically the carbon emissions of raw materials affect its environmental impact. Bench-top equipment, such as the VIA Freeze controlled-rate freezer range, has an advantage over hard-wired equipment because they do not require any additional lab infrastructure.
In comparison, a freezer system that uses LN2 requires installation and maintenance of insulated piping and storage tanks, which have associated carbon emissions in addition to those released during the manufacture of the freezer itself.
While this study does not account for the carbon footprint of purchasing and maintaining liquid nitrogen tanks, piping, and infrastructure, this too will inevitably add to the total footprint of an LN2-based freezer system.
As a bench-top freezer, the VIA Freeze Quad system also benefits from a smaller physical footprint (63.8 × 61 × 38.3 cm) compared to a liquid nitrogen equivalent, which requires space not only for the freezer, but also LN2 pressurized tanks, air-exchange infrastructure, and LN2 piping. In terms of carbon, component manufacture for a VIA Freeze Quad system costs only 370 kg of CO2 equivalent (Fig 2), which is approximately the same as the cost of a single, one-way flight from Chicago to Los Angeles (1).
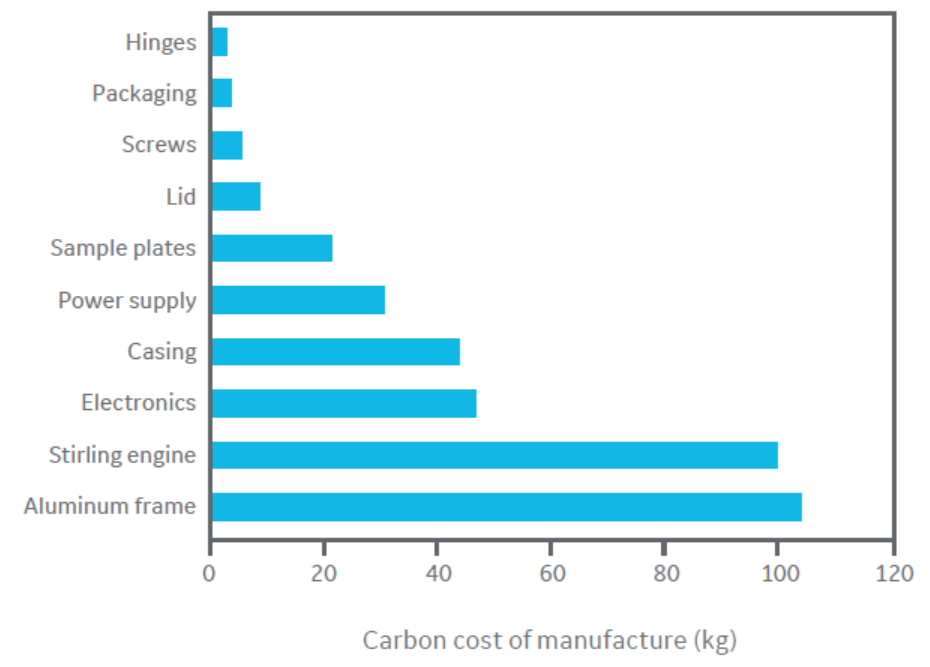
Fig 2. Carbon cost of manufacture of a VIA Freeze Quad controlled-rate freezer per component.
The VIA Freeze Quad controlled-rate freezer has a mass of 72 kg when packaged, meaning that its transport to the end user will have a certain carbon impact. Its mass is approximately the same as an average adult but requires less space, meaning its transportation generally has a lesser carbon impact than a person traveling the same distance. In the case of the VIA Freeze range of freezers, air freight is used for rapid delivery to the customer. Figure 3 shows the average collated carbon emissions for delivery from the VIA Freeze freezer manufacturing site in Cambridge, UK to selected regions.
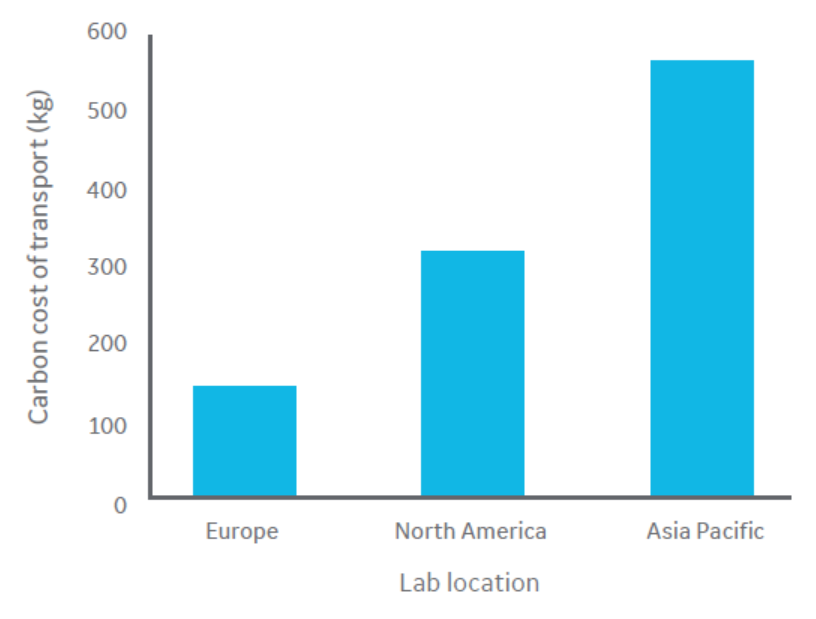
Fig 3. Average carbon cost of air shipment of a VIA Freeze Quad controlled-rate freezer per region.
Operating controlled-rate freezers and their carbon footprint
It is the operation of a controlled-rate freezer that causes the greatest contribution to greenhouse gas emissions. Electricity is required to operate all types of systems, and LN2-based controlled-rate freezers have the additional need for nitrogen coolant, both of which have a carbon footprint.
The impact of electricity source
The carbon emissions of electricity vary depending on its source. This study uses an average of 180 g of CO2 per kWh of electricity, which was the average value for electricity generated in the UK in 2018 (2).
As more renewable energy schemes come into operation, the carbon intensity of electricity is falling in most countries, with a 33% reduction in the UK between 2013–2018 (2). Continuing reductions in intensity will further reduce the carbon footprint of the VIA Freeze range of LN2-free controlled-rate freezers.
The additional cost of using liquid nitrogen
The carbon footprint of liquid nitrogen comes from its physical manufacture, through compression and fractional distillation of air, and from its transportation to an end-user site.
This study took the energy intensity of liquid nitrogen production as 0.549 kWh/kg, equating to 79 g CO2 per liter of liquid nitrogen (3). Transportation adds approximately 130 g CO2 per liter, assuming an average 300-mile transport distance between production and user sites. This distance will vary depending on site location and the number of deliveries on-route.
Liquid nitrogen use is also associated with a large amount of waste. When needed, LN2 is either pumped using vacuum‑jacketed piping directly into the controlled-rate freezer or transferred into a dewar storage tank before adding to the freezer.
If the liquid nitrogen is transferred through piping, a large amount is initially burned off to cool the piping before the liquid nitrogen can be transferred. Similarly, large amounts of liquid nitrogen also boil off during the transfer into and out of a storage tank and can be lost due to evaporation during storage.
This wasted liquid nitrogen has an associated cost, in terms of both spend and carbon.
Calculating the annual carbon costs for controlled-rate freezers
To calculate the annual carbon cost of running either a VIA Freeze Quad controlled-rate freezer or an LN2-based system, there are some assumptions required regarding average usage: one run per day, 250 days per year, each taking two hours. These runs are also assumed to have an average power consumption of 350 W.
For average CO2 production, the calculation uses 180 g/kWh of electricity and 209 g/L liquid nitrogen produced and transported to the site.
Use of LN2 is assumed to be 17.5 L per cooling run, divided into 7 L for cooling, and 10.5 L for LN2 evaporation during storage and in piping.
Average prices of $0.20 per kWh of power and $0.28 per liter of liquid nitrogen are used. This cost is typical for a center that purchases bulk quantities of liquid nitrogen, exceeding 1000 L per month.
LN2-free cryopreservation reduces carbon emissions and decreases running costs
Using this model, an LN2-based controlled-rate freezer would have an annual power consumption of 175 kWh while the value for the VIA Freeze Quad controlled-rate freezer would be 250 kWh due to a higher power consumption per run. This equates to a carbon cost per year of approximately 31 kg for an LN2-based freezer and 45 kg for a VIA Freeze Quad freezer.
While the electrical cost of a liquid nitrogen system is lower than that of the VIA Freeze Quad freezer, the additional cost for liquid nitrogen supply increases this value considerably such that the total annual carbon cost of operating an LN2-based freezer system is over 945 kg (Fig 4). As a comparison, the average daily carbon emission of a US citizen is 45 kg (4).
These calculations, therefore, indicate that switching to an LN2-free VIA Freeze Quad system could reduce carbon emissions by 87%.
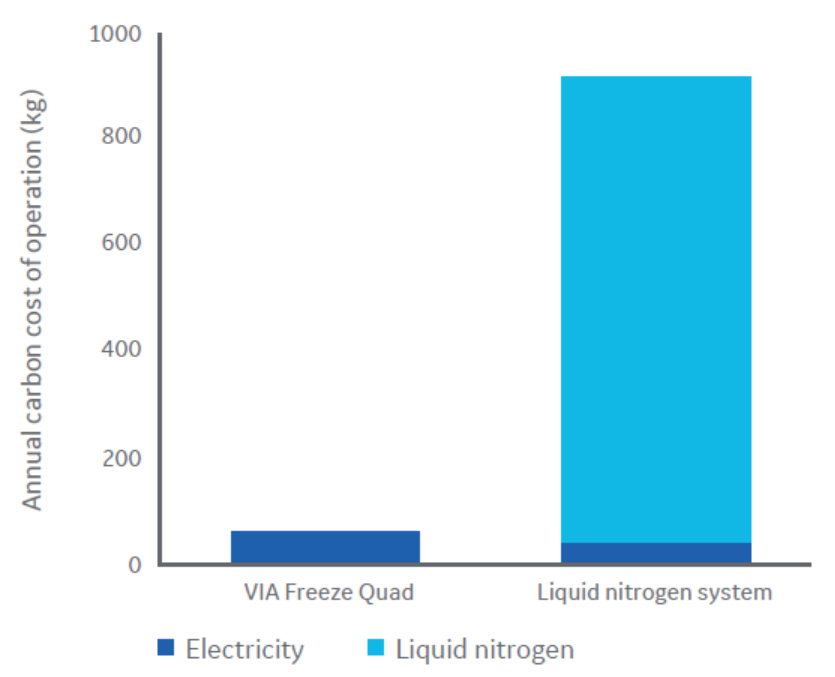
Fig 4. Carbon cost of operating a VIA Freeze Quad controlled-rate freezer and an LN2-based freezer system, assuming 250 cryopreservation cycles per year.
In addition, the average running cost for a VIA Freeze Quad freezer is 97% lower than for an LN2-based system over a 10-yr period. This is primarily due to savings on liquid nitrogen, which has a much larger impact on both carbon and financial costs compared with electricity.
This comparative reduction in running costs for the LN2-free solution is ongoing throughout the lifecycle of such a controlled-rate freezer and so has a cumulative effect (Fig 5). It enables valuable funds to be made available for other purposes and keeps the cost per cryogenic cycle almost negligible.
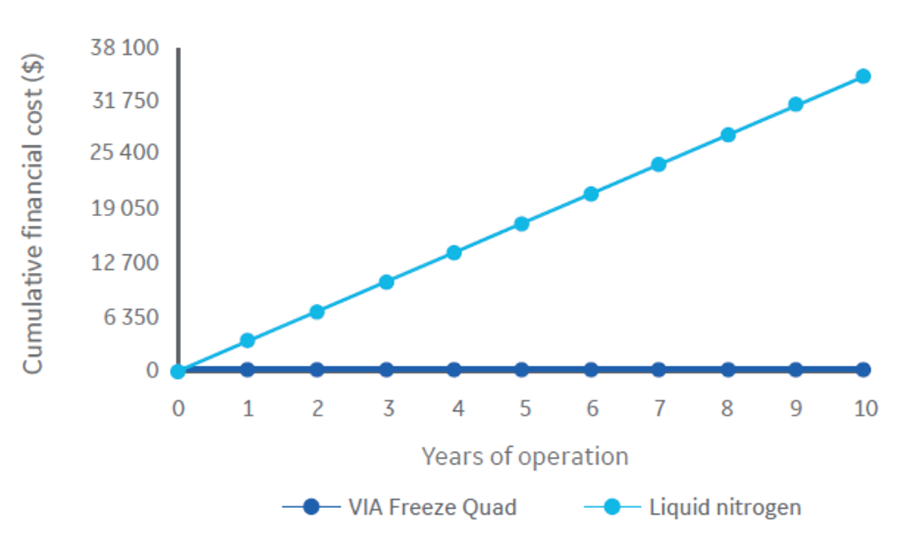
Fig 5. Cumulative operating costs for a VIA Freeze Quad controlled-rate freezer and a liquid nitrogen system over 10 years, assuming 250 cryopreservation cycles per year. Converted from GB pounds sterling at an exchange rate of 1.27 US dollars/pound.
Conclusions
This study demonstrates that the use of an LN2-free controlled-rate freezer will not only reduce financial costs for an organization, it will also reduce a cryopreservation center’s carbon footprint. The carbon cost of manufacture and delivery of a VIA Freeze Quad freezer will be offset in less than seven months, assuming one run per day for 250 days per year. The cost of operation can be reduced by 97% over 10 years compared to an LN2-based system, with carbon footprint falling by 87% over the same period. More frequent use will result in faster and more rapid savings.
As well as carbon footprint and running costs, using an LN2- free controlled rate freezer has benefits for a cryopreservation laboratory in terms of consistency. The VIA Freeze Quad system uses a conduction cooling process that pulls heat from the cryochamber evenly, making sure that all samples freeze at the same rate. In contrast, an LN2-based system blows liquid nitrogen vapor over samples, resulting in the samples closest to the vapor source being frozen faster than those at the far side of the chamber. The consistency of the VIA Freeze range of freezers is demonstrated in an independent study on cord blood cryopreservation.
This study was performed using the VIA Freeze Quad system, which is the largest capacity controlled-rate freezer in the range. The system can freeze large volumes, either in cryopreservation bags or using cryovials to meet high-volume freezing requirements.
Comparable results would be expected for the other LN2-free freezers in the range, VIA Freeze and the VIA Freeze Duo, which are well-suited for other sample formats and volumes. As such, laboratories that do not currently require the capacity of the VIA Freeze Quad can still gain similar benefits over an LN2-based freezer while using a smaller system. This approach also simplifies scale-up of cryopreservation when the need arises, requiring the laboratory to just replace or supplement the LN2-free freezer with a larger model and not be concerned about additional infrastructure.
Find out how cell therapies are influencing developments in cryopreservation.
Explore our solutions for cryogenic cold chain management.
References
- Management Quality and Carbon Performance of Airlines: March 2019, Transition Pathway Initiative. London School of Economics (2019).
- 2018 UK Greenhouse Gas Emissions, HM Government Department for Business, Energy & Industrial Strategy, Committee on Climate Change (2019).
- Indirect CO2 emissions compensation: Benchmark proposal for Air Separation Plants, Position Paper PP33/19, European Industrial Gases Association (EIGA) (2010).
- CO2 emissions (metric tons per capita). The World Bank. (2019).