- This study demonstrates the complex relationship of pH and salt concentration in the buffer and shows factors to consider if improved size exclusion chromatography (SEC) separation is needed.
- Utilizing a design of experiments (DoE) approach provides deeper understanding of how different proteins are affected by undesirable ionic and hydrophobic effects and how these effects may be countered.
Introduction
Size exclusion chromatography should separate proteins only according to their hydrodynamic radius (size). However, the dextran and agarose components of size exclusion chromatography resins contain residual amounts of ionic groups; proteins having the opposite charge to the resin might bind due to ionic interactions while proteins with the same charge as the resin are subjected to ion repulsion and will elute earlier than expected. In fact, ion exchange interactions at low ionic strengths (1) have previously been described when the pH of the mobile phase was lower or higher than the pI values of the proteins. For some proteins, hydrophobic interactions have also been observed at high ionic strengths.
Cross-linking agents used in the manufacture of resins may introduce hydrophobic sites adding to range of modes of interactions between the resin and protein. These undesirable interactions may be decreased by adjusting pH, ionic strength, or through certain additives. Often, proteins and resins possess both ionic and hydrophobic properties and the composition of the mobile phase needs to balance these contrasting effects to achieve required separation.
This study describes the effect of pH and NaCl concentration on retention volume using the DoE approach. DoE allows us to use a minimum number of experiments, in which we systematically vary several experimental parameters simultaneously to obtain enough information. The traditional setup with one-parameter-at a time only covers a limited part of the experimental design space and an optimum or minimum might be missed. In addition, the traditional setup does not take into account the fact that experimental variables can be dependent of each other (interaction).
Here, the effect of buffer conditions was studied on proteins with acidic, basic, and hydrophobic properties on Superdex 200 Increase 10/300 GL prepacked chromatography column.
Experimental
Design of experiments (DoE) setup
To study the retention behavior in SEC, two parameters were varied using DoE:
(1) pH (5.8 to 7.4)
(2) NaCl concentration (50 to 500 mM)
Peak retention volume as percentage of column volume (%CV) was chosen as response. The experimental design used (CCF, central composite face design), included full support for modeling linear interactions and nonlinear (quadratic) retention behavior (Fig 1).
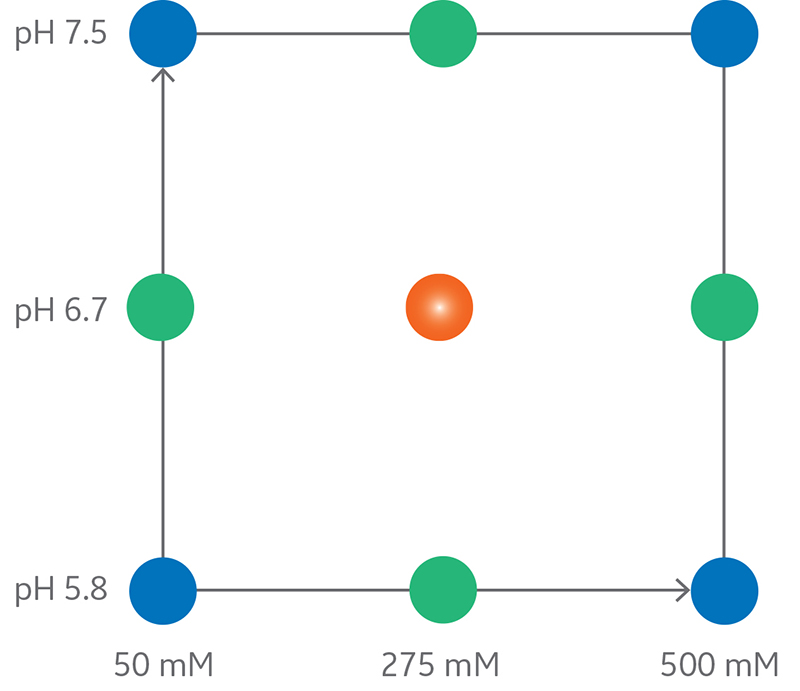
Fig 1. Central composite face design with two factors (pH and NaCl concentration).
The experimental region of a CCF design, where pH and NaCl concentration were varied, included nine experiments in random order plus two replicates of the center point.
The chromatographic conditions used were:
- Column: Superdex 200 Increase 10/300 GL
- Buffers: 20 mM phosphate, 50–500 mM NaCl, pH 5.8–7.5
- Flow rate: 0.75 mL/min
- System: HPLC system
The samples used were standard proteins with varying molecular weight and isoelectric point (pI), see Table 1.
Effect of organic additive
The addition of acetonitrile to the buffer for the separation of lysozyme was also performed to evaluate the postulated suppression of hydrophobic interactions by organic solvents. The same chromatographic conditions as above. The separation in the two buffers below was compared:
Buffers:
(1) 20 mM phosphate, 275 mM NaCl, pH 6.65
(2) 20 mM phosphate, 275 mM NaCl, pH 6.65 + 10% acetonitrile (v/v)
Results
Retention volume of basic and acidic proteins is affected by pH and salt
- Eight proteins were studied using nine different buffer conditions in an experimental DoE setup.
- In Figure 2, chromatograms from all experiments with all proteins, except pepsin, are overlayed. The overlay of the chromatograms showed that the conditions of the buffer affect the retention volume for all proteins.
- Table 1 shows the total shift in retention volume for the different proteins used in the DoE study.
- The largest shift in retention volume was seen for lysozyme, 18%CV, and the smallest effect for ferritin, 1.5%CV.
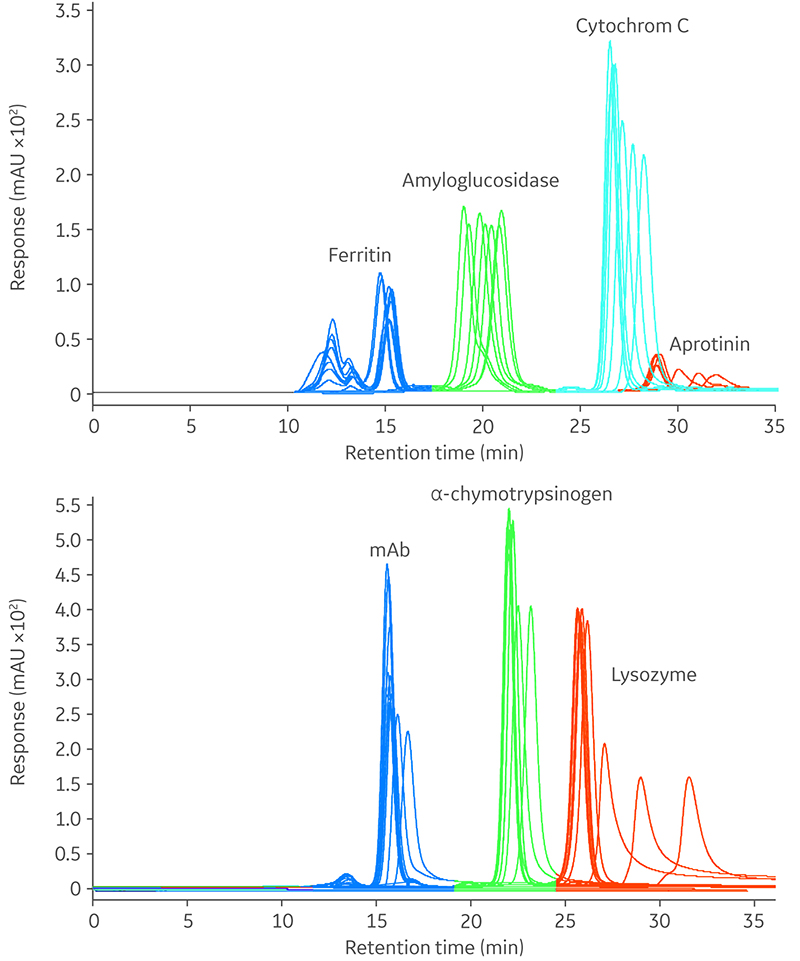
Fig 2. Overlay of chromatograms for nine experiments with varying buffer conditions (pH 5.8–7.4 and NaCl concentration, 50–500 mM). Pepsin data is not shown.
Table 1. Molecular weight, isoelectric point, and sample load of proteins loaded to a Superdex 200 Increase 10/300 GL column in the DoE study. Proteins shaded in gray are basic proteins while those left unshaded are acidic
| Protein | Molecular weight (Mr × 103) |
Isoelectric point (pI) (approx.) |
Load (µg) | Total shift in retention volume (%CV) |
| mAb | 150 | 8.5 | 120 | 3.0 |
| α-Chymotrypsinogen A | 25 | 9.0 | 100 | 3.5 |
| Lysozyme | 14.3 | 11 | 100 | 18 |
| Cytochrome C | 13 | 10 | 90 | 4.0 |
| Aprotinin | 6.5 | 10 | 100 | 8.3 |
| Ferritin | 440 | 5.8 | 9 | 1.5 |
| Amyloglycosidase | 97 | 3.5 | 90 | 5.2 |
| Pepsin | 33 | 2.9 | 100 | 4.0 |
Effect plots visualize the effect of NaCl and pH on protein retention volume
Statistical evaluation of retention volume as %CV resulted in valid models for all proteins. Effect plots (Fig 3) for each protein show the effect and importance (height) of each factor in the model. The performed modeling was assessed for statistical significance. A statistically significant model was obtained for the data (data not shown), that is, evaluation of peak retention as %CV resulted in a valid model with significant model coefficients.
- All analyzed proteins showed effects on SEC retention behavior being affected by both NaCl concentration and pH.
- The exception was pepsin where only NaCl concentration significantly affected retention volume.
- The presence of interactions and nonlinear effects (pH*NaCl and NaCl*NaCl) were identified (Fig 3).
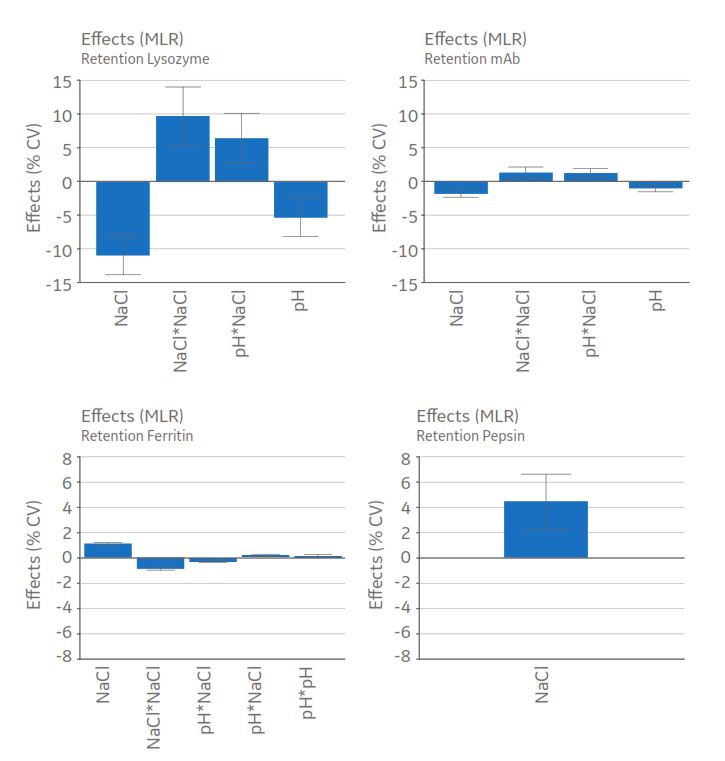
Fig 3. Effect plot of pH and NaCl on the retention volume of lysozyme, mAb, ferritin, and pepsin. Significant effects are those where the confidence interval not include zero (non-significant effects have been removed from the plots). The plots show effect and importance of each model coefficient on the response, %CV, when pH and NaCl are changed from low to high level.
Retention volumes visualized by response contour plots
In response contour plots (Fig 4 and 5), retention volume measured in %CV was predicted for any NaCl concentration between 50 to 500 mM and any pH between 5.8 and 7.5. Each colored area on the plots corresponds to a certain predicted retention volume.
For basic proteins:
- An increase in retention volume was obtained with a decrease in NaCl and pH for the basic proteins, Lysozyme, α-chymotrypsinogen, aprotinin (Fig 4), and cytochrome C (data not shown).
- The mAb showed similar pattern as a basic protein indicating high pI, which is common for therapeutic antibodies.
- At high NaCl concentration, the interactions between resin and oppositely charged proteins was suppressed and the proteins eluted earlier.
- Effect on retention volume for α-chymotrypsinogen (Fig 4B) illustrates the complex relationship between pH and NaCl—the same retention volume can be obtained at very different conditions—at low pH and high NaCl concentration or at high pH and low NaCl concentration.
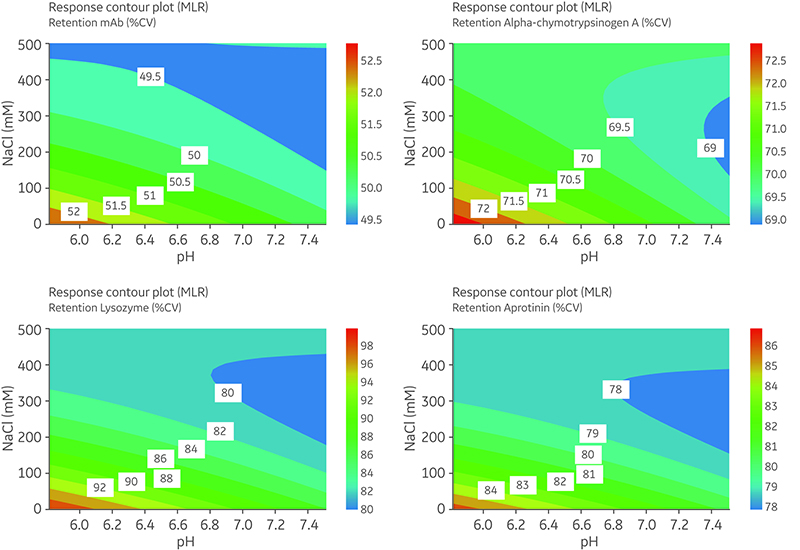
Fig 4. Response contour plots of retention volume (%CV) for basic proteins: mAb (A), α-chymotrypsinogen (B), lysozyme (C), and aprotinin (D). The difference between areas needed to be > two times the relative standard deviation (RSD) to be significant: the 2 × RSD values were mAb 0.557; α-chymotrypsinogen 0.687; lysozyme 2.887; and aprotinin 0.928.
For acidic proteins:
- Ferritin and amyloglucosidase retention volume increased at higher NaCl concentration and lower pH (Fig 5).
- At low NaCl concentration, negatively charged proteins and the negatively charged resin surface result in ion repulsion and exclusion of the proteins from the pores leading to early retention.
- Ion repulsion was suppressed at higher NaCl concentration and the proteins could enter the pores and elute later.
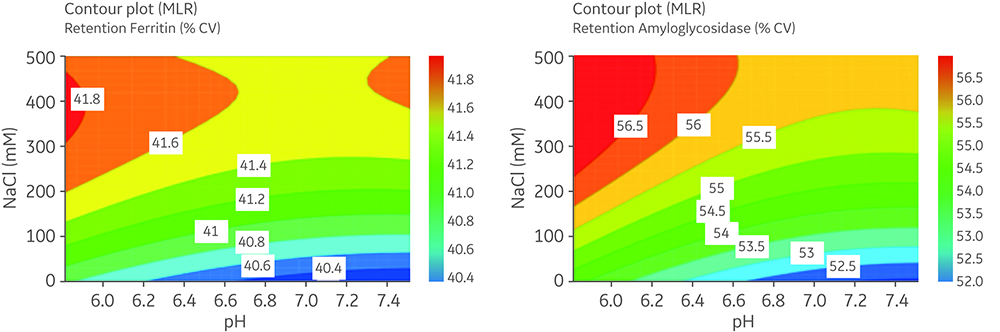
Fig 5. Response contour plots of retention volume (%CV) for acidic proteins: ferritin (A) and amyloglucosidase (B). The difference between areas needs to be > than two times the RSD to be significant : the 2 × RSD values were ferritin 0.115; amyloglucosidase 0.078.
In the response contour plots, (Fig 4 and 5) at high NaCl concentration, pH had low or no effect on retention volume. In the blue area for the basic proteins and the red/yellow area for acidic proteins, the retention volume remained essentially the same. This is the interaction factor (pH*NaCl) in the effect plots, Figure 3.
Buffer additives
When comparing the retention volume for lysozyme (Mr 14 300) and aprotinin (Mr 6500) in Figure 2, lysozyme eluted later than the significantly smaller aprotinin. When the retention volume of the proteins was compared to a standard curve, the deviation from the curve decreased for most proteins when the NaCl concentration increased.
In contrast, lysozyme, α-chymotrypsinogen, and pepsin deviate from the standard curve even at high NaCl concentration, where all ionic interactions should be minimized, see Figure 6. The deviation from the curve could possibly be due to hydrophobic interactions.
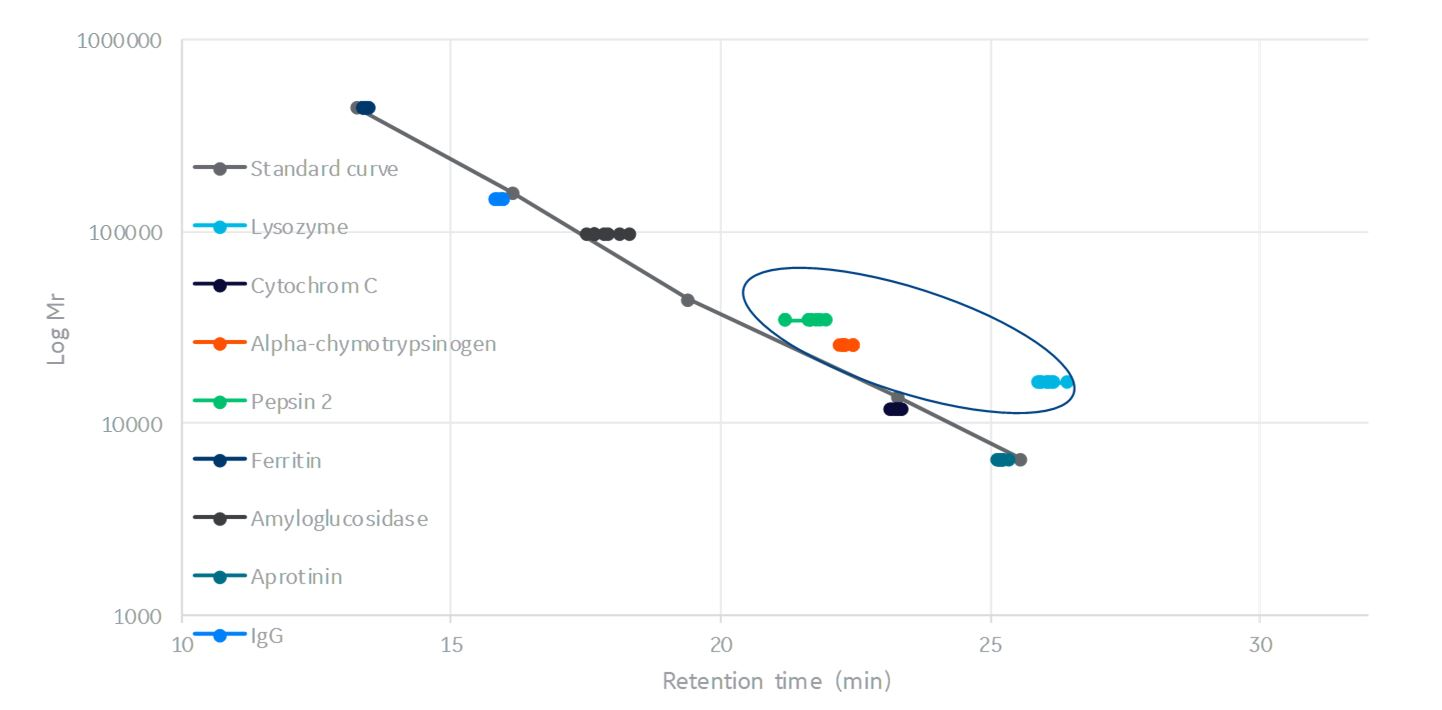
Fig 6. SEC calibration curve with retention volume plotted for studied proteins of all experiments at 275 and 500 mM NaCl concentration (experiments at 50 mM NaCl has have been excluded).
Organic solvents as additive in a buffer are often used to suppress hydrophobic interactions. Acetonitrile (10%) was added to the buffer with 275 mM NaCl and pH 6.65, resulting in a shift to an earlier retention volume for lysozyme, which indicates suppression of hydrophobic interactions (Fig 7). This illustrates that additives in the buffer might be beneficial for the separation and might need to be evaluated.
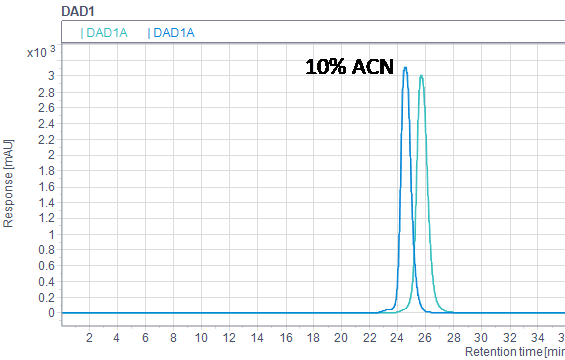
Fig 7. Overlay of lysozyme runs in 20 mM phosphate buffer, 275 mM NaCl, pH 6.65 with and without 10% acetonitrile.
Conclusions
- At 50 mM NaCl concentration, the shift could be significant for some of proteins, e gfor example, lysozyme, while the effect was reduced at increased NaCl concentration.
- Between 50 mM to 500 mM NaCl and pH 5.8 and 7.5, basic proteins with high pI were retained and eluted late at low NaCl concentration. Acidic proteins with low pI experienced ion repulsion from the resin resulting in earlier elution at low NaCl concentration.
- A general rule of thumb would be to use an NaCl concentration of 300 mM to reduce ionic interactions if the relatively high NaCl concentration can be tolerated by the protein.
- The benefits of using a DoE approach to study the complex relationship between pH and NaCl concentration showed interactions and nonlinear behavior.
References
- Janson, J-C., ed. Protein Purification: Principles, High Resolution Methods, and Applications, 3rd edition, Wiley (2011).
Resources
- Join ÄKTA club to stay updated on protein purification
- Size exclusion chromatography handbook
- Design of experiments in protein production and purification handbook
- Select size exclusion chromatography columns
Read more about protein purification methods