Protein quantitation in Western blotting
Western blot data are generally semiquantitative, and analysis often provides relative abundance, not absolute concentration. Quantitative measurement relies on having a detection method with a known relationship between signal intensity and protein concentration across a useful range.
An appropriate detection method is one that supports densitometry—a quantitative method—and provides sufficient accuracy to meet experimental goals.
What is densitometry?
Densitometry determines the optical density of a sample in solution, in-gel, or at a stage following transfer to membrane. The technique uses standalone densitometers, imaging systems, or separate software.
In Western blotting, densitometry quantitates proteins within the linear dynamic range of a chosen detection method. Detection methods include colorimetry and immunoblotting (via chemiluminescence, fluorescence, and radiolabeling).
Software algorithms determine the density of signal across a selected area. This area might be a specific protein band. The software can compare the measured density to a background area, typically adjacent to the target band, to produce a relative measurement.
What factors influence the reliability of densitometry?
The importance of quantitation will vary depending on the specific Western blot experiment. An appropriate detection method affords the level of quantitation required by the experiment. In selecting a detection method, considerations include:
- Sensitivity: Influences the lower limit of detection for low abundance proteins.
- Linear dynamic range: The signal intensity range that is equivalent to protein concentration.
- Signal stability: The ability to detect signal over time.
- Signal-to-noise ratio (SNR): Clarity of signal over any nonspecific background.
High sensitivity provides the ability to detect low-abundance proteins and influences the linear dynamic range. A linear dynamic range that extends from high to low signal intensities supports accurate quantitation across an equally broad range of protein concentrations (Fig 1).
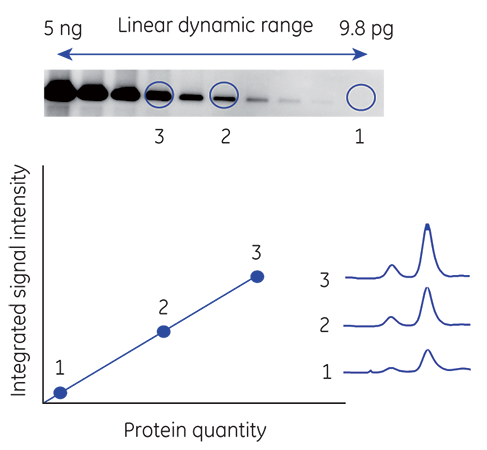
Fig 1. Measuring the linear dynamic range of a CCD camera-based imager.
Fluorescence detection with Amersham ECL Plex gives a broad linear dynamic range, making it possible to detect and compare weak and strong bands on the same blot (Fig 2).

Fig 2. Dilution series of transferrin detected with Cy3-labeled secondary antibodies. The linear dynamic range is 3.6 orders of magnitude and very linear with a limit of detection of 1.2 pg.
Signal stability over time enables repeat exposures and the comparison of gels and membranes prepared at different times (Fig 3). With a stable signal detection reagent, high sensitivity is maintained for, allowing multiple exposures and the possibility to detect weak bands that might be missed in a single, brief exposure.
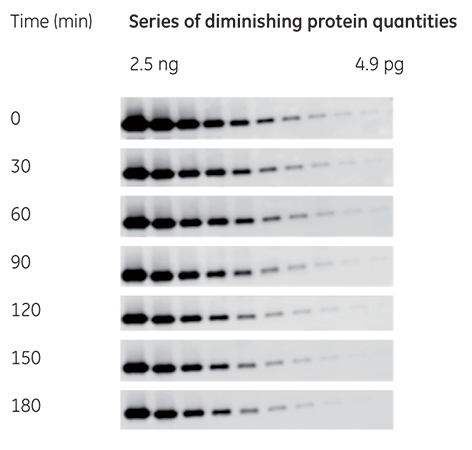
Fig 3. Amersham ECL Prime signal duration was monitored for 3 h. The majority of the bands are still detectable, and allow precise quantitation even after 3 h.
Antibody specificity, membrane material, blocking agent, and detection/imaging system influence the ability to define signal from background. Accurate quantitation relies on a sufficient SNR.
How do different detection methods compare?
Colorimetry-based methods are well suited for qualitative analysis—determining the presence or absence of a protein—particularly from purified samples. However, these methods tend to have a narrow linear dynamic range, limiting their quantitative power.
Examples of common colorimetric methods include the Lowry and Bradford color change assays, and Coomassie™ Blue and Ponceau S total protein stains. Beyond the presence or absence of a protein, densitometry of these methods provides some semiquantitative data to adjust or account for loading respectively.
Compared with colorimetry, immunoblotting methods support broader linear dynamic ranges, though they differ from each other in other key areas. Western blot scannershave advanced imaging systems and software that take advantage of the linear range, providing more accurate quantitation than colorimetry.
See part 2 to find out more about immunoblotting detection methods. For support with imaging and quantitation, download our Imaging and Western blotting principles and methods handbooks.