胎牛血清 (FBS) 仍然用于许多细胞培养应用,包括病毒载体生产。单一来源的 FBS 可能有限,因此确认其他来源的 FBS 合格性是提高安全供货的一种方法。有鉴于此,我们评价了美国、新西兰和澳大利亚的 HyClone 品牌优级 FBS 的多项性能指标。我们发现,所有测定参数的批内和批间差异均较低,表明我们评价的血清具有等效性。
简介
胎牛血清 (FBS) 在学术界和工业界用作大多数贴壁体外细胞培养应用的培养基补充剂。FBS 包含多种不同细胞和细胞系体外生长所需的蛋白、激素和生长因子的复杂混合物。行业趋势从使用含血清的贴壁细胞转变为使用悬浮适应细胞和化学成分确定的细胞培养基,但许多应用仍然需要血清添加剂。这些应用包括用于基因治疗和疫苗的病毒生产。
早期通常选择产地为新西兰的 FBS,这类血清是从闭锁群中获得的。因此,该产地的血清供应有限。为了确保研究、临床和全规模生产的安全供货,需要考虑其他产地的备用货源。但是,这些来源的 FBS 必须满足要求的性能和质量标准。
控制工艺变异性是疗法开发和生产的另一个关键方面。这包括了解和管理特定来源血清的批内和批间变异性。FBS 是乳制品和肉类行业的副产品,可能会存在批间差异。
考虑到所有这些因素,我们评价并比较了源自美国、新西兰和澳大利亚的 HyClone 优级胎牛血清 (FBS) 的细胞培养和生产性能。实验使用贴壁 HEK293T 细胞和补充 10% FBS 的 HyClone DMEM,并检查下列指标:
- 一般形态
- 细胞生长动力学和群体倍增时间
- 活力
- PEI 法腺相关病毒血清型 2 (AAV2) 转染后的转染效率
- PEI 法 AAV2 转染后的病毒生产
研究结果清楚地表明,在补充来自美国、新西兰或澳大利亚的 10% FBS 的 HyClone DMEM 中培养的贴壁 HEK293T 细胞中,对细胞培养动力学、形态、转染效率或病毒生产没有明显影响。此外,评估所包含样本的批内或批间差异时,未发现任何分析参数之间存在差异。
结果和讨论
细胞形态和生长动力学
每个批次选用三个培养瓶和每个原产国三个批次(得到 n = 27 个实验条件)对 HyClone FBS 进行了评价。冻存细胞解冻和传代后,评估了一般形态、细胞生长动力学和群体倍增时间 (PDT)。包括所有 n = 27 个血清条件并在平行 T25 细胞培养瓶中培养。每周监测细胞并传代两次。记录随时间变化的 PDT 和活力。
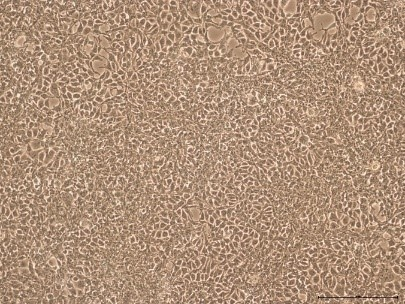
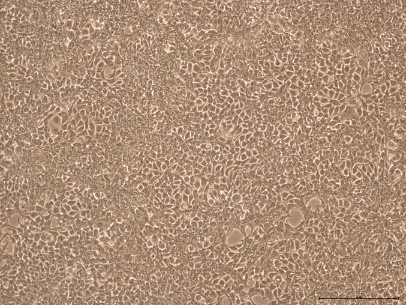
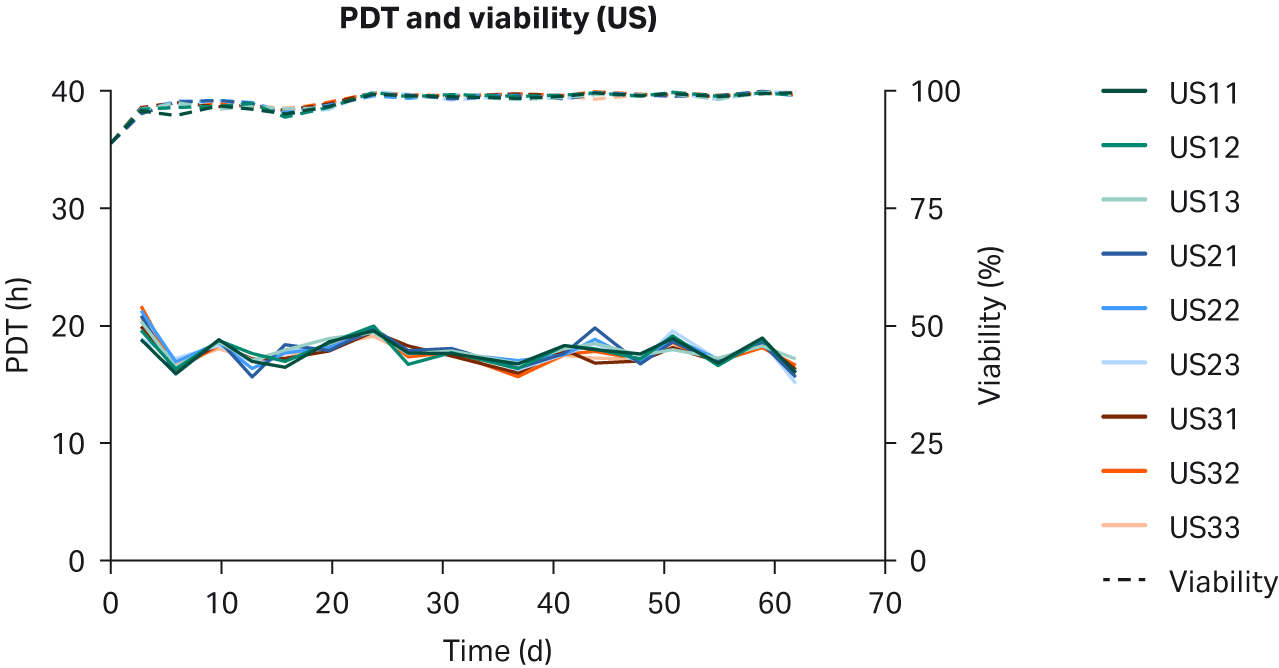
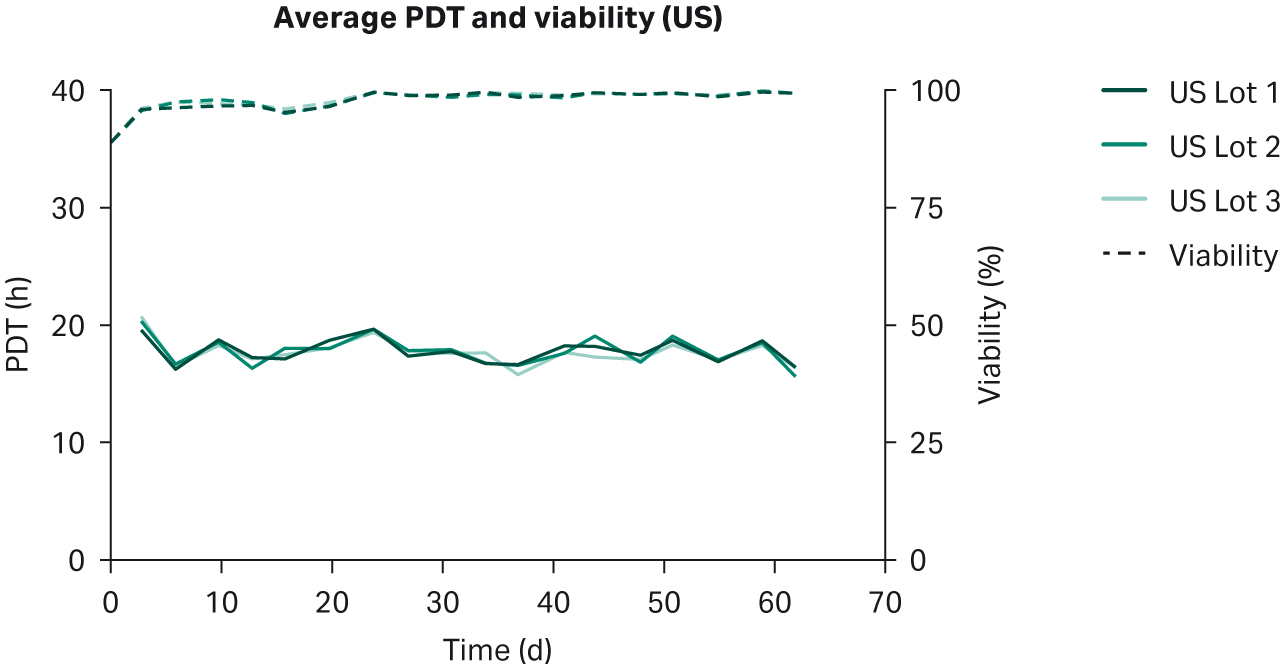
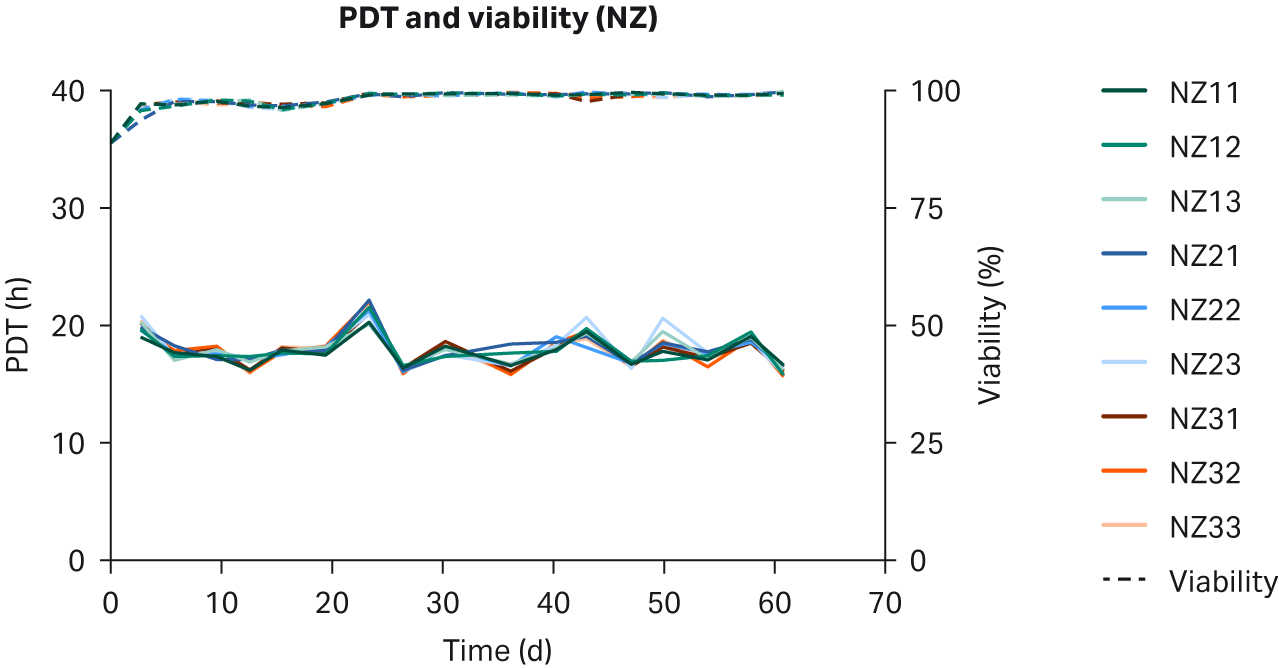
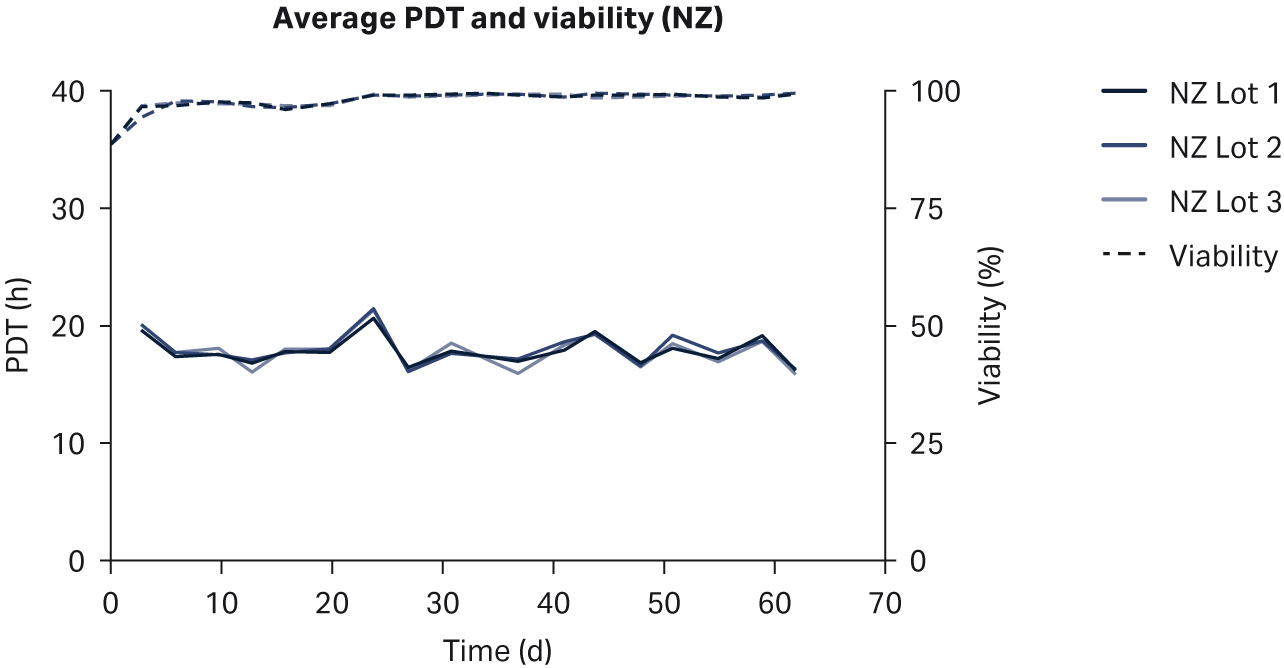
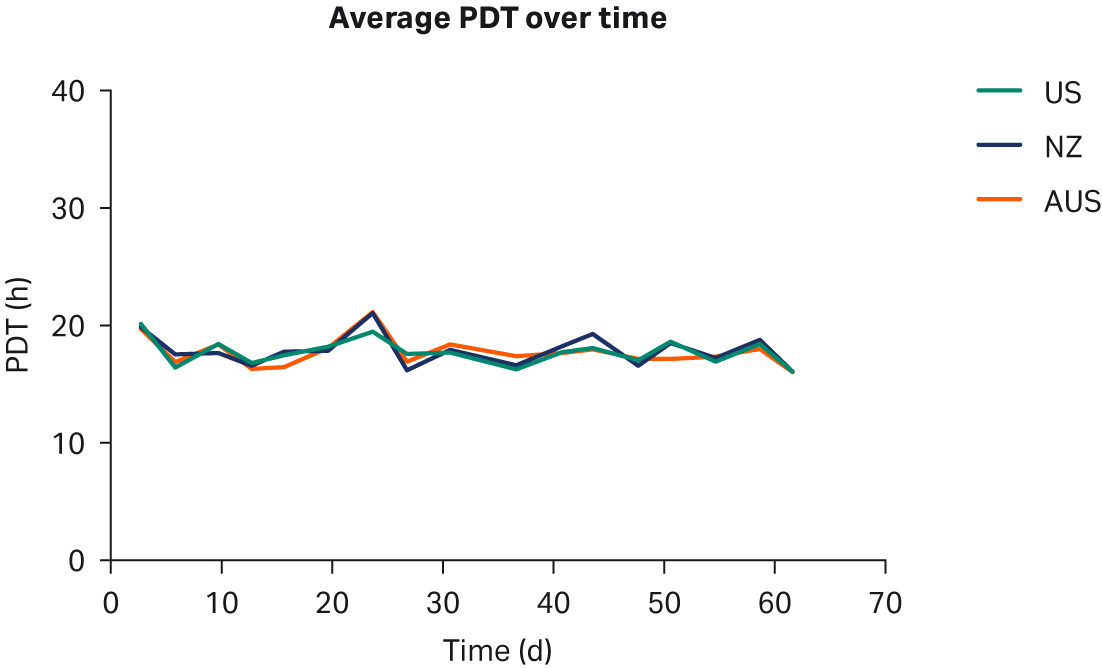
比较了补充有任何血清的 DMEM 中培养的 HEK293T 细胞,未发现细胞形态差异(图 1)。在各 PDT(图 2)、平均批次 PDT(图 2)、每个国家/地区的平均 PDT 随时间的变化(图 3A)或总体综合平均 PDT(图 3B)方面,均未发现差异。
A)
B)
C)

图 1. 在补充以下来源的 10% FBS 的 DMEM 中培养的 HEK293T 细胞的细胞形态的代表性图像:(A) 美国、(B) 新西兰、(C) 澳大利亚。10 倍放大。
A)
B)
C)
D)
E)

F)
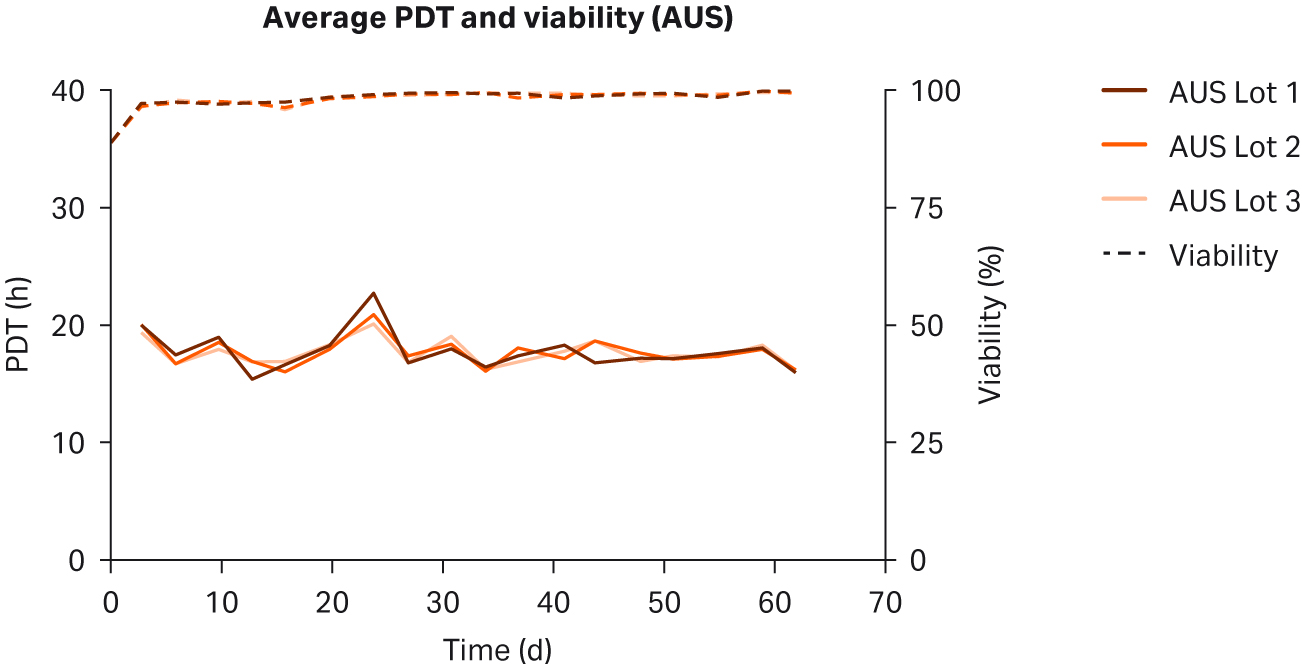
图 2. 在补充以下来源的 10% FBS 的 DMEM 中培养的 HEK293T 细胞的各 PDT、批次平均 PDT 和活力:(A) 美国、(B) 新西兰、(C) 澳大利亚。重复样本命名为批号后加 1、2 和 3(例如,US23 为批次 2,重复样本 3)。
A)
B)
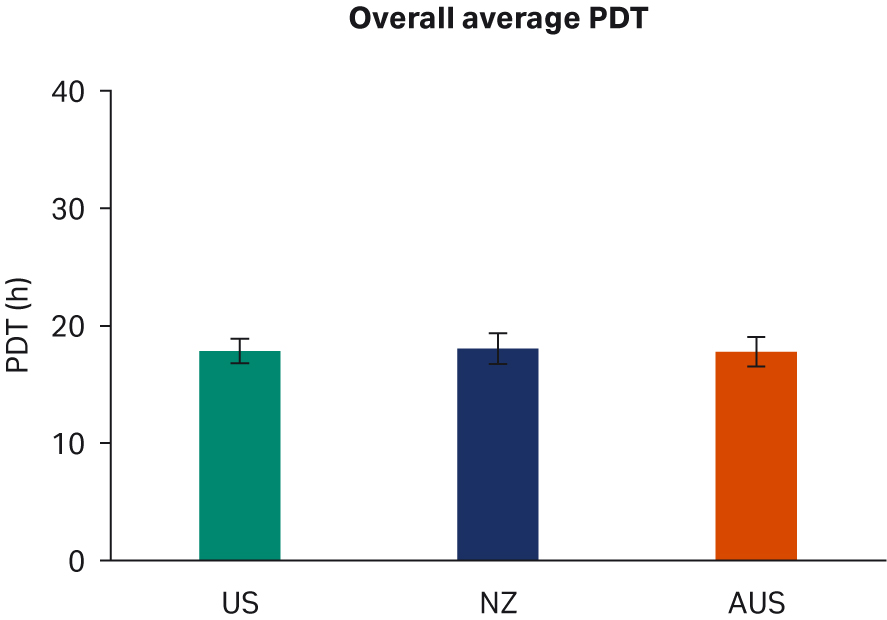
图 3. (A) 平均 PDT 随时间的变化;(B) 每个国家/地区的总体平均 PDT。描绘的误差线为标准偏差。
转染和转染效率
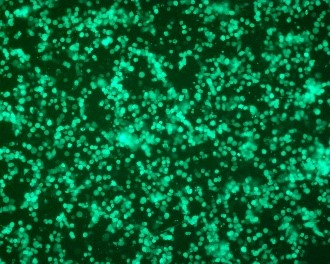
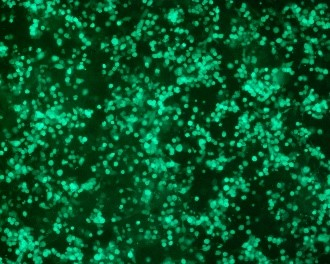
AAV2 转染后 72 小时和收获前,使用荧光显微镜监测转染细胞的绿色荧光蛋白 (GFP) 表达。保存选定样本的图像,并以亮视野和荧光图像进行比较。转染后整体细胞形态或荧光未发现差异(图 4)。
A)

B)
C)

D)
E)

F)
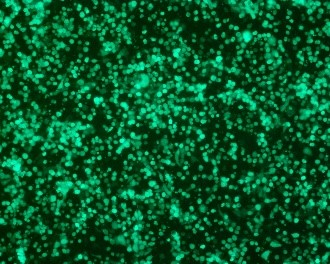
图 4. 在补充以下来源的 10% FBS 的 DMEM 中培养的 HEK293T 细胞转染 AAV2 后 72 h 的代表性 (L) 亮视野和 (R) 荧光显微镜图像:(A, B) 美国、(C, D) 新西兰、(E, F) 澳大利亚。
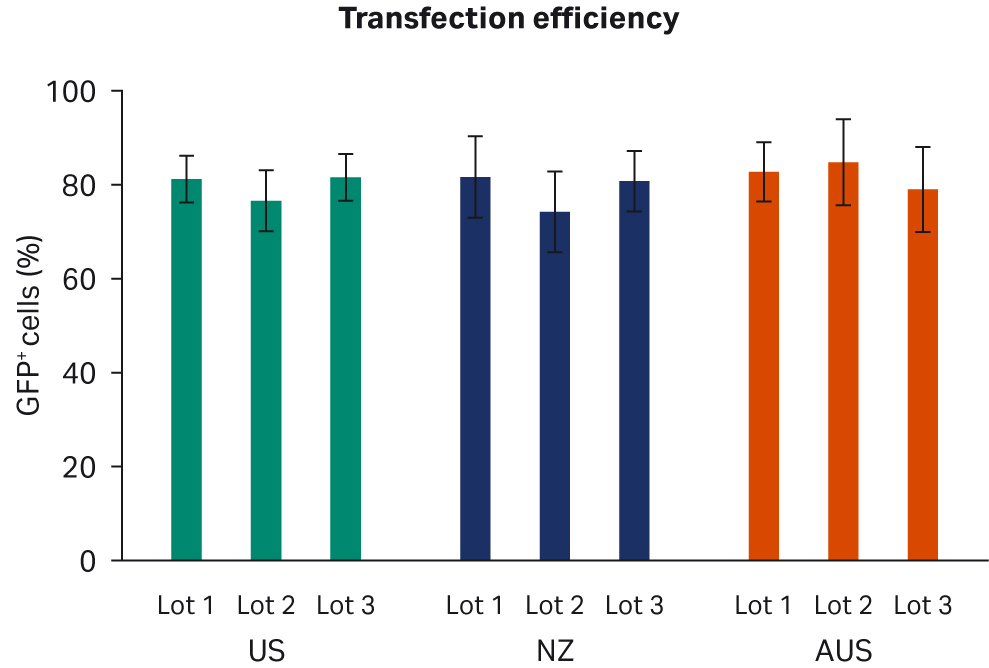
通过流式细胞仪分析了转染效率,使用门控策略定量测定每个样本中所有活细胞中 GFP+ 细胞的比例。使用重复样本进行了两次转染实验。比较了每个 FBS 批次的转染效率(图 5A)或每个原产国的总体转染效率(图 5B),未发现明显的差异。
A)
B)
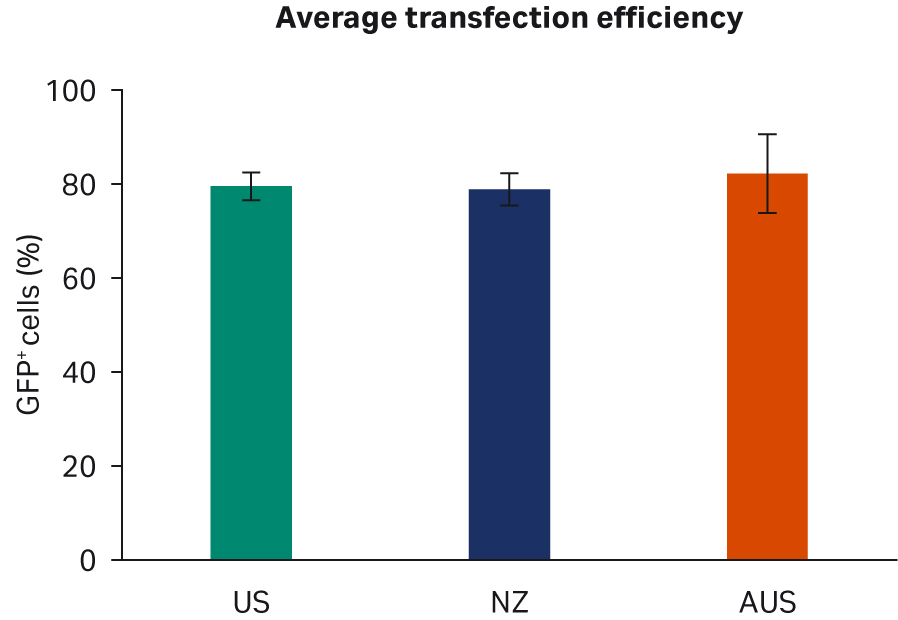
图 5. (A) 每个批次转染后 72 h 的平均 AAV2 转染效率。(B) 每个国家/地区。所有数据均含有标准偏差。
病毒滴度
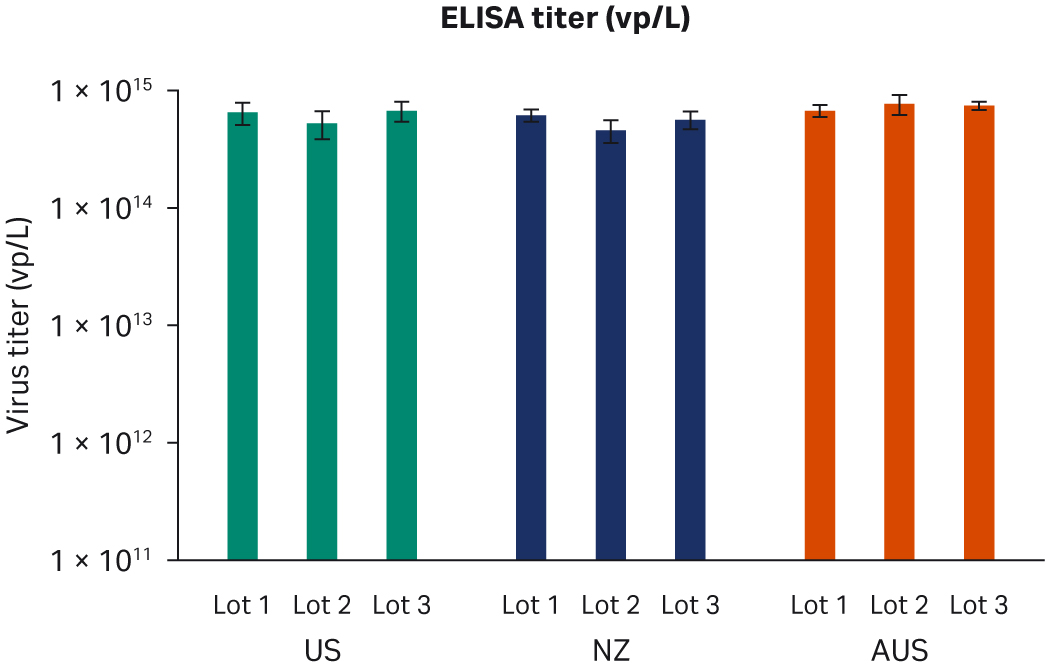
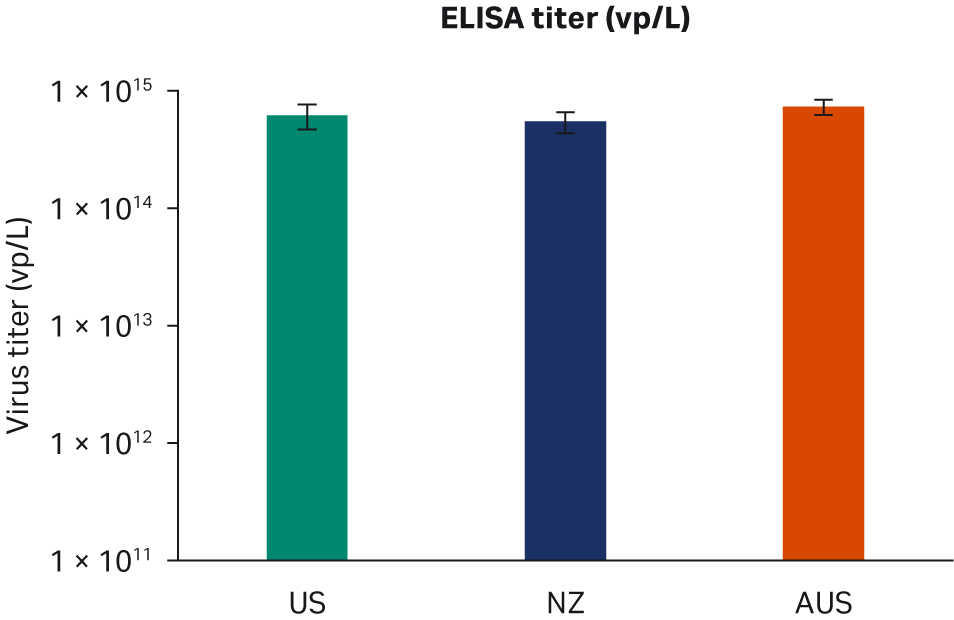
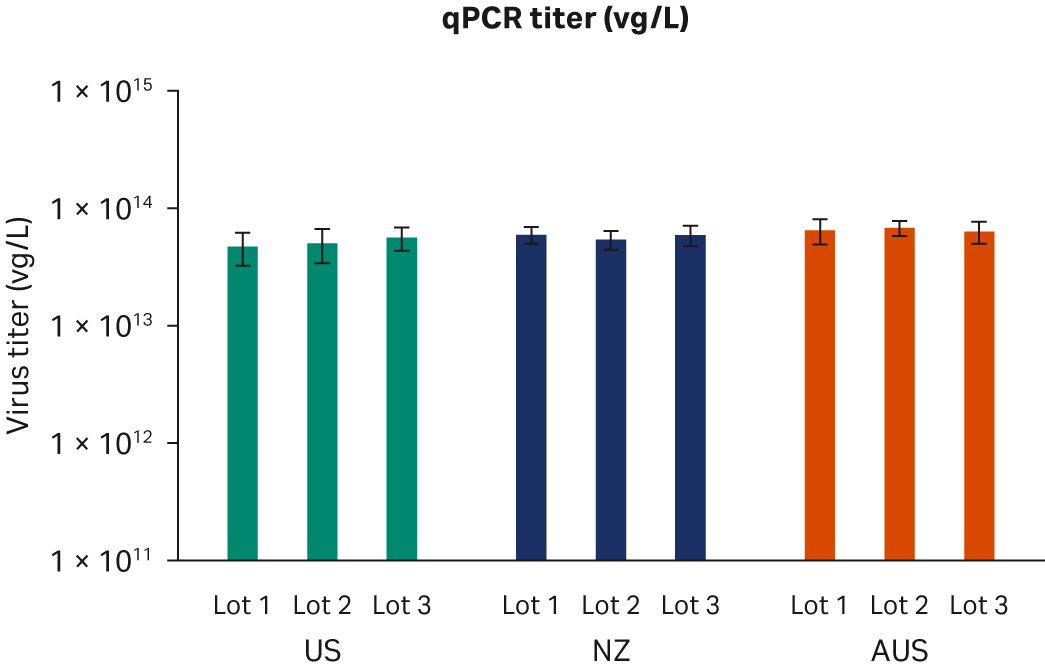
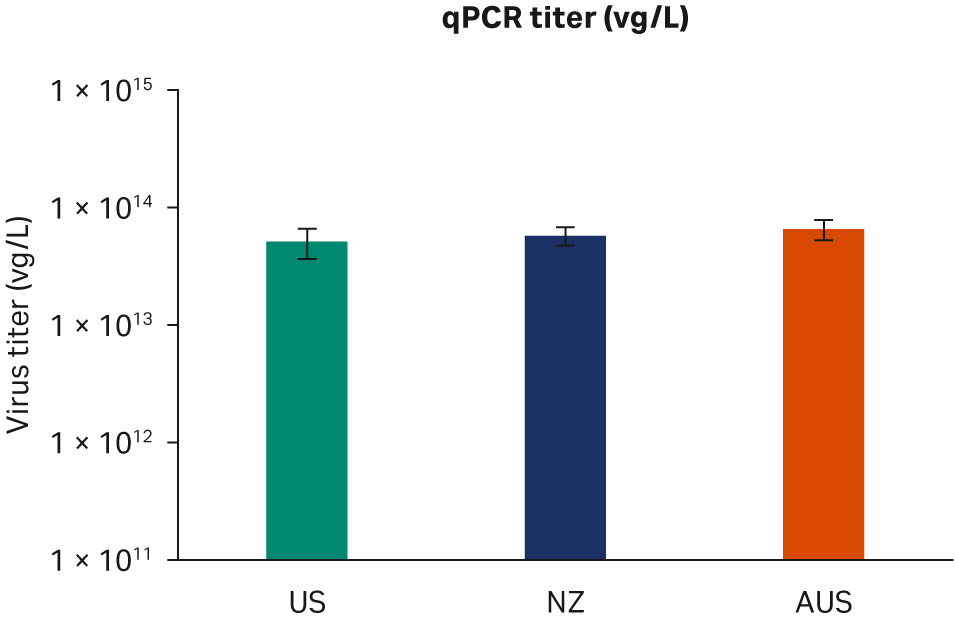
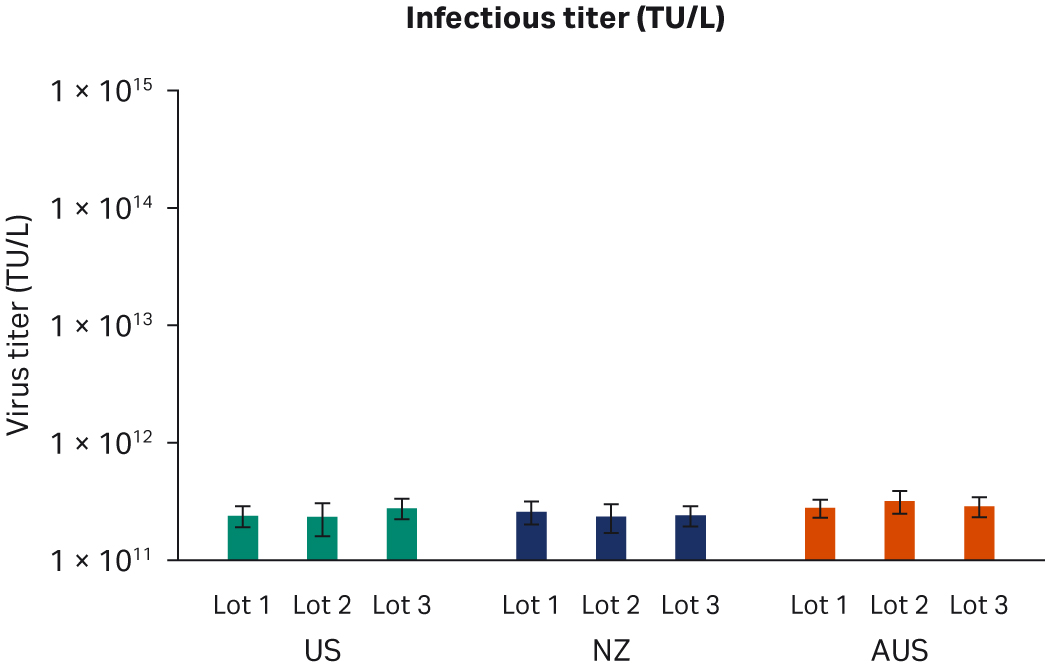
转染后 72 小时,收获样本并在 -80℃ 下冻融三次。反复冻融循环后,样本以 10000 × g 离心以澄清上清液并等分,使用酶联免疫吸附试验 (ELISA)、qPCR 和转导测定分析进行病毒滴度分析。使用所有三种方法在重复运行中对经过两次转染实验的所有样本进行两次检测。比较了所有 FBS 批次(分别为图 6A、C、E)或每个原产国的总体 ELISA、qPCR 或传染性病毒滴度(分别为图 6B、D、F),未发现差异。
A)
B)
C)
D)
E)
F)
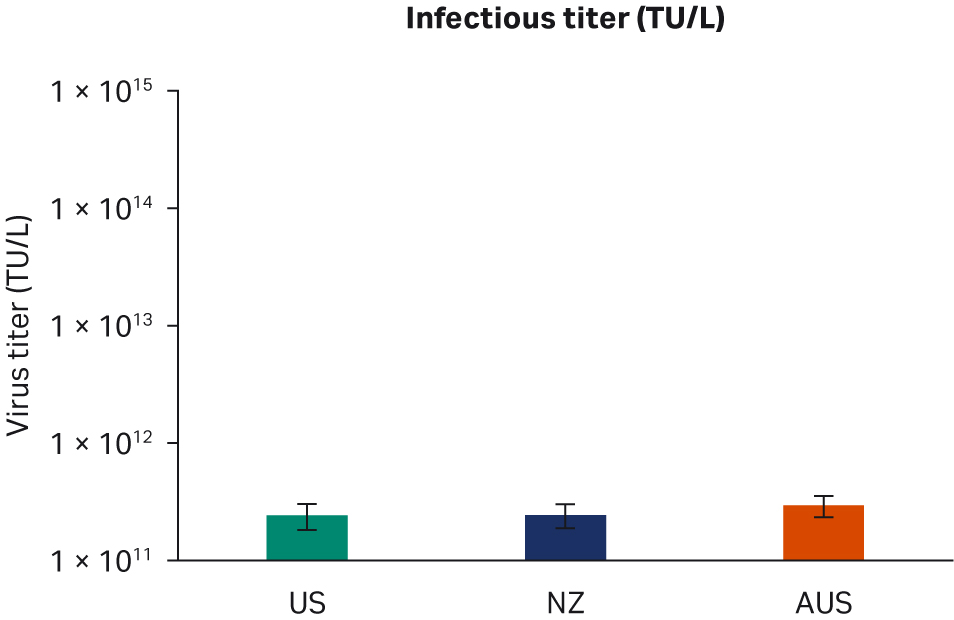
图 6. 两次独立转染实验的结果。分别为每个 FBS 批次和每个国家/地区的 (A, B) 平均 ELISA 病毒滴度、(C, D) qPCR 病毒滴度、(E, F) 传染性病毒滴度。所有数据均表示为平均病毒滴度/L 和标准偏差。
结论
本研究对来自三个不同国家/地区的 HyClone 品牌 FBS 进行了评价,每个国家/地区使用三个独立批次,每个批次使用三个培养瓶,得到总计 n = 27 个不同条件,进行平行比较。使用单一贴壁 HEK 细胞系评价 FBS 性能。总体差异较低,表明所包含的 FBS 批次在质量或性能上没有差异;然而,并未声称将这些结果外推到其他细胞系或工艺。
鉴于细胞培养实验的一般性质以及比较多种培养物时随着时间的推移可发现的差异,未发现变化表明,对于补充来自美国 (US)、新西兰 (NZ) 或澳大利亚 (AUS) 的 10% FBS 的 HyClone DMEM 中培养的贴壁 HEK293T 细胞的细胞培养动力学、形态、转染效率或病毒生产没有明显影响。此外,评估所包含样本的批内差异或批间差异时,未发现任何分析参数的差异。
结果明确表明,源自美国、新西兰或澳大利亚的优级 HyClone FBS 的性能无显著差异。
关于来自 US、NZ 和 AUS 的 HyClone 优级胎牛血清 (FBS)
用于制备 HyClone 血清的生产工艺具有国际血清行业协会 (ISIA) 认证的可追溯性。为了进一步支持产品可追溯性,我们被 Oritain 指定为科学可追溯性的早期采用者,以证明优质牛血清产品的原产国是美国、澳大利亚和新西兰。Oritain 对来自不同地区的优质牛血清样本进行了分析,并就每个原产国创建了独有的唯一“原产国指纹”的数据库。图 7 显示了一瓶 HyClone 血清上的标签示例。
了解更多:
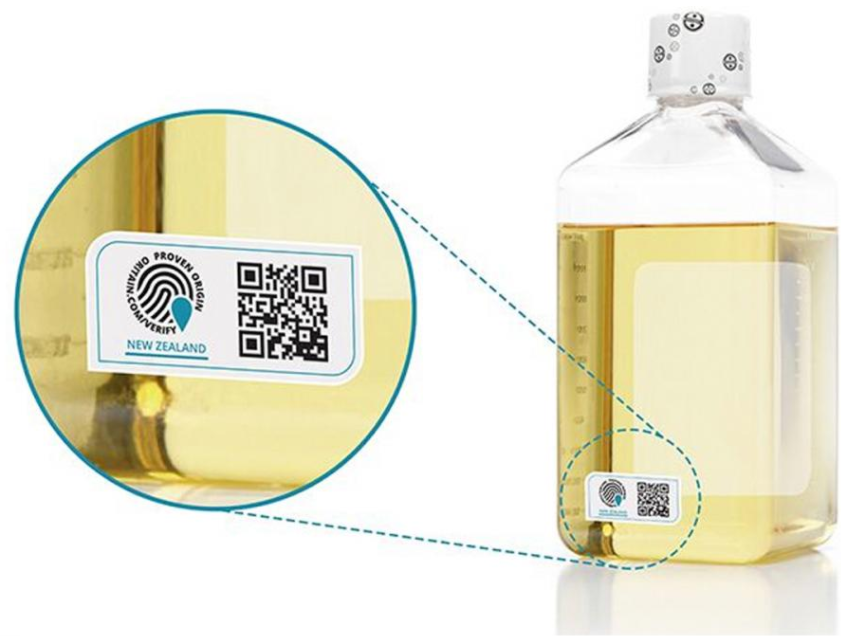
图 7. HyClone 血清(新西兰来源)瓶上的标签,确认原产国。
Recovery of adherent HEK293T cells after cryopreservation
Cells were thawed in HyClone DMEM/High glucose with L-glutamine and sodium pyruvate (hereafter only referred to as DMEM) (Cytiva) supplemented with 10% of a reference FBS (Gibco; Thermo Fisher), recovered in T25 flasks and scaled up in T75 and T225 flasks. All volumes of media and other reagents were scaled according to flask sizes for each passage (Table 1), to be able to determine PDTs and growth kinetics. Cells were passaged twice per week. For each passage, cells were carefully washed once in HyClone PBS (Cytiva) and then trypsinized using TrypLE™ (Thermo Fisher) for 2 min at 37°C. After this, cells were resuspended in additional complete media and counted, followed by passaging in new media and flasks.
Table 1. Flask sizes, media, and reagent volumes for adherent HEK293T cells
| Flask | Area (cm2) | Media (mL) | TrypLE (mL) | Media added before counting (mL) | Average seeding density per passage (cells/cm2) |
|---|---|---|---|---|---|
| T25 | 25 | 5 | 1 | 2 | 7 × 10³ to 1.5 × 10⁴ |
| T75 | 75 | 15 | 3 | 6 | |
| T225 | 225 | 45 | 9 | 18 |
Cell growth comparison
After five passages of recovery and scaling up, cells were split and seeded in n=27 individual T25 flasks in DMEM supplemented with 10% of each respective serum. Cells were passaged twice a week. Morphology, cell growth, PDT, and viability were observed for each passage. Viability and PDTs for each individual sample, average per lot, and average per country were monitored for 19 passages over 62 days.
Transfection of adherent HEK293T cells
Cells were co-transfected with three AAV2 plasmids (Cell Biolabs) using PEIpro™ (Polyplus-transfection). Cells were passaged into 6-well plates the day before transfection. On the day of transfection, a master mix of plasmids and PEIpro was prepared and then aliquoted to each experimental condition. Cells were thereafter monitored for GFP fluorescence using a fluorescence microscope 24 and 48 h post-transfection. Cells were harvested 72 h post-transfection for counting, fluorescence activated cell sorting (FACS) analysis for transfection efficiency, and virus titrations.
Adherent HEK293T cells were harvested by intensive pipetting of each well. A 50 µL aliquot was fixed in 50 µL 4% phosphate-buffered formaldehyde. A ~ 550 µL sample was used for counting cells, and the remaining cell suspension was saved for virus titrations. Harvested cell suspension samples were freeze-thawed at -80°C three times to lyse all cells before the supernatant was clarified using centrifugation.
AAV2 ELISA
ELISA titrations were done using a commercial AAV2 ELISA kit (Progen) according to the manufacturer’s instructions. All samples were tested in duplicates.AAV2 qPCR
qPCR titrations for AAV2 titers were done using an in-house developed protocol and primers. All samples were tested in duplicates.
AAV2 transduction assay
An in-house transduction assay and adherent HEK293T cells were used to measure infectious virus titers. Clarified supernatants from 3× freeze/thawed cell cultures were diluted 1:1000 in DMEM with 10% FBS before analysis using the transduction assay. Virus titers were calculated using the average number of cells/well at the time of transfection, the fraction of GFP-positive live cells at harvest, the dilution factor of each sample, and the transduction volume (here
500 µL), according to the formula:
Transduction volume
Statistical analyses
All data was presented as mean with standard deviations (where applicable). Statistical analyses to investigate differences between FBS originating from different countries were done using single-factor ANOVA analyses with Bonferroni corrections. The accuracy of the ELISA, qPCR, and transduction assay methods were also taken into account to judge the significance of any observed trends.
TR #29621157