CAR T cell therapy workflows need standardized and automated unit operations to improve process efficiency and reproducibility. After cryopreservation, cell therapy products are commonly thawed manually in a water bath. This method introduces the risk of exposure to water-borne contaminants, adding to product quality concerns. Determining thaw times in a water bath is also subjective, leading to variability. Dry thawing systems are not commonly used, as most options are not compatible with GMP manufacture. In addition to the inability to log data or connect digitally, other limitations to many of the dry thawing systems that are available include subjective or preset thaw times instead of automatic, adjusted, and sample-specific thawing.
To address the shortcomings of commonly used thawing systems, we developed the VIA Thaw™ series. These innovative and automated thawing units rely on temperature sensors to actively monitor cell therapy sample conditions in real time, leading to better control, reduced manual intervention, and less subjectivity in the thawing process. Instead of fluid, a precision-machined aluminum bed acts as a heat source, reducing the risk of water-borne contamination. In addition, the VIA Thaw series electronically records the thawing run — a key feature, as tracing the history of a sample from collection to patient delivery is critical for GMP manufacture. Units synchronized with the web-based Chronicle™ software platform can receive the thawing record and unite this data with the sample’s complete electronic batch record. Chronicle software can also connect all VIA Thaw systems, which standardizes thawing across connected units. Finally, these systems help improve productivity by eliminating the labor involved in preparing, validating, manually thawing, and transcribing manual thaw records.
Here, we compare the performance of the VIA Thaw CB1000* (predecessor to the VIA Thaw L1000 – see “Appendix – Demonstration of VIA Thaw L1000/CB1000 comparability”) to thawing in a water bath. A model CAR T workflow was used for all upstream cell manufacturing. T cells were expanded post-activation and post-transduction with an enhanced green fluorescent protein (eGFP)-encoding lentiviral vector (LVV) in a Xuri™ Cell Expansion System W25. Cells were then harvested, volume-reduced, and washed using the Sefia™ Cell Processing instrument. The cells were formulated in CryoStor™ CS10 and cryopreserved at two volumes in a VIA Freeze™ controlled-rate freezer followed by transfer to liquid nitrogen vapor for storage. Cryobags were then thawed using either the VIA Thaw system or a water bath. Viable cell density and phenotype were analyzed across all conditions. After thaw, the cells were expanded in small scale for 6 d to assess post-thaw reactivation as a surrogate measure of T-cell proliferation in vivo. Pre- and post-thaw viability, recovery, and phenotype were measured and compared between the two thawing methods.
Overall, the VIA Thaw unit showed comparable performance to a water bath when thawing gene-modified T cells, supporting its use in CAR T cell therapy workflows.
*Note: VIA Thaw L1000 by Cytiva is a variant of CB1000 model and offers additional flexibility for different use cases. VIA Thaw L1000 is intended for research or manufacturing use only. It is not intended for clinical procedures or for diagnostic purposes.
For details on the differences and similarities between the variants, see the Appendix. Please visit us at cytiva.com/celltherapy or contact us for more information on features, pricing, or to request a demo.
How to thaw frozen cells in the CAR T workflow
Immunotherapies have the potential to revolutionize care and outcomes for patients fighting hematologic malignancies. CAR T cells, for example, have shown remarkable overall response rates in treating blood-borne cancers, such as acute myeloid leukemia (AML) and acute lymphoblastic leukemia (ALL).
The effective delivery of CAR T therapies to patients requires an efficient, standardized approach to thawing cryopreserved cell products. Current standard practice is to thaw autologous cell therapies in a 37°C water bath.1 Since this process introduces a risk of water-borne contamination2, dry bead baths can be used instead in regulated environments, such as cGMP facilities.3 Operator-to-operator variability adds risk due to the subjectivity of thaw times, which are based on visual inspection of the vial or bag during and after the thawing process has completed. The need to minimize contamination risk and increase process control and efficiency has motivated a move away from conventional water bath- and bead bath-based systems and toward a more automated approach. Some dry thawing instruments that can thaw frozen product in vials and bags4-7 are now available, but these options can still require significant manual intervention by the operator and lack connectivity with other unit operations.
The VIA Thaw instrument reduces the need for manual intervention in the thawing step of the cell therapy workflow. VIA Thaw dry thawing instrument actively measures the temperature of the cryobag via infrared sensors and automatically control the warming, agitation, alarms and notifications in real time, reducing operator subjectivity and variability. By eliminating the use of fluids as a heat source, contamination risk is also reduced.
In this study, we tested T cells thawed in a VIA Thaw CB1000 unit against a water bath (wet thaw method) and compared their viability, recovery, viable cell density, and phenotype immediately pre- and post-thaw as well as after 6 d in culture post-thaw. Figure 1 illustrates a CAR T cell manufacturing workflow with recommended variant of VIA Thaw instrument. T cells collected via apheresis are transduced to express the chimeric antigen receptor (CAR) and then expanded typically to numbers ranging from one to tens of billions prior to formulation and cryopreservation in bags.
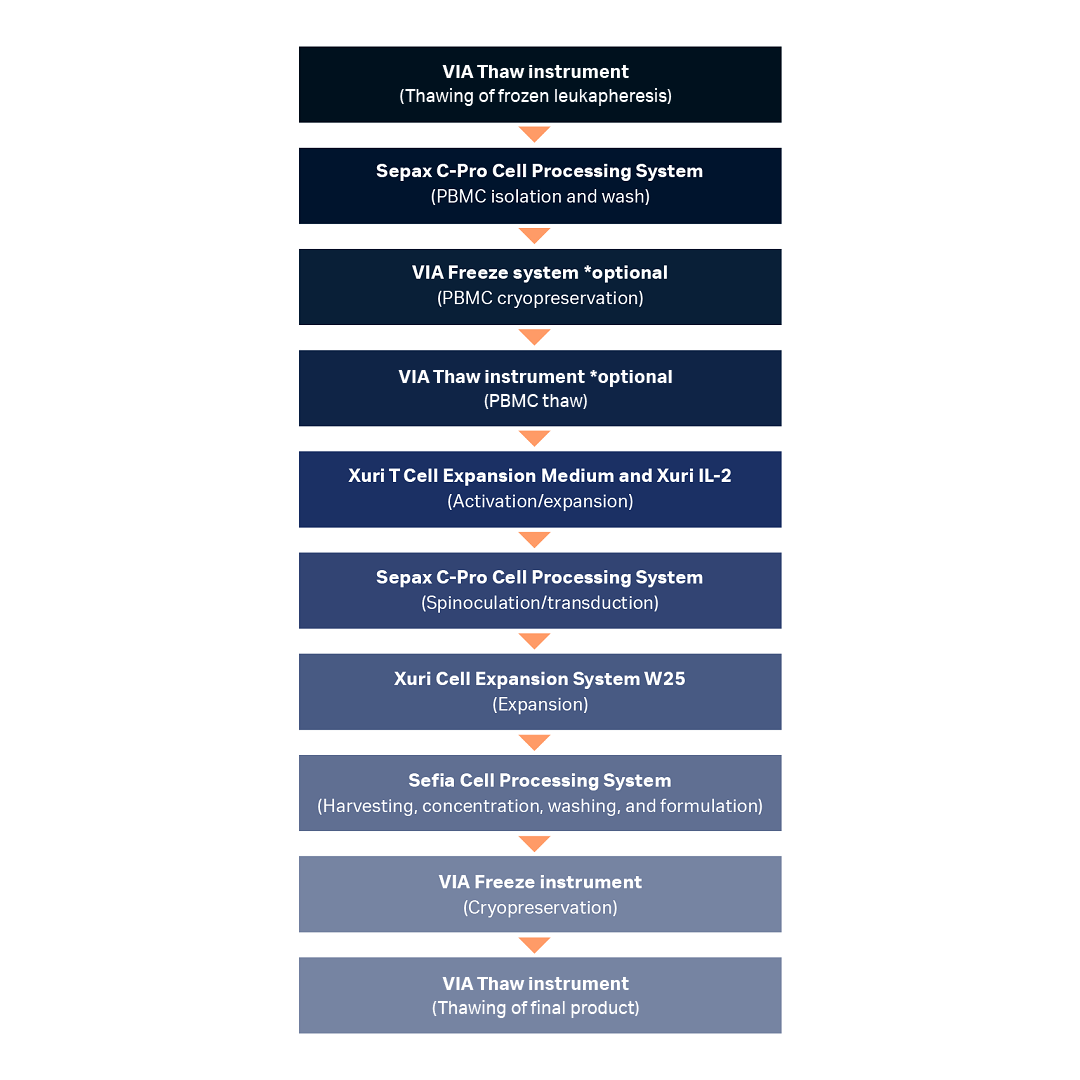
Fig 1. Unit operations used in a model CAR T cell manufacturing process workflow demonstrating the potential use cases of the VIA Thaw instrument in place of a water bath. Nearly all steps were fully closed or functionally closed and automated. Note that while a proprietary dry thawing device was used for upstream thawing in this study and VIA Thaw CB1000 was used for downstream thawing, the VIA Thaw L1000 is recommended for upstream and downstream applications, as shown in this workflow.
PBMC = peripheral blood mononuclear cell.
In practice, cryogenic cold chain logistics are often needed to enable transport of cryopreserved therapies to clinical sites prior to patient administration. Cells will often need to be kept in short- or long-term storage in liquid nitrogen vapor and then thawed immediately prior to infusion. Therapeutic developers might opt to cryopreserve the peripheral blood mononuclear cell (PBMC) fraction of the collection upstream of expansion as well.
Cell viability and phenotype results for automated cell thawing instrument versus water bath
See “Materials and methods” for details
Expanded T cells from three biological replicates were cryopreserved and thawed in either a water bath or a VIA Thaw unit, and key variables of interest (recovery, viability, phenotype, and thaw time) were measured across each thawing method. No significant difference in either viable cell density (Fig 2) or percentage viability (Fig 3) was seen between the thawing methods at either of the volumes tested (20 mL in CS50 cryobags, 70 mL in CS250 cryobags).
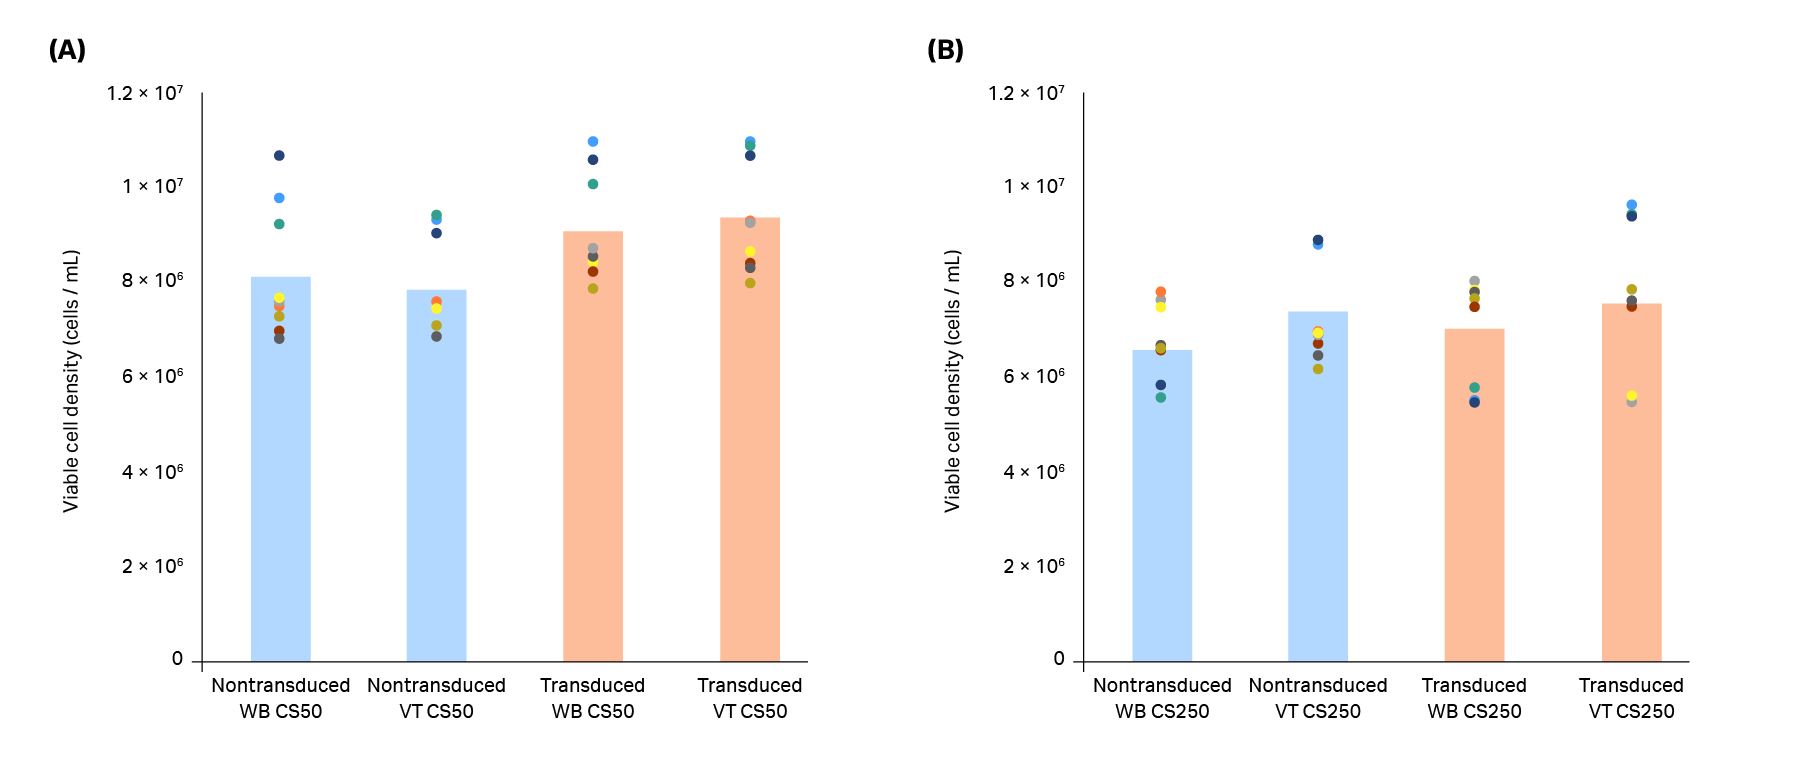
Fig 2. Viable cell density of T cells in (A) CS50 and (B) CS250 cryobags thawed using a water bath (WB) or VIA Thaw (VT) unit. Blue bars (nontransduced T cells) and orange bars (transduced T cells) represent the mean of n = 3 biological and n = 3 technical replicates (9 replicates total), with each measurement shown as a colored dot. No significant differences were observed between the thawing methods for either nontransduced or transduced T cells (p > 0.05 by 2-sample t-test).
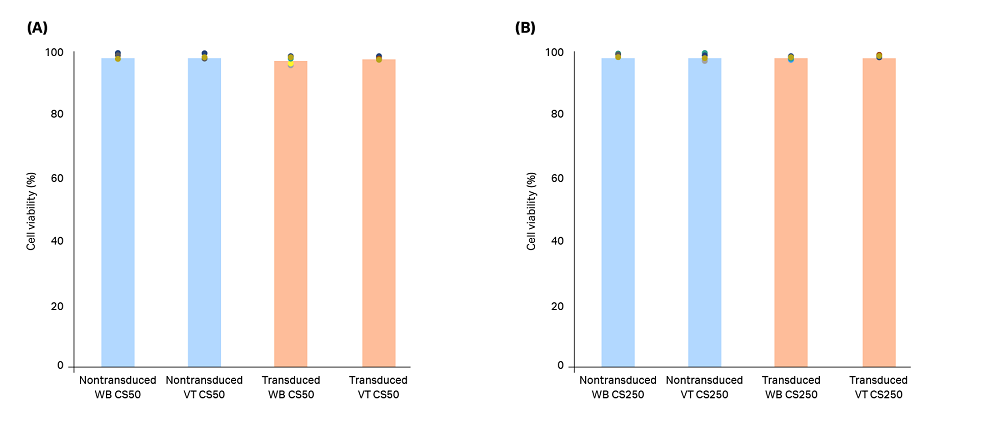
Fig 3. Viability of T cells in (A) CS50 and (B) CS250 cryobags thawed using a water bath (WB) or VIA Thaw (VT) unit. Blue bars (nontransduced T cells) and orange bars (transduced T cells) represent the mean of n = 3 biological and n = 3 technical replicates (9 replicates total), with each measurement shown as a colored dot. No significant differences were observed between the thawing methods for either nontransduced or transduced T cells (p > 0.05 by 2-sample t-test).
The cells were also seeded in 6-well plates and reactivated 24 h post-thaw. These cultures were maintained for 6 d after thawing in order to evaluate possible effects of the thawing method on post-thaw expansion as a surrogate assay for in vivo T cell proliferation. At the end of this culture period, viability was ≥ 96.6% regardless of the thawing method used or whether the T cells had been transduced (Fig 4).
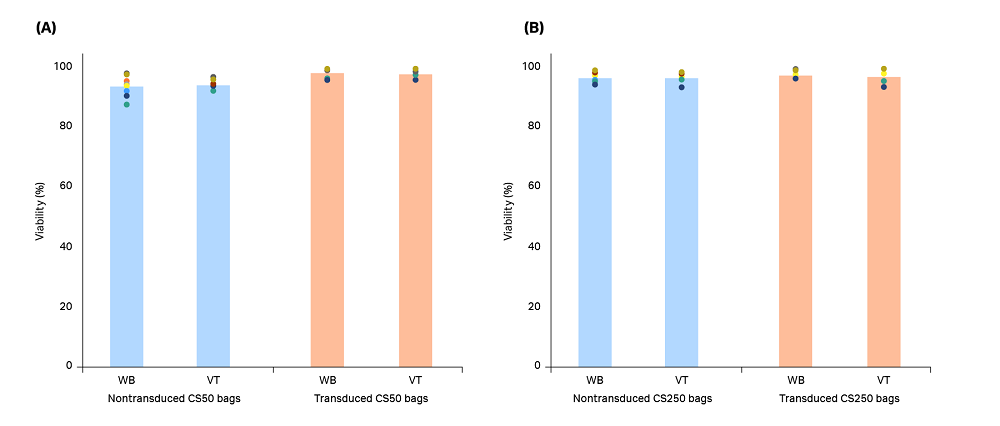
Fig 4. Viability of T cells reactivated for 6 d in culture after being thawed from (A) CS50 and (B) CS250 cryobags using either a water bath (WB) or VIA Thaw (VT) unit. Blue bars (nontransduced T cells) and orange bars (transduced T cells) represent the mean of n = 3 biological and n = 3 technical replicates (9 replicates total), with each measurement shown as a colored dot. No significant differences were observed between the thawing methods for either nontransduced or transduced T cells (p > 0.05 by 2-sample t-test).
Flow cytometry was used to examine T-cell (CD3+) phenotype 6 d after reactivation. Following reactivation, the cells had approximately a 3:1 CD8 to CD4 ratio in nontransduced cells (Fig 5A) and 2.5:1 CD4 to CD8 ratio for transduced cells (Fig 5B). Additionally, all cells were activated (CD25+), and approximately 83% of the transduced cells expressed GFP (Fig 5B, yellow bars). No significant differences were observed between cells cryopreserved in CS50 bags (data not shown).
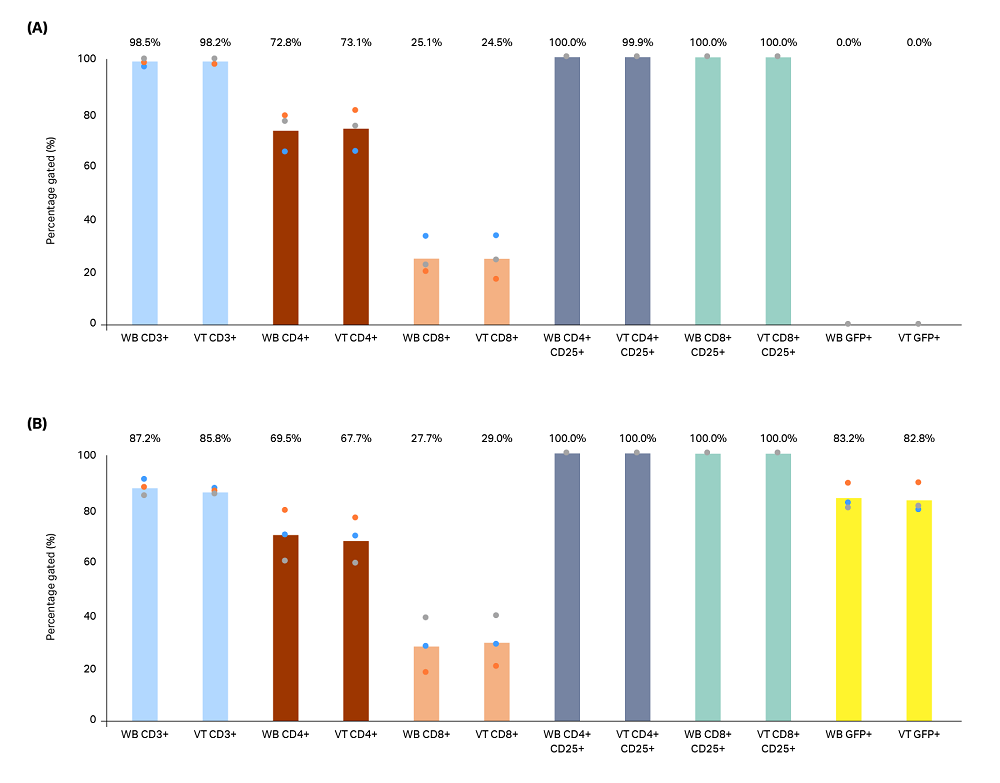
Fig 5. Flow cytometry was performed for phenotypic analysis on pooled triplicate cultures of (A) nontransduced and (B) GFP lentivirus-transduced (LV) T cells that had been reactivated and cultured for 6 d in 6-well plates. Prior to reactivation, cells frozen in CS250 cryobags were thawed in a water bath (WB) or VIA Thaw (VT) unit. Cells were analyzed for CD3 (blue bars), CD4 (red bars), CD8 (orange bars), CD25 (grey and green bars), and GFP (yellow bars) expression. No significant differences were observed between the thawing methods for either nontransduced or transduced T cells (p > 0.05 by 2-sample t-test).
The measured thawing time is shown in Figure 6. The average thawing time of CS50 bags was 4 min, 23 s in a water bath and 6 min 58 s in a VIA Thaw unit. Average time of CS250 bags was 5 min 10 s in a water bath and 12 min 10 s in a VIA Thaw unit. Despite these differences, users performed fewer interventions in the VIA Thaw group, and the thaw process and data logging were automated, making the VIA Thaw unit the more favorable option overall.
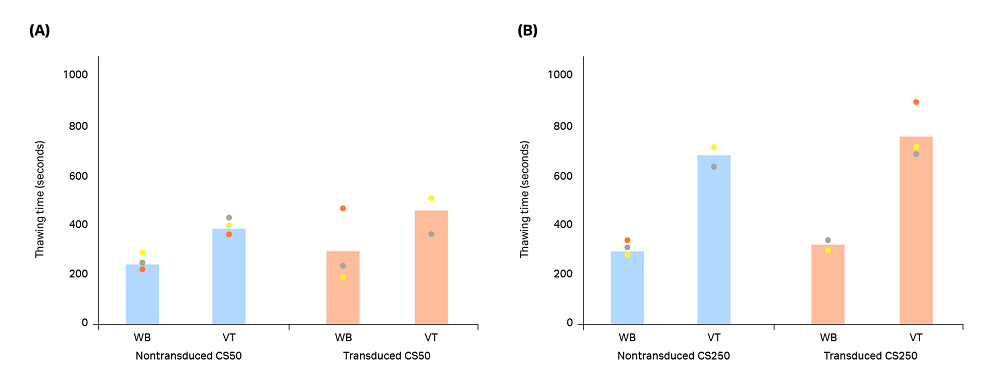
Fig 6. Thawing time measured from when the cryobag was placed into either a water bath (WB) or a VIA Thaw (VT) unit to complete the thawing process. Blue bars (nontransduced T cells) and orange bars (transduced T cells) represent the mean of n = 3 biological replicates, with each measurement shown as a colored dot. Significant differences were observed between the thawing methods for CS50 nontransduced, CS250 nontransduced, and CS250 transduced T cells (p < 0.05 by 2-sample t-test). The CS50 transduced thawing methods showed no significant difference (p > 0.05 by 2-sample t-test).
Standardized thawing with reduced cell therapy contamination risk
Performance of the VIA Thaw instrument and water bath were comparable in terms of viability and cell density post-thaw, and viability and phenotype post-reactivation. No significant differences were measured when comparing working volumes or nontransduced versus transduced T cells, further suggesting the instrument operates robustly under the tested conditions.
We observed that the VIA Thaw unit had a longer, albeit better controlled, thaw time compared to a water bath. Importantly, we have shown previously that slower thaw rates do not, in fact, impact cell quality.8,9,10 Interestingly, some donors and samples required longer thawing times than others. For example, CS250 bags generally required longer thaw times compare to CS50 bags, which was expected given the larger volume in these bags; however, there was also a donor dependency to this observation (e.g., donor 1 thaw times for CS250 bags were generally longer than for donor 2 and donor 3). This is hypothesized to have been due to the presence of large air pockets and/or presence of cryobag labels in the overwrap bags, which may have impacted sensor readouts.
Improvements in the overwrap sealing procedure to ensure all air is removed and adjusting label would help eliminate this issue. For example, the amount of air introduced during filling can be minimized through improved filling practices or debubbling of the bag contents, and labels can be placed outside of the area where the sensors may interact with the bag to assess temperature. Donor 1 was also the first sample processed, which may point to minor operator error that was easily corrected in subsequent experiments with donors 2 and 3. Lastly, the inability to observe the bag during thaw presents a minor limitation compared to a water bath, but monitoring was achieved through the infrared sensors within the unit. This, in turn, allowed the operator to proceed to other work or unit operations without needing to check on the bag throughout the entire thawing process. Further optimization of cell thawing protocols, cryopreservation conditions, and other conditions such as consistency of T cell density in each cryobag might improve the overall consistency in thawing times, viability, and recovery.
Despite these minor limitations, the VIA Thaw series represents a significant advancement over water-bath thawing techniques and offers key advantages over other dry thawing instruments. Uncertainty associated with subjectivity in thaw times is reduced. While the instrument is in operation, the user is free to carry out other tasks. The dry thawing approach also eliminates risk of water-borne contaminants inherent to water bath-based thawing. Overall, the VIA Thaw unit provided a smoother and more robust workflow experience with no negative impact to product viability, viable cell density, phenotype, and post-thaw growth. In addition to these benefits, the ability to enable automated, digital data capture through Chronicle software makes the VIA Thaw instrument well-suited for use in GMP cell therapy workflows.
Acknowledgements
All work was performed in collaboration with CCRM through funding from FedDev Ontario and Cytiva at the Centre for Advanced Therapeutic Cell Technologies (CATCT), Toronto, Ontario, Canada. The reporting and interpretation of the research findings are the responsibility of the author(s).
Ordering Information
| Item | Product code |
|---|---|
| VIA Thaw L1000 | 29403109 |
| VIA Freeze Quad | VFQ_30010 |
| Sepax™ C-Pro application software pack | 29734656 |
| Sepax C-Pro Cell Processing Instrument | 29264741 |
| FlexCell Sefia application software | 16301 |
| Xuri Cell Expansion System W25 | 29064568 |
| CT-800.1 Sefia Cell Processing Kit | 20001 |
| CT-60.1 Sepax C-Pro Cell Processing Kit | 29264739 |
| Xuri Cell Expansion System Cellbag Perfusion, pH and DO, 2 L | 29105498 |
| Xuri T Cell Expansion Media | 29185231 |
| Sefia Cell Processing Instrument | 29285527 |
References
- Baboo J, Kilbride P, Delahaye M, et al. The impact of varying cooling and thawing rates on the quality of cryopreserved human peripheral blood T cells. Sci Rep. 2019 Mar 4;9(1):3417. https://doi.org/10.1038/s41598-019-39957-x.
- Walther-Wenke G, Wirsing von König CH, Däubener W, et al. Working party on bacteria safety in transfusion medicine, advisory board of the German Ministry of Health, Berlin. Monitoring bacterial contamination of blood components in Germany: effect of contamination reduction measures. Vox Sang. 2011 May;100(4):359-366. https://doi.org/10.1111/j.1423-0410.2010.01432.x.
- Gladd T. Cell thawing: Are you risking GMP compliance with the water bath method? 2015. Bioprocess Online website. https://www.bioprocessonline.com/doc/cell-thawing-are-you-risking-gmp-compliance-with-the-water-bath-method-0001. Published January 25, 2015. Accessed January 9, 2020.
- Iyer RK, Bowles PA, Kim H, Dulgar-Tulloch A. Industrializing autologous adoptive immunotherapies: manufacturing advances and challenges. Front Med (Lausanne). 2018 May 23;5:150. https://doi.org/10.3389/fmed.2018.00150.
- Triana E, Ortega S, Azqueta C, et al. Thawing of cryopreserved hematopoietic progenitor cells from apheresis with a new dry-warming device. Transfusion. 2013 Jan;53(1):85-90. https://doi.org/10.1111/j.1537-2995.2012.03669.x.
- SAHARA-TSC. Sarstedt company website. https://www.sarstedt.com/en/products/clinic/warming/stem-cells/product/97.8710.600. Accessed January 9, 2020.
- ThawSTAR. Millipore Sigma company website. https://www.sigmaaldrich.com/catalog/product/sigma/bcs601. Accessed January 9, 2020.
- Baboo J, Kilbride P, Delahaye M, et al. The impact of varying cooling and thawing rates on the quality of cryopreserved human peripheral blood T cells. Sci Rep. 2019;9:3417. https://doi.org/10.1038/s41598-019-39957-x.
- Morris, GJ. Evidence-based cell thawing. Cytiva 2019.
- Optimize your cell therapy process — a guide to cell thawing. 2021.
For a comprehensive overview of the upstream T-cell culture and processing methods used in this work, refer to our application note, Closed and semi-automated processing of CAR T cells.
Upstream processing
Frozen leukopaks (HemaCare) from three biological donors were thawed in a proprietary dry thawing device (Cytiva). Thawed cells were washed and diluted in a Sepax C-Pro Cell Processing System (Cytiva). The CD3+ cells were isolated using the EasySep™ Release Human CD3 Positive Selected Kit (STEMCELL Technologies) and activated using ImmunoCult™ Human CD3/CD28/CD2 T cell Activators (STEMCELL Technologies) for 24 h in static conditions in complete T-cell media; the latter consisted of Xuri T Cell Expansion Medium (Cytiva), 5% heat-inactivated human AB serum (Gemini Bio), and 350 IU/mL Xuri IL-2 growth factor (Cytiva).
After 24 h, CD3+ cells were transduced with eGFP-encoding LVV (Tailored Genes) at a multiplicity of infection (MOI) of 2.5 and agitated at 90 rpm for 4 d in 1 L Erlenmeyer cell culture flasks placed in a MaxQ™ CO2 Plus shaker in a 37°C, 5% CO2 incubator. Nontransduced control T-cell cultures from matched biological donors were expanded separately under identical conditions. After transduction, the cells were inoculated into a 2 L Xuri Cellbag bioreactor (Cytiva), and medium was added to a volume of 500 mL. Additional medium was added slowly overnight to achieve a total working volume of 1 L, after which perfusion was initiated at 1 L/d from day 5 onward to control lactate, ammonium, and glucose levels. The cells were maintained until day 11 and then harvested for downstream processing. The harvested total viable T cell count on day 11 was in the range of 3 × 10¹⁰ to 7 × 10¹⁰ cells (n = 3, nontransduced; n = 3, transduced).
Downstream processing
Harvest on Sefia Cell Processing instrument
T cells were harvested using the Sefia Cell Processing instrument (Cytiva) and FlexCell application with CT-800.1 kit (Table 1). The total number of viable T cells processed was 5 × 10⁹, corresponding to an input cell concentration ranging between 2.7 × 10⁷ and 3.8 × 10⁷ cells/mL. The T-cell input volume ranged between 150 and 185 mL and was reduced to 50 mL at a flow rate of 75 mL/min. Two wash cycles were performed using a wash buffer (Plasmalyte-A + 10% human serum albumin). Washes were performed at 400 × g for 5 min, and cells were extracted in wash buffer to the intermediate bag for further processing.
Table 1. FlexCell application process parameters
| Parameter | Value |
|---|---|
| Initial volume | Manual† |
| Detect initial volume | 1 (Yes) |
| Enable initial bag weight sensor | 0 (No) |
| Enable waste bag weight sensor | 1 (Yes) |
| G-force (concentration) | 400 g |
| Sedimentation time (concentration) | 300 s |
| Intermediate volume (concentration) | 50 mL |
| Pump speed | 75 mL/min |
| Wash cycles | 2 |
| G-force (washing) | 400 g |
| Sedimentation time – washing | 300 s |
| Intermediate volume – washing | 50 mL |
| Final volume: bag 1 | 72 mL |
| Final volume: bag 2 | 72 mL |
| Final volume: bag 3 | 72 mL |
| Switch bag for resuspension | 0 (No) |
| Dead volume extraction | 0 (No) |
| Enable process temperature | 0 (No) |
| Process temperature | 20°C |
| Enable final product temperature | 1 (Yes) |
| Final product temperature | 4°C‡ |
| Final product conditioning time | 0 s |
| Enable final dilution | 1 (Yes) |
| Final dilution injection rate | 17 mL/min |
† Input volume range was 150 to 185 mL.
‡ In this study, the temperature was maintained with cold packs as the temperature sensor had not yet been integrated into the Sefia instrument.
To ensure the cell concentration in each bag was within a predetermined target range, excess T cells were manually and aseptically removed from the intermediate bag and wash buffer was added to achieve a volume of 130 mL. This volume was then further diluted 1:1 with CryoStor CS10 to achieve a final concentration range of 5.6 × 10⁶ to 1.1 × 10⁷ cells/mL. The formulated T cells were dispensed from the intermediate bag to two CS250 cryobags (target working volume: 72 mL per bag). The intermediate bag with leftover formulated T cells was transferred to a biosafety cabinet (BSC) for manual filling of three CS50 cryobags (target working volume: 22 mL per bag). The cryobags were placed in O-Wrap™ overwrap bags (Origen) and sealed using a Weston Pro 2300 vacuum sealer.
Freezing and cryopreservation
The cryobags were transferred to a VIA Freeze controlled-rate freezer (Cytiva), which had been precooled to 4°C at a rate of -2°C/min. A freezing protocol with -1°C/min ramp down was used with a final target temperature of -100°C. The frozen cryobags were then placed into stainless steel freezing cassettes (Core Cryolab Cat # 250-BBC and C-4R9955) and transferred to vapor-phase liquid nitrogen for storage for at least 7 d.
Thawing process with water bath
A water bath was prewarmed to 37oC, with the temperature verified by an external thermometer with thermocouple. A single frozen cryobag was transferred directly from liquid nitrogen storage into the water bath for thawing. The cryobag was placed in a horizontal orientation in the water bath with a weight atop the bag to prevent it from floating. The bag was visually inspected every 1 to 2 min. The cryobag was removed when the last ice crystal was observed and transferred to a BSC for further processing.
Thawing process with the VIA Thaw unit
The VIA Thaw CB1000 was prewarmed with the selected protocol (either 70 mL with overwrap or 20 mL with overwrap to thaw the two different configurations addressed here). One frozen cryobag was transferred directly from liquid nitrogen storage to the VIA Thaw unit, and the thawing process was initiated. Once the thawing cycle was complete, the lid was opened and the cryobag was inspected for residual ice crystals. Bags for which more than 10% of ice crystals by visual inspection remained were placed back into the unit for an extended warming process in 60 s increments, until the last ice crystal was observed. Once thawing was complete, the cryobag was removed from the VIA Thaw unit and transferred to a BSC for further processing.
Reactivation and expansion of thawed cells
T cell reactivation was performed to verify the T cell growth and activity post-thaw. A 5 mL sample of thawed cells was transferred from the cryobag to a centrifuge tube and diluted with 25 mL of complete medium prior to centrifugation at 400 × g for 5 min at room temperature. After centrifugation, the supernatant was discarded, and the cell pellet was resuspended in 25 mL complete media. A cell count was performed with three technical replicates. Viable cell density was then adjusted to 1 × 10⁶ cells/mL with medium. These T cells were seeded in 3.3 mL/well in 6-well tissue culture plates with three biological replicates. A 300 µL sample was taken from each well and used to measure post-seed cell count and viability. The plates were kept in an incubator overnight.
The next day (24 h after seeding), 25 µL/mL of ImmunoCult Human CD3/CD28/CD2 T Cell Activators was added to each well. T cells were left undisturbed for 72 h to prevent disruption of T-cell aggregates during the activation phase. Cells were sampled daily from days 4 to 6 and maintained at 5 × 10⁵ viable cells/mL. On day 6, a final cell count and flow cytometry were performed to assess phenotype.
Analytics
Cell count and viability of thawed cells
Cell density and viability measurements were performed on a NucleoCounter™ NC-200™ Automated Cell Counter.
Phenotypic analysis of thawed cells
T cells were characterized through flow cytometry to study the effect of the two thawing methods on cellular phenotype. Cell samples were prepared by washing 1 × 10⁶ cells/test and then blocked with human FcR Blocking Reagent (Miltenyi Biotec) prior to staining with antibodies from BD Biosciences for the following markers (fluorophores specified in parentheses): 7-AAD (PerCPCY5.5), CD3 (BV510), CD4 (APC-H7), CD8 (BV650), and CD25 (BV786). The stained cells were then run on a CytoFLEX™ cytometer (Beckman Coulter). FlowJo™ version 10 was used to analyze flow cytometry data.
Demonstration of VIA Thaw L1000/CB1000 comparability
Current clinical practice for thawing cryopreserved cell therapies in cryobags involves immersing the cryobag into a 37°C water bath until no frozen material is visible. However, water baths provide poor control over the thawing process, no record of the thawing, and may add a contamination risk for the biological specimen. Automatic, dry thawing instruments have been developed to address these needs; in particular, the VIA Thaw series from Cytiva provides an excellent alternative to conventional methods. The initial release in this series, known as CB1000, has now been upgraded to L1000 (intended for research or manufacturing use only) with improvements to the electronics, software, and safety (see Table S1 for further details about differences between VIA Thaw instruments). To permit the VIA Thaw L1000 to be adopted in place of CB1000, biological samples thawed using either VIA Thaw instrument should be equivalent.
Note: VIA Thaw L1000 is intended for research or manufacturing use only. It is not intended for clinical procedures or for diagnostic purposes
Here we present a head-to-head comparison of the CB1000 and L1000 instruments, examining the following: a) thawing time and b) the immediate post-thaw viable cell loss obtained after thawing cryopreserved Jurkat cell suspensions (an immortalized type of T-lymphocyte cells) in cryobags of different sizes and fill volumes. The data shows that, overall, the two instruments demonstrate comparable performance, motivating the use of the newer models for cell and gene therapy workflows.
Table S1. Major differences between the VIA Thaw instruments
| Feature | CB1000 | L1000 | Why it’s relevant |
|---|---|---|---|
| Instrument type and environment of use | Laboratory instrument. For laboratory or manufacturing environment |
Laboratory instrument. For laboratory or manufacturing environment. *not intended for clinical procedures or for diagnostic purposes. |
Wider application settings and distinct environment |
| Cryobag picture at the end process | Yes | Yes | Optional picture to be included in process report for completeness |
| Load alarm and time alarm can be disabled | No | Yes | Increased customization for L1000 |
| Icon-based graphical user interface | No | Yes | Easier user experience |
| Redundancy for LEDs | No | Yes | Augmented safety levels |
| Plates heating between thawing runs | Off | On | Thawers remain ready to use |
| Hardware safety interlock | No | Yes | Heaters are hard stopped if any plate gets above 37°C |
| Thawing tray | With magnetic lock | Updated manufacturing, mechanical lock | Easier to install |
| Lid hinges and agitators | Yes | Upgraded | Increased components lifespan |
| Infrared (IR) sensor reading | Improper temperature measurement when lid is open | Temperature measurement suspended when lid is open | More accurate thaw end point detection |
| Electrical power source used to heat the plates | Mains voltage | 48 V | 48 V: intrinsically safer voltage while delivering the same heating |
Experimental details
Cell cultureJurkat, Clone E6-1, TIB-152 (Sigma-Aldrich) was used, cultured in RPMI-1640 medium (Sigma-Aldrich), supplemented with 10% v/v iron fortified fetal calf serum (Sigma-Aldrich), 2% v/v penicillin-streptomycin (Sigma-Aldrich), and 1% v/v amphotericin B solution (Sigma-Aldrich). This supplemented medium is hereafter referred to as complete culture medium (CCM). A series of culture flasks (ThermoFisher Scientific) containing CCM was seeded and maintained at a cell density of 0.5 × 10⁶ cells/mL (initial volume: 10 mL) by daily addition of fresh CCM. Incubation was carried out in a humidified incubator at 37˚C with 5% CO2. Cells were harvested when required. To do so, the cell suspensions were transferred to 50 mL centrifuge tubes (Sigma-Aldrich) and centrifuged at 1200 rpm for 4 min in a Heraeus™ Megafuge™ 16 centrifuge equipped with a 3655-swinging bucket rotor (ThermoFisher Scientific). The supernatants were discarded, and the cell pellets were pooled and then resuspended in a small volume of CCM.
CryopreservationSuspensions of Jurkat cells were prepared in CCM containing 5% v/v DMSO (Sigma-Aldrich) at 1 × 10⁶ cells per mL. A 100 μL sample of this final cell suspension was removed for cell count and viability estimation (prefreeze condition) and the rest was transferred to cryobags (Miltenyi Biotec, CryoMACS™ freezing bags 50 and 250), at final fill volumes of 10, 20, 30, 50, and 68 mL. Cryobags were inserted in cryocassettes (ThermoFisher) and fitted on dedicated adaptor plates (adjustable rack for multiple bags and foam lid spacer, #ASY_30144 and #VF2_30025, Cytiva) then placed in a 4°C precooled VIA Freeze Quad controlled rate freezer (Cytiva). A cooling rate of -0.75˚C/min was applied down to -80°C, including a 30 min hold at -35°C to allow dispersion of heat generated by crystallization. At the end of the freezing cycle, samples were transferred to an ultra-low temperature freezer (-150˚C, Panasonic) and stored overnight before thawing.
ThawingA VIA Thaw CB1000 unit and an L1000 unit were set to the appropriate fill volume and allowed to prewarm before starting any process. Pairs of equivalent cryobags (same cell culture, cryobag type, fill volume, and freezing batch) were removed from cryogenic storage and transported to the laboratory on dry ice. One bag was thawed in the VIA Thaw CB1000 and the other in the VIA Thaw L1000, in an alternating order from one pair to the next. As soon as the end of thaw was triggered by the VIA Thaw units, the sample cryobags were visually inspected and left to thaw for an additional 60 s if pieces of ice larger than approximately 1 cm in diameter remained inside. When considered effectively thawed, the cryobag samples were transferred to a biosafety cabinet, homogenized, and 100 μL of the thawed cell suspensions were immediately sampled for cell count and viability estimation (post-thaw condition). Thawing times were also recorded.
Cell count and viability estimation pre-freeze and immediately post-thaw were determined using an automated cell counter (NucleoCounter NC-200, ChemoMetech) and Via1-Cassette™ cassettes (ChemoMetech). Viable cell loss, expressed as millions of cells per mL (106 cells/mL), was calculated as follows:
Viable cell loss = cell countprefreeze × cell viabilityprefreeze / 100 – cell countpost-thaw × cell viabilitypost-thaw / 100
Results and discussion
Except at the lowest fill volume of 10 mL, thawing of cryobags took significantly longer (p values ≤ 0.014 by t-test) when using the VIA Thaw L1000 compared to the CB1000 (Table S2). Despite longer thawing times, however, post-thaw viable cell loss was not significantly different between samples thawed in either instrument (p = 0.96, Fig S1). A tendency toward greater consistency in this data for samples thawed in the L1000 can also be noted through the spread of the datapoints (Fig S1).
Longer thawing times in the VIA Thaw L1000 could have been caused by the improvements made to the electronics, software, and safety compared to the CB1000. A first possible explanation comes from the algorithm that determines the end of thaw, which has been updated. The final responsibility to decide whether a sample is effectively thawed or not, however, remains with the operator. A second explanation comes from the control loop mechanism employed for temperature monitoring of VIA Thaw plate heaters, as the setpoint is more accurately maintained by L1000 instruments.
As shown by Baboo et al. for T cells cryopreserved at different cooling rates, when freezing is conducted at a slow-enough rate – a rate that leads to the formation of the maximum amount of crystalline ice and leaves no room for ice-recrystallization events during thawing (also termed ‘equilibrium freezing’) – the rate of thawing does not impact cell viability and viable cell numbers immediately post-thaw.1A The present results agree with this finding.
Table S2. Comparison of the average thawing times for each automated dry thawing instrument as a function of cryobag fill volume (t-test p values are indicated)
| Thawing times (in min, n = 6) | |||||
|---|---|---|---|---|---|
| CB1000 | L1000/MD1000 | t-test | |||
| Cryobag type and fill volume | Average | SD | Average | SD | p values |
| CryoMACS-50, 10 mL | 4.63 | 0.69 | 4.82 | 0.54 | 0.613 |
| CryoMACS-50, 20 mL | 4.75 | 0.43 | 7.00 | 0.48 | <0.01 |
| CryoMACS-250, 30 mL | 5.29 | 0.72 | 7.26 | 1.28 | 0.014 |
| CryoMACS-250, 50 mL | 5.98 | 0.23 | 8.74 | 0.19 | <0.01 |
| CryoMACS-250, 68 mL | 6.61 | 0.35 | 8.91 | 0.45 | <0.01 |
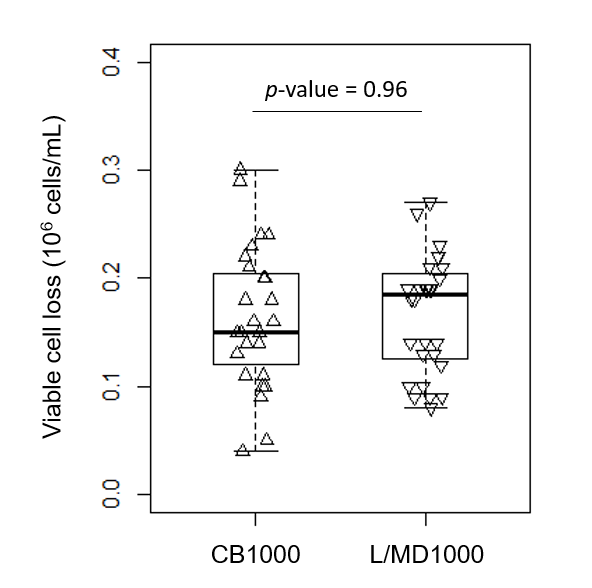
Fig S1. Immediate post-thaw viable cell loss of cryopreserved Jurkat cell suspensions thawed either in the VIA Thaw CB1000 or the VIA Thaw L1000 (t-test p value is indicated).
Conclusion
Despite requiring different lengths of time to completely thaw cryobags of different sizes and fill volumes, using a VIA Thaw CB1000 or a VIA Thaw L1000 did not result in a significant difference in viable cell loss measured immediately post-thaw for cryopreserved suspensions of Jurkat cells.
In conclusion, the new VIA Thaw L1000 appears equivalent to the previously available model (CB1000) for the automatic dry thaw of cryopreserved cells under the conditions outlined in this study. Using immortalized lymphocyte T-cell suspensions at a density of 1 × 10⁶ cells/mL in 5% DMSO in cryobags, we demonstrated equivalent performance using a wide range of fill volumes. The range tested in this study covers the range recommended by the cryobag manufacturer and also includes the volumes used for commercially available cryopreserved cell therapies (Yescarta™ and Kymriah™ formulations)2A-5A, with the advantage of providing better control of the sample thawing process.
Appendix references
1A. Baboo J, Kilbride P, Delahaye M, et al. The impact of varying cooling and thawing rates on the quality of cryopreserved human peripheral blood T cells. Sci Rep. 2019 Mar 4;9(1):3417. https://doi.org/10.1038/s41598-019-39957-x.
2A. Kite Pharma Inc. Yescarta Product Monograph. 2019, revised 2020.
3A. Novartis. Kymriah Product Monograph. 2018.
4A. European Medicines Agency. Yescarta: EPAR – Product Information, https://www.ema.europa.eu/en/medicines/human/EPAR/yescarta. Accessed November 22, 2020.
5A. European Medicines Agency. Kymriah: EPAR – Product Information, https://www.ema.europa.eu/en/medicines/human/EPAR/kymriah. Accessed November 22, 2020.