This whitepaper is part of Biacore™ system SPR applications series.
In this series, we explore how Biacore™ SPR technology supports a wide range of applications—from membrane protein analysis to fragment screening, ADCs, and beyond. Each article highlights real-world data and use cases to help researchers get the most out of SPR and label-free interaction analysis.
Key takeaways:
- Biosimilars have increased in popularity due to the patent expiry of multiple blockbuster drugs.
- Extensive analysis is necessary to demonstrate that the biosimilar shows sufficient similarity to the reference biologic with respect to critical quality attributes (CQAs).
- Biacore™ SPR technology is a key tool in biosimilar analysis. It produces robust, reliable, and detailed binding kinetic data, and performs comparability assessment—the unique feature that generates an easily interpreted similarity score.
Introduction to biosimilars
Biosimilars are medicines that are highly similar to an already licensed medicine in terms of quality, safety, and efficacy (1). In order for the biosimilar to be licensed, it must be shown to work in a similar manner to the reference biologic for all approved indications through extensive analytical, nonclinical, and clinical biosimilar comparability studies (2). The number of biosimilars entering the market has increased rapidly since the approval of the first biosimilar in 2006 by the European Medicines Agency (EMA), with 126 biosimilars now approved by the EMA as of June 2025 (3, 4). This boom in biosimilars arose due to multiple “patent cliffs” over the past 20 years, where the patents for various blockbuster drugs have expired (5). The expiration of patents results in a loss of exclusivity, enabling the development and production of biosimilars. R&D costs are lower for biosimilar production, as extensive efficacy and safety evaluations have already been performed for the reference biologic (6). As a result, biosimilars can be sold at much lower prices, benefiting both healthcare systems and patients (7).
With an increasing number of drugs approaching patent expiry, the biosimilars market is predicted to expand even further (8). However, analytical hurdles in the development and validation of biosimilars remain.
Challenges in biosimilar development
Regulatory requirements for biosimilars
The regulatory requirements surrounding biosimilar development focus on demonstrating sufficient similarity to the reference product. Specific legal pathways and guidelines are region-specific, but common requirements include the assessment of quality, safety, efficacy, and robust comparability in various critical quality attributes (CQAs) that form the key characteristics of the reference biologic (9). The FDA uses an abbreviated licensure pathway for biosimilars under the 351(k) Public Health Service Act (10). The EMA requires adherence to its Guideline on Similar Biological Medicinal Products (11). These guidelines ensure that the biological activity, stability, and purity of the biosimilar are equivalent to the reference biologic, ultimately enabling the production of clinically effective and safe biosimilars (12).
Difficulties in meeting regulatory requirements
Regulatory approval requires full comparative analytical assessments (CAA) demonstrating functional and structural similarities (9). However, biologics are complex products, making accurate comparison challenging with current analytical techniques. Post-translational modifications (PTMs) of the biologic can occur during the manufacturing process, altering the key characteristics of the biologic, such as potency, pharmacokinetics, and immunogenicity (13). Analytical techniques used to assess biosimilars must be sufficiently sensitive and have a high enough resolution to assess the potential effects of post-translational modifications. The biosimilar must be compared to representative lots of the reference biologic so biosimilar comparability studies are reliable while considering lot-to-lot variation. To efficiently investigate a wide range of lots, researchers require high-throughput technology. In addition, standardized protocols and robust validation procedures are essential for minimizing assay variability and the production of consistent, reproducible results for regulatory approval.
Recommended assay formats
Regulators require a wide range of assays to comprehensively cover similarities between the biosimilar versus the reference biologic. Commonly recommended assays include (14):
- Primary structure and PTM mapping: peptide mapping combined with LC-MS
- Higher order structure: circular dichroism spectroscopy, Fourier-transform infrared spectroscopy, differential scanning calorimetry
- Charge and size variant analysis: size-exclusion chromatography (SEC-HPLC)
- Target binding including binding similarity compared to reference product–surface plasmon resonance (SPR)
- Fc receptor binding: SPR
- Effector functions: ADCC (antibody-dependent cellular cytotoxicity) assay
Surface plasmon resonance technology overview
Surface plasmon resonance (SPR) is an optical technique used to investigate interactions between biomolecules (15). Polarized light hitting an SPR sensor chip at an angle of internal reflection generates electron density waves, known as plasmons. At a specific resonance angle, the plasmons absorb energy. One of the interactants, the ligand, is attached to an SPR sensor chip. The other interactant, the analyte, is injected in solution over the sensor surface. When the analyte binds to the ligand, the mass on the SPR sensor surface changes. This causes a change in the resonance angle proportional to the change in mass at the surface. The resulting plot, known as a sensorgram records the real-time binding response (Fig 1). Analysis of the sensorgram enables characterization of binding kinetics and affinity measurements, determination of concentration, and biosimilar comparability studies. SPR is endorsed by regulatory authorities for ligand binding analysis and comparability assessment.
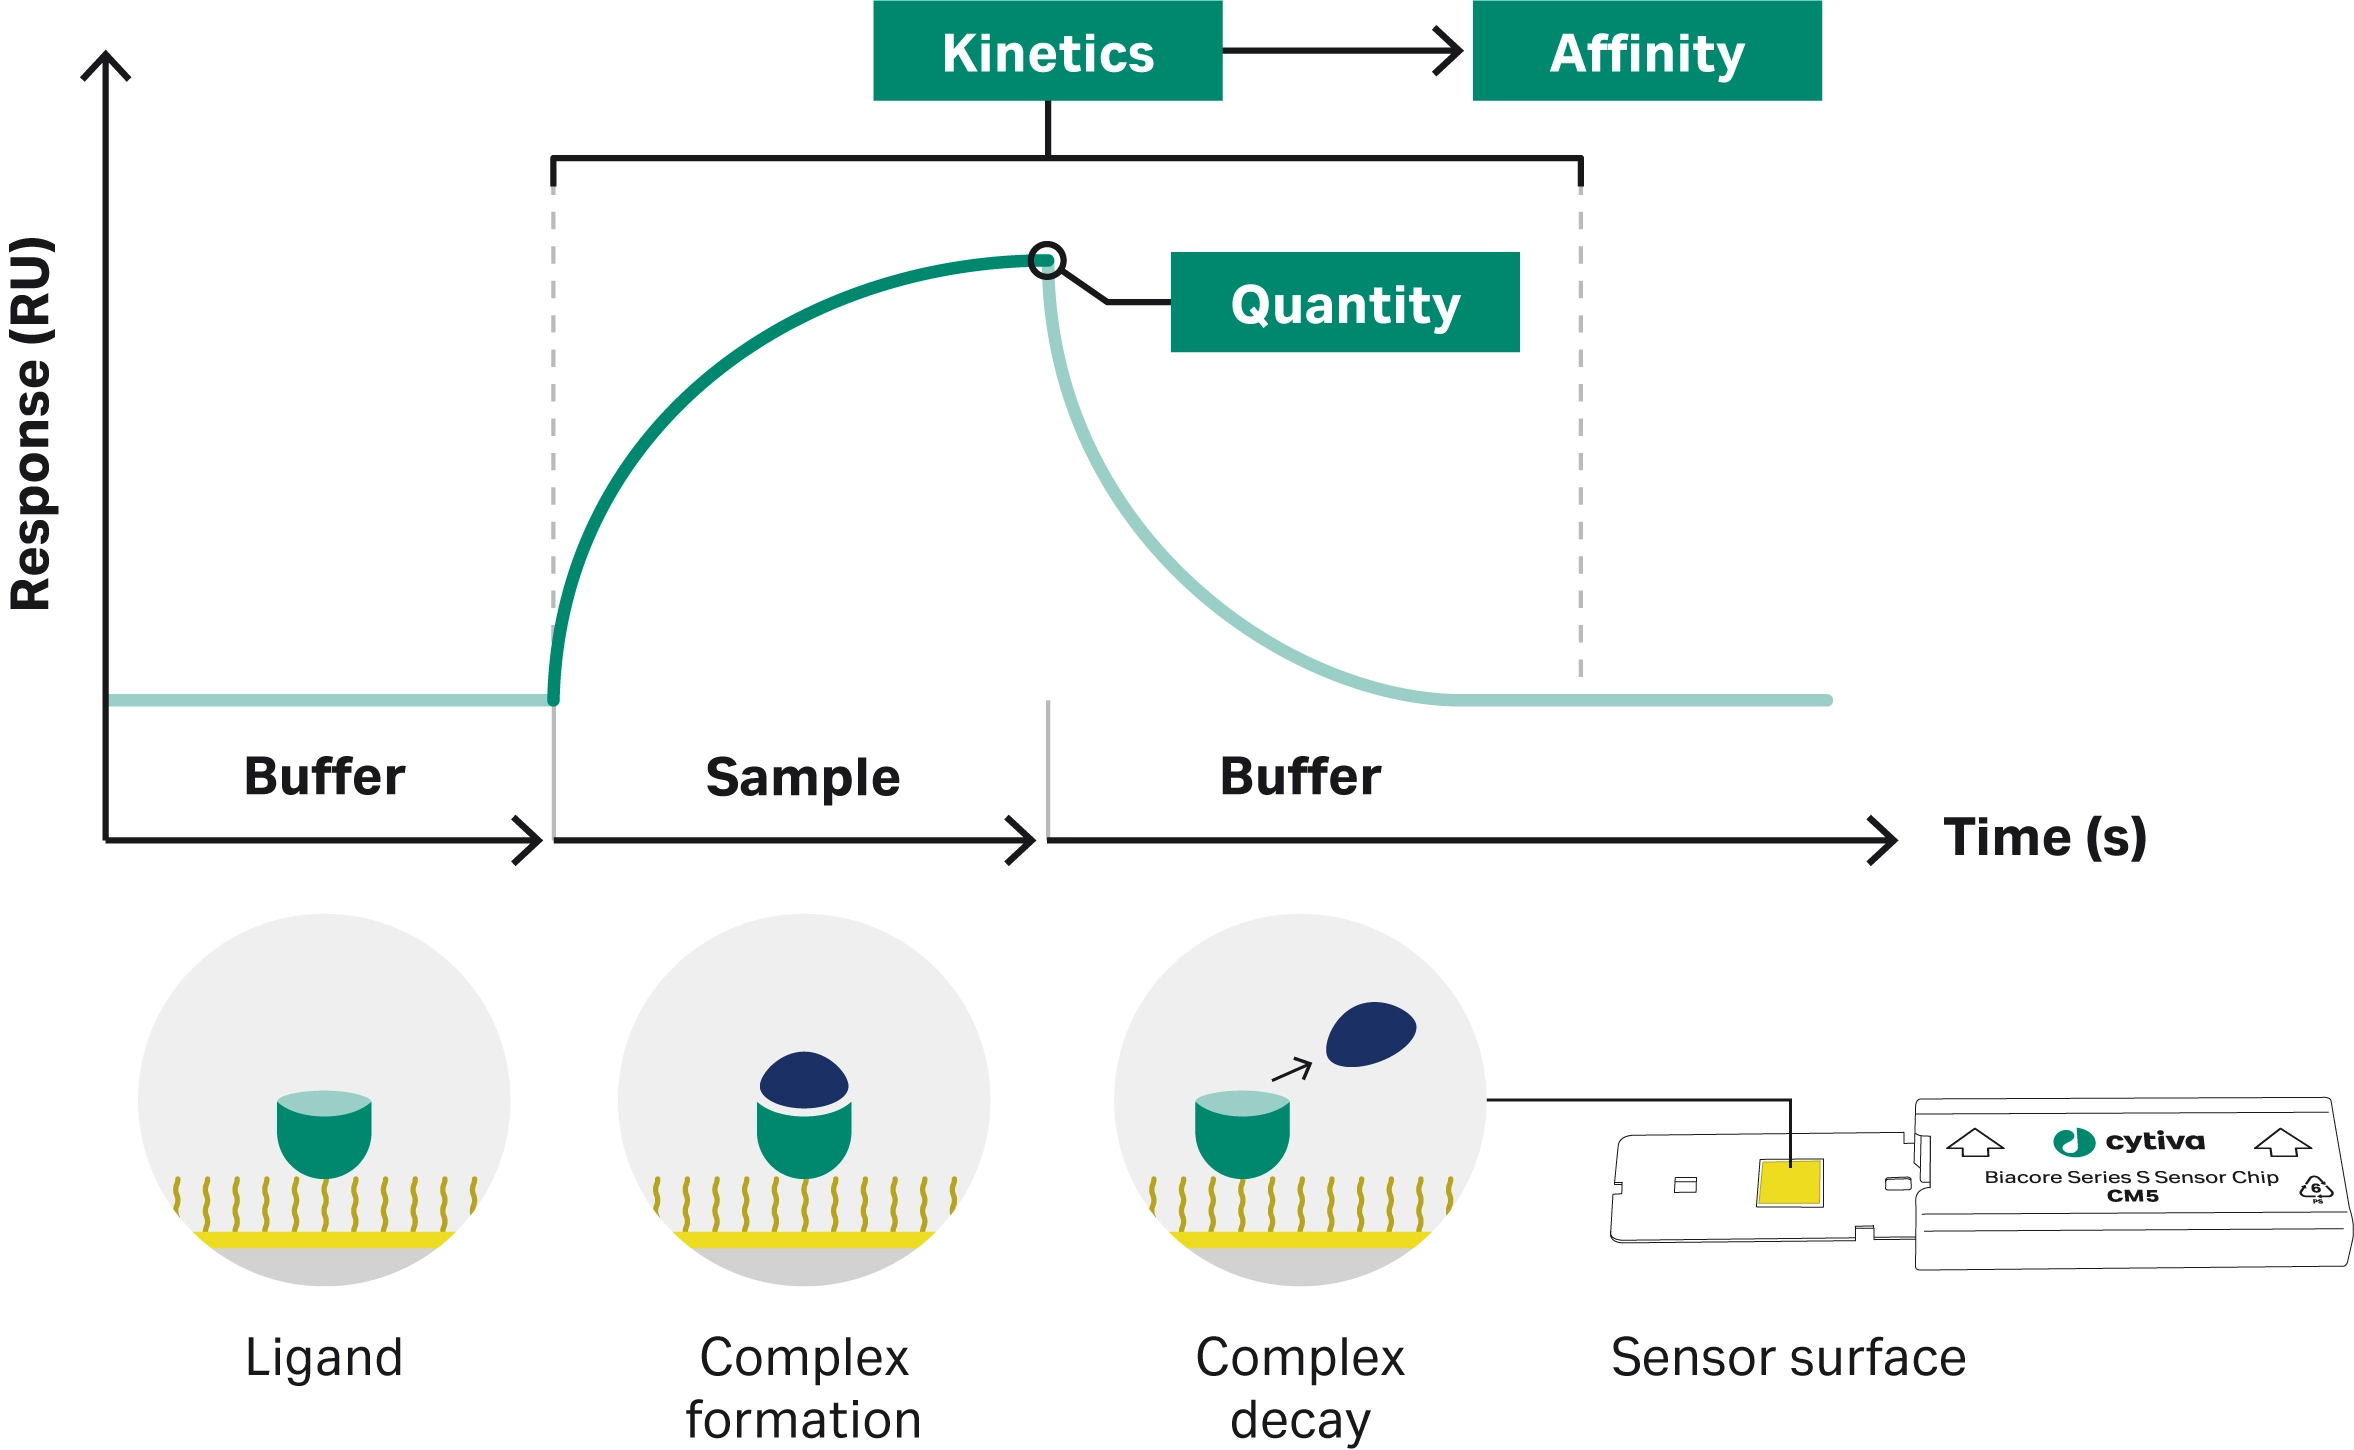
Fig 1. An example sensorgram. The bars below the graph represent the solutions passing over the SPR sensor surface.
What role does Biacore™ SPR technology play in biosimilar development and validation?
The use of Biacore™ SPR technology forms a crucial step in assessing CQAs of the biosimilar as part of comparative analytical assessments.
Determining target protein binding kinetics and affinity parameters
The interactions between a biologic and its target protein are a crucial aspect of how the biologic functions. It’s essential that biosimilar interactions with target proteins are compared to the reference biologic to confirm that the binding characteristics are sufficiently similar.
Biacore SPR technology is an important tool used by many researchers to compare the binding kinetics of the biosimilar to the target protein. Xie et al. used Biacore SPR technology in their assessment of a trastuzumab (Herceptin) biosimilar, HLX02 (16). Trastuzumab is a monoclonal antibody that binds to HER2 to inhibit the survival of HER2-positive cancers. Therefore, Xie et al. assessed binding of the biosimilar to HER2 using Biacore SPR technology and demonstrated that the biosimilar had similar binding to the reference biologic (trastuzumab).
Magnenat et al. investigated an adalimumab biosimilar, MSB11022 (17). Adalimumab is a monoclonal antibody targeting tumor necrosis factor (TNF). It is used in the treatment of autoimmune and inflammatory diseases, such as rheumatoid arthritis, Crohn’s disease, and psoriasis through its inhibition of TNF-mediated cytokine effects. Biacore SPR technology was used to determine that the biosimilar showed similar binding affinity measurements to soluble TNF compared to the reference biologic. Etanercept is also a TNF-blocking drug used to treat autoimmune and inflammatory diseases. It is a recombinant DNA dimeric fusion protein that contains two copies of the ligand-binding region of the TNF receptor. Hofmann et al. assessed the binding kinetics of an etanercept biosimilar, GP2015, to TNF using Biacore SPR technology (18). They demonstrated that the biosimilar bound to TNF with similar binding kinetics to etanercept.
Shibata et al. used Biacore SPR technology in the assessment of multiple biosimilars to various drugs, including trastuzumab, etanercept, and rituximab (19). They used Biacore SPR technology to assess the binding of the biosimilars to their target. They chose to test both methods of evaluating binding affinity by coupling the antigen onto the SPR sensor chip in one method and injecting the antigen as an analyte in the second method (Fig 2, Fig 3). They then compared the quality of the sensorgrams produced and the degree of model fit, choosing the most appropriate method for analysis. The binding interactions were determined to be sufficiently similar, although lot-to-lot variations were seen in the trastuzumab biosimilars, and the etanercept and rituximab biosimilars showed slightly weaker binding affinities.
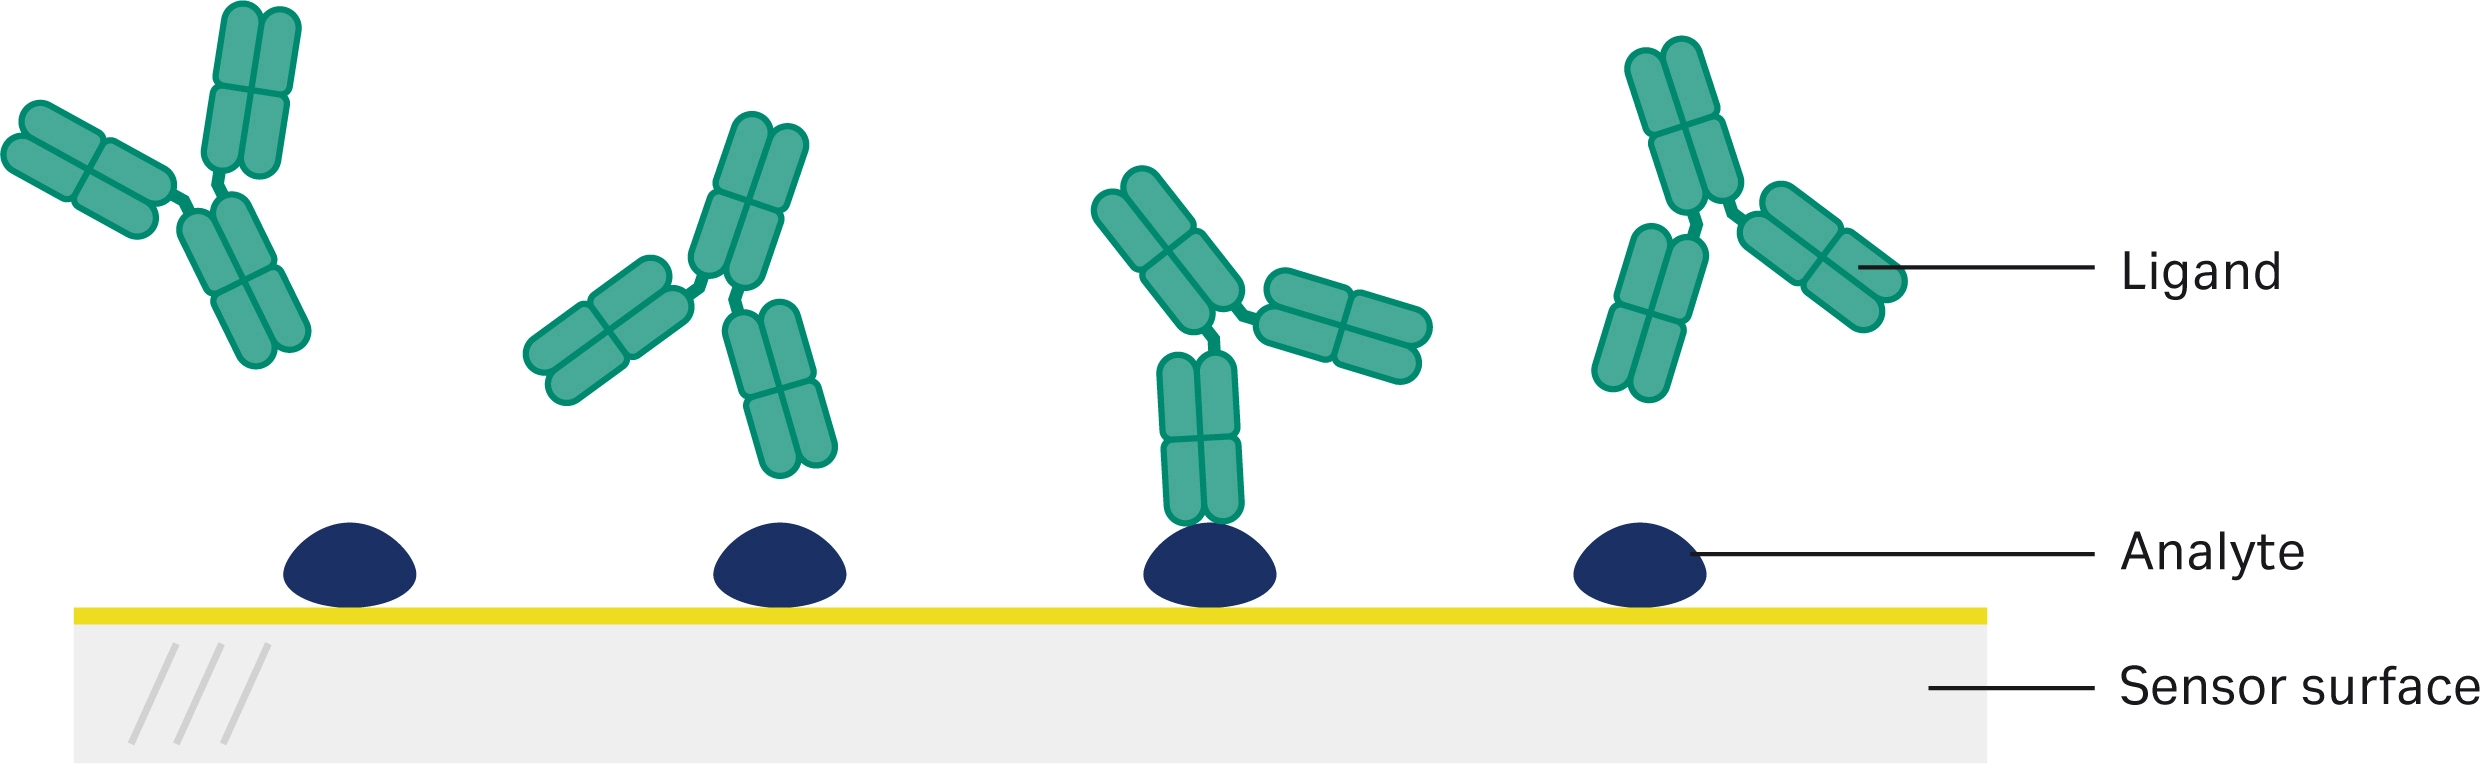
Fig 2. Illustration of first method with analyte/antigen attached to the sensor surface and antibody injected as sample to compare binding with method two.
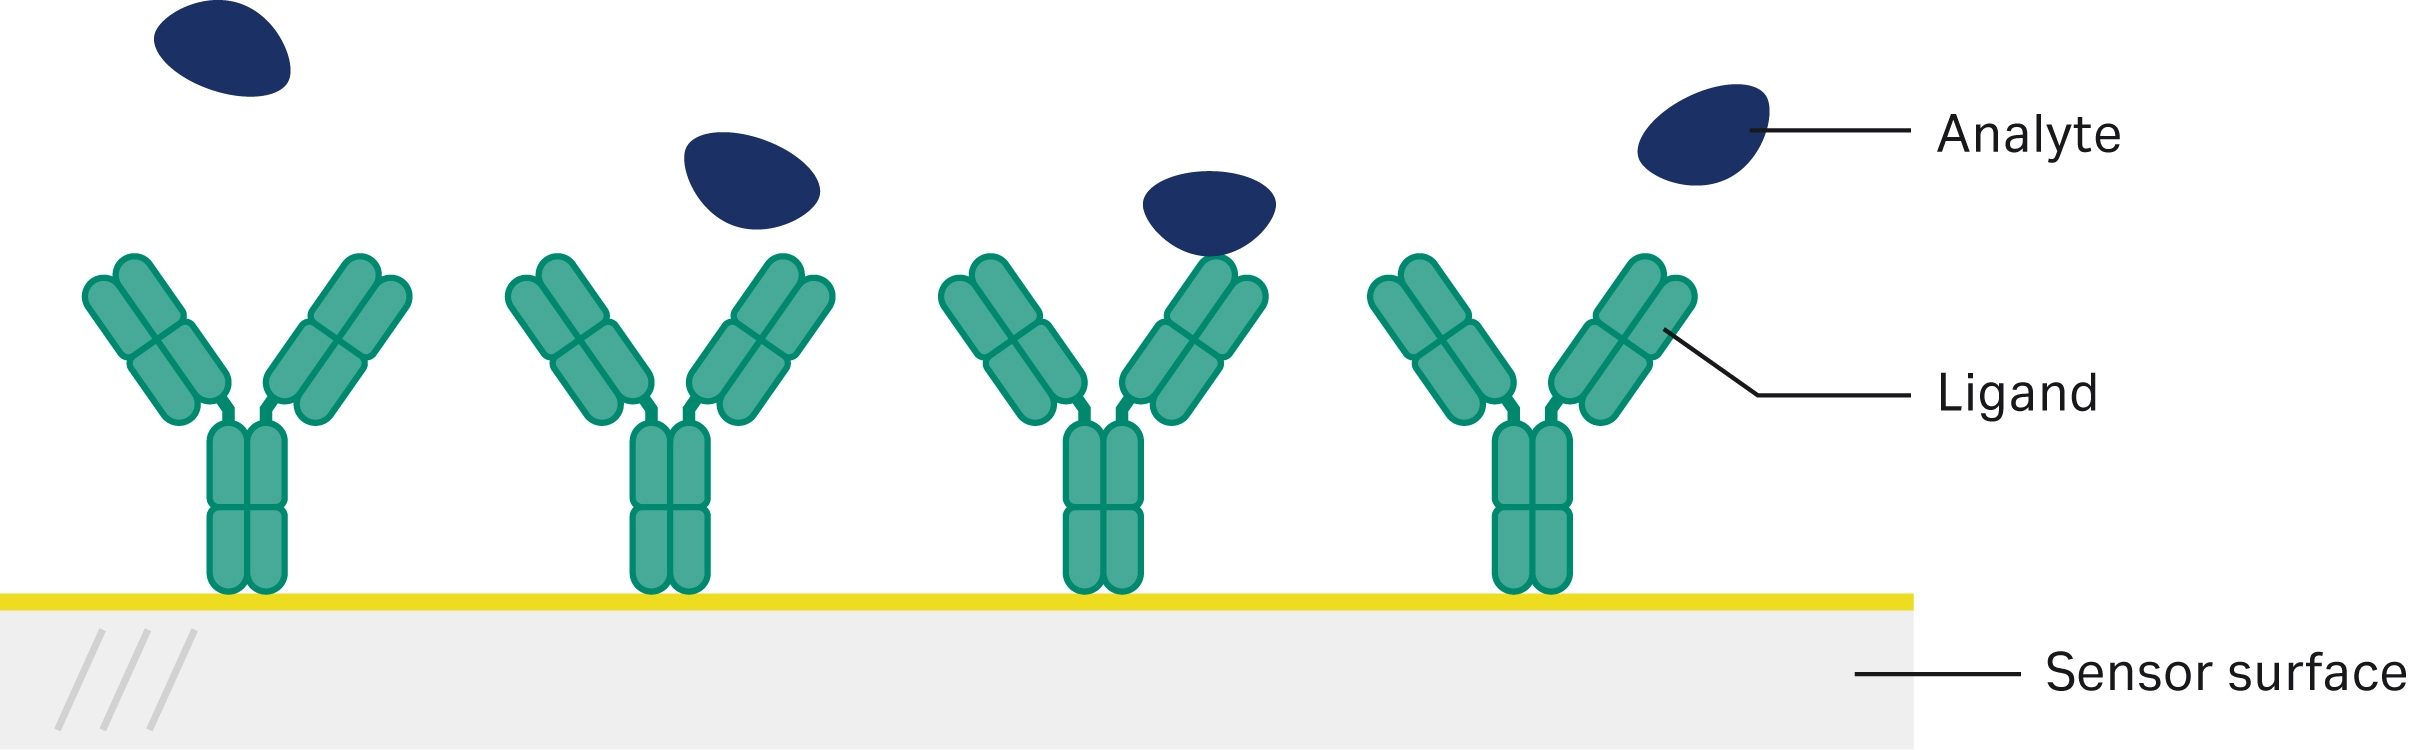
Fig 3. Illustration of second method with antibody/biosimilar attached to the sensor surface and antigen/analyte injected as sample to compare binding with method one.
Many other studies also assess the binding of biosimilars to antigens using Biacore SPR technology, which demonstrates its widespread use in CQA assessments and its importance in the development of biosimilars with similar target binding affinity to the reference biologic (20, 21).
SPR-based methods for biosimilar Fc receptor binding analysis
In addition to assessing the binding characteristics of prospective biosimilars, it is also essential to carry out Fc receptor binding assays to investigate how biosimilars may differ regarding their binding to various Fc receptors (Fig 4).
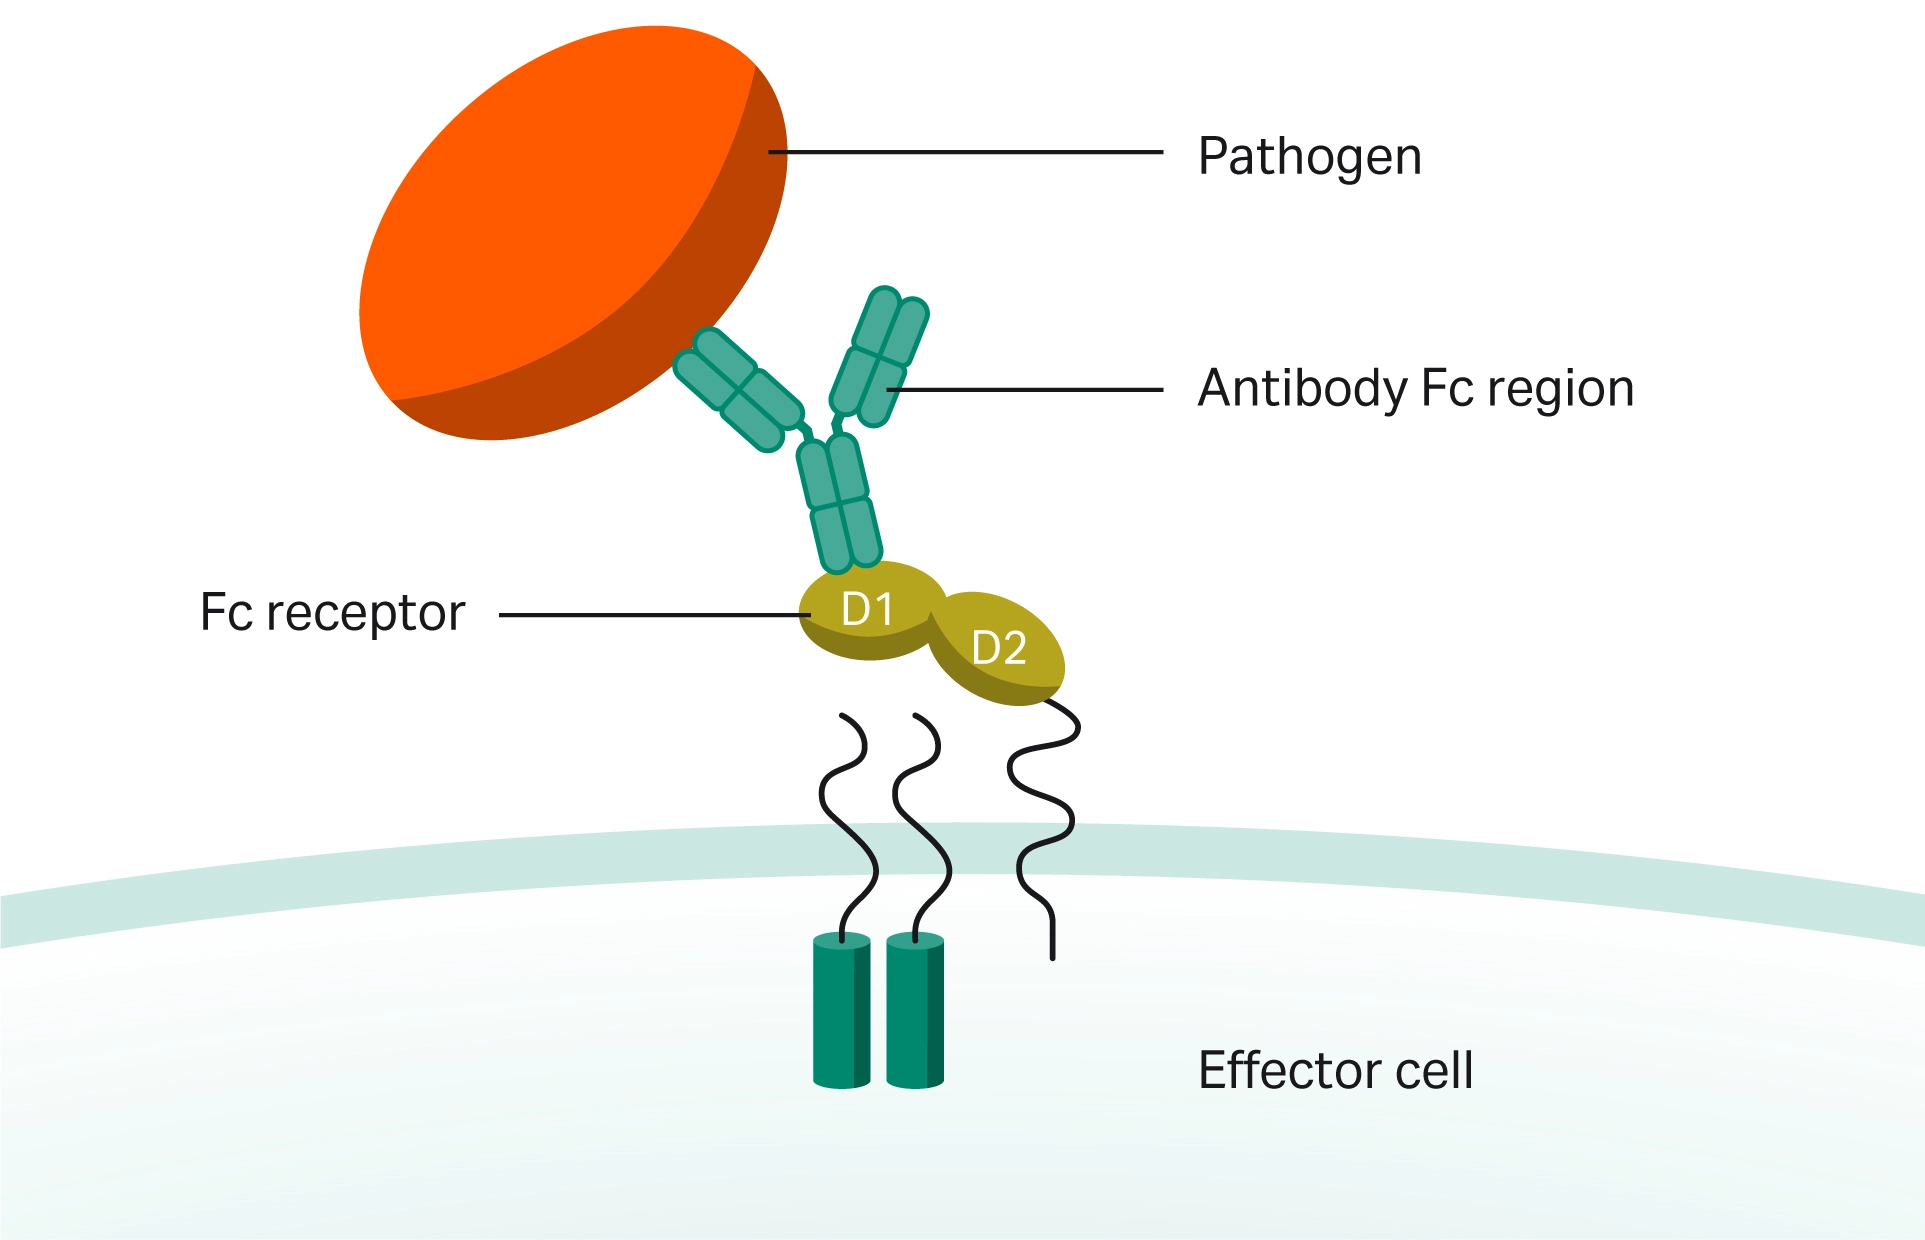
Fig 4. Antibody interaction of Fc receptors on the cell surface of effector cells such B lymphocytes, natural killer cells, macrophages, human platelets, and mast cells with antigen-bound antibodies.
Many biologics, particularly monoclonal antibodies, function through Fc gamma receptors. The binding of the biologic to Fc gamma receptors may be essential for the cytotoxicity function of the biologic, including antibody-dependent cell-mediated cytotoxicity (ADCC), complement-dependent cytotoxicity (CDC), and antibody-dependent cellular phagocytosis (22, 23). Therefore, altered binding by the biosimilar compared to the reference biologic may decrease the efficacy of the biosimilar. Binding to neonatal Fc receptors (FcRn) is also important in biosimilar validation, as altered FcRn binding has the potential to affect biosimilar pharmacodynamics, pharmacokinetics, and antibody half-life in the body (23). Altered binding to Fc receptors can also impact safety through enhanced immunogenicity.
Rituximab is a monoclonal antibody that targets CD20-positive B cells, enabling its use in the treatment of blood cancers, autoimmune diseases, and inflammatory diseases. The Fc region of the antibody is crucial to activating ADCC and CDC mechanisms, which ultimately lead to the death of the targeted B cells (24). Rituximab biosimilars must demonstrate similar Fc binding capabilities. Visser et al. used Biacore SPR technology to assess the binding affinity of the biosimilar to multiple Fc gamma receptors (FcγRI, FcγRII, FcγRIII) and to FcRn, demonstrating that the affinity constants were comparable with the reference biologic (25). A different rituximab biosimilar was investigated by Lee et al (26). They compared the binding affinities of the biosimilar to different Fc gamma receptors and FcRn with the reference biologic using Biacore SPR technology, similarly demonstrating highly comparable binding affinities. They also carried out ADCC and CDC assays to confirm the similarity between the biosimilar and reference biologic concerning ADCC and CDC activity. Rituximab was the first therapeutic mAb approved for use in oncology, and its ability to target CD20-positive B cells has extended its use, making it a key therapeutic for multiple diseases. Further studies investigated different rituximab biosimilars, many of which utilize Biacore SPR technology in Fc receptor binding assays (19, 27, 28).
Trastuzumab is another drug reliant on Fc receptor binding to drive its therapeutic function. Jassem et al. compared four lots of their biosimilar, ABP 980, to three lots of the US reference biologic and three lots of the EU reference biologic (29). They used Biacore SPR technology to assess the binding affinities of each lot for multiple Fc gamma receptors, with the Fc gamma receptors immobilized onto Biacore SPR sensor chips and the biosimilar or reference biologic injected into the system. They overlaid normalized average sensorgrams to directly compare sensorgram shapes (Fig 5). The majority of the sensorgrams were highly similar, although minor variability was seen for FcγRIIIa and FcγRIIIb binding during the association phase. This was determined not to affect the relative affinities or overall kinetic profile. Goyal et al. also compared the binding affinities of a trastuzumab biosimilar with the reference biologic (30). They used eleven batches of the biosimilar and ten batches each of the US and EU reference biologics to comprehensively assess binding characteristics across a wide range of batches, demonstrating similar Fc binding kinetics for all batches.
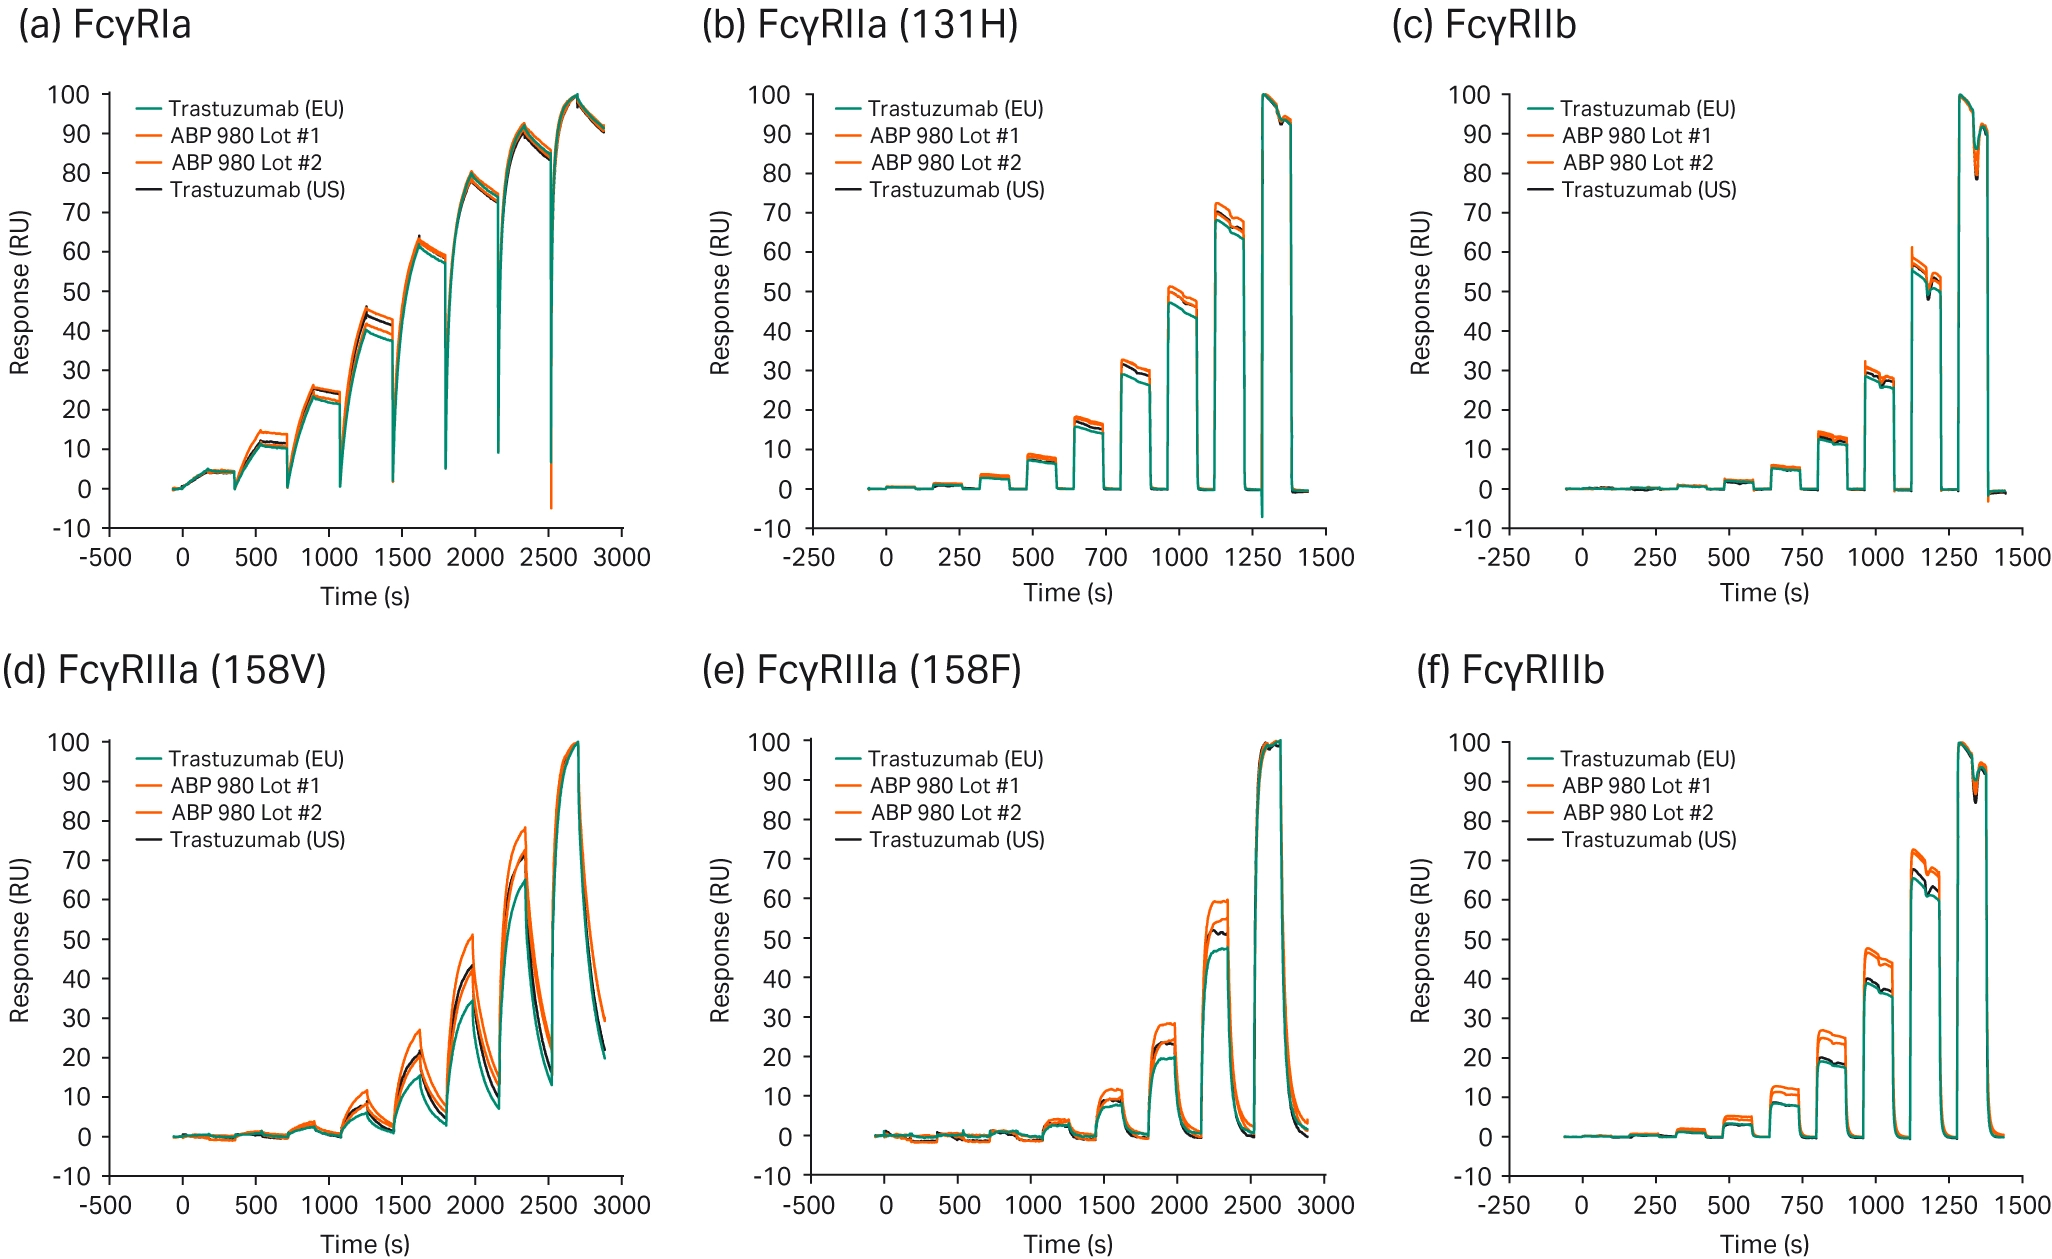
Fig 5. Representative sensorgram overlays comparing the biosimilar (ABP 980; red) to the US reference biologic (trastuzumab; black) and the EU reference biologic (trastuzumab; blue). Many other researchers determining binding affinities between their biosimilar and Fc receptors have also used Biacore SPR technology, demonstrating its importance in validating biosimilar binding to Fc receptors (16-20).
Assessing functional resilience
Post-translational modifications (PTMs), such as charge variance or glycosylation, can have detrimental effects on the potency and safety of biologics. These may include an impact on stability, pharmacokinetics, half-life in serum, and immunogenicity (31). Thus, it is important to compare PTMs between a biosimilar and its reference biologic to assess how PTM profiles may differ and whether any such differences affect CQAs.
Bevacizumab is an anti-vascular endothelial growth factor (VEGF) therapy used in oncology, such as colorectal cancer. It is a monoclonal antibody that binds to VEGF, preventing it from activating VEGF receptors, and therefore preventing VEGF from promoting endothelial cell proliferation and the formation of new blood vessels that facilitate tumor growth (32). Zhao et al. investigated whether changes to charge variant distribution in a bevacizumab biosimilar compared to bevacizumab affected the potency or pharmacokinetics of the biosimilar (33). They isolated acidic, basic, and main peak fractions in the biosimilar and used these fractions to assess the effect of charge variants on various properties of the biosimilar. Using Biacore SPR technology, they demonstrated that there were no significant differences in binding affinity measurements for VEGF165 between the isolated variants, the biosimilar, or the reference biologic (Table 1).
Table 1. Kinetic characterization of the isolated charge variants, the biosimilar, and the reference biologic (bevacizumab; brand name Avastin).
| Test material | ka1 (105 M-1 s-1)a | kd1 (10-5 s-1)a |
KD1 (10-10 M)a |
(%CV )b |
|---|---|---|---|---|
| Acidic variant | 1.05 ± 0.13 | 3.12 ± 0.25 |
2.9 ± 0.12 |
4.0 |
| Basic variant | 1.39 ± 0.2 | 3.63 ± 0.34 |
2.64 ± 0.13 |
4.9 |
| Main peak | 1.45 ± 0.14 | 3.02 ± 0.45 |
2.08 ± 0.16 |
7.6 |
| Biosimilar product | 1.19 ± 0.14 | 3.77 ± 0.2 |
3.18 ± 0.22 |
6.9 |
| Avastin |
1.27 ± 0.16 | 4.06 ± 0.23 |
3.21 ± 0.24 |
7.3 |
a ka1, association rate constant; kd1, first dissociation rate constant; KD1, dissociation equilibrium constant. All statistical analyses were performed using multiple regressions. Binding of Avastin to Human VEGF165 is shown for reference only.
b CV, coefficient of variation of n = 3
The effect of charge variants on a trastuzumab biosimilar was assessed by Torkashvand et al. to determine how physicochemical and pharmacokinetic properties were affected (34). Like the Zhao study, the acidic, basic, and main variants were separated, and then the Biacore biosimilar characterization was performed. Biacore SPR technology was used to assess the binding kinetics between the isolated charge variants and HER2 (the target protein) as well as the Fc receptors, FcγRIIIa, FcγRIIIb, and FcRn. The binding affinity measurements did not significantly differ between the different charge variant isolates binding HER2, FcγRIIIa, or FcγRIIIb. A small difference was seen in binding to FcRn, where the acidic and basic variants showed a higher KD. However, further experiments on pharmacokinetic parameters, such as half-life, demonstrated no significant differences (Table 2).
Table 2. Pharmacokinetic parameters (half-life, AUC, Cmax, and Tmax) and binding affinity parameters for the isolated charge variants.
| Samples | Half-life (h) | AUC0-28 (µg × day mL-1) | Cmax (µg mL-1) | Tmax (min) | Fc-FcRn affinity parameters | p I values | ||
|---|---|---|---|---|---|---|---|---|
| ka (M-1 s-1) | kd (s-1) | KD (M) | ||||||
| APs | 47.68 ± 7.24 | 625.4 ± 53.4 | 231.37 ± 22.12 | 5 ± 0 | 1.886 × 10⁵ | 0.16 | 8.718 × 10⁻⁷ | 8.1-8.4 |
| MP | 79.47 ± 16.44 | 953.8 ± 74.3 | 294.52 ± 25.32 | 5 ± 0 | 1.04 × 10⁵ | 0.0036 | 3.488 × 10⁻⁸ | 8.5 |
| BPs | 74.32 ± 14.53 | 772.0 ± 54.1 | 236.77 ± 24.41 | 5 ± 0 | 3.79 × 10⁵ | 0.2 | 5.377 × 10⁻⁷ | 8.6-8.7 |
On discovering that their rituximab biosimilar had differences in the relative abundance of glycans compared to the reference biologic, Xu et al. investigated whether these differences affected biological activity and immunological properties (27). They used Biacore SPR technology to assess how the binding affinity of FcRn and multiple Fc gamma receptors to the biosimilar differed from the reference biologic, demonstrating that the changes in the glycan moieties did not influence binding affinities.
These studies demonstrate the importance of Biacore SPR technology in assessing whether PTMs, such as charge variance or glycosylation, affect the binding capacity of prospective biosimilars.
Comparing batch-to-batch variation
Biologics can vary widely batch-to-batch. As a result, different biosimilar lots must be compared to a wide variety of batches of the reference biologic to ensure that similar binding properties are demonstrated across different lots.
To assess key CQAs of their proposed biosimilar compared to Filgrastim (the reference product), Sörgel et al. used Biacore SPR technology with a number of different batches of the biosimilar, EU filgrastim, and US filgrastim (35). They determined that variability in binding kinetics between each batch of filgrastim and the biosimilar was low, and no notable differences in binding kinetics were seen. Visser et al. similarly used Biacore SPR technology to compare the binding affinity of five batches of their biosimilar to seven batches of the reference biologic (25). They determined an originator range for binding kinetics and subsequently demonstrated that their biosimilar had binding kinetics consistently within this range. The focus of Shibata et al.’s research was on characterizing the lot-to-lot variation of biosimilars to their reference products in order to assess quality consistencies (19). They used Biacore SPR technology to compare different lots of biosimilars to the quality ranges of the reference batches. They demonstrated that while minor lot-to-lot variation was seen, there were no major differences between lots.
Multiple studies incorporating Biacore SPR technology have shown its effectiveness in assessing lot-to-lot variation to ultimately demonstrate the necessary similarities in binding kinetics between different batches/lots of the biosimilar and of the reference product.
What is the Biacore Sensorgram comparison tool?
Our unique Sensorgram comparison tool compares biosimilars to their originator drugs using Biacore SPR technology. This tool allows users to comprehensively compare binding curve shape and extend understanding beyond a simple comparison of affinity or kinetics without having to perform kinetic fitting. When only binding affinity between the biosimilar and reference biologic are compared, researchers risk missing important differences in association and dissociation. Biacore system Sensorgram comparison tool defines a reference curve from a reference standard and then compares samples to the curve (36). The similarity score is a percentage describing the extent to which the sample sensorgram falls inside the window of variation of the reference standard (Fig 6).
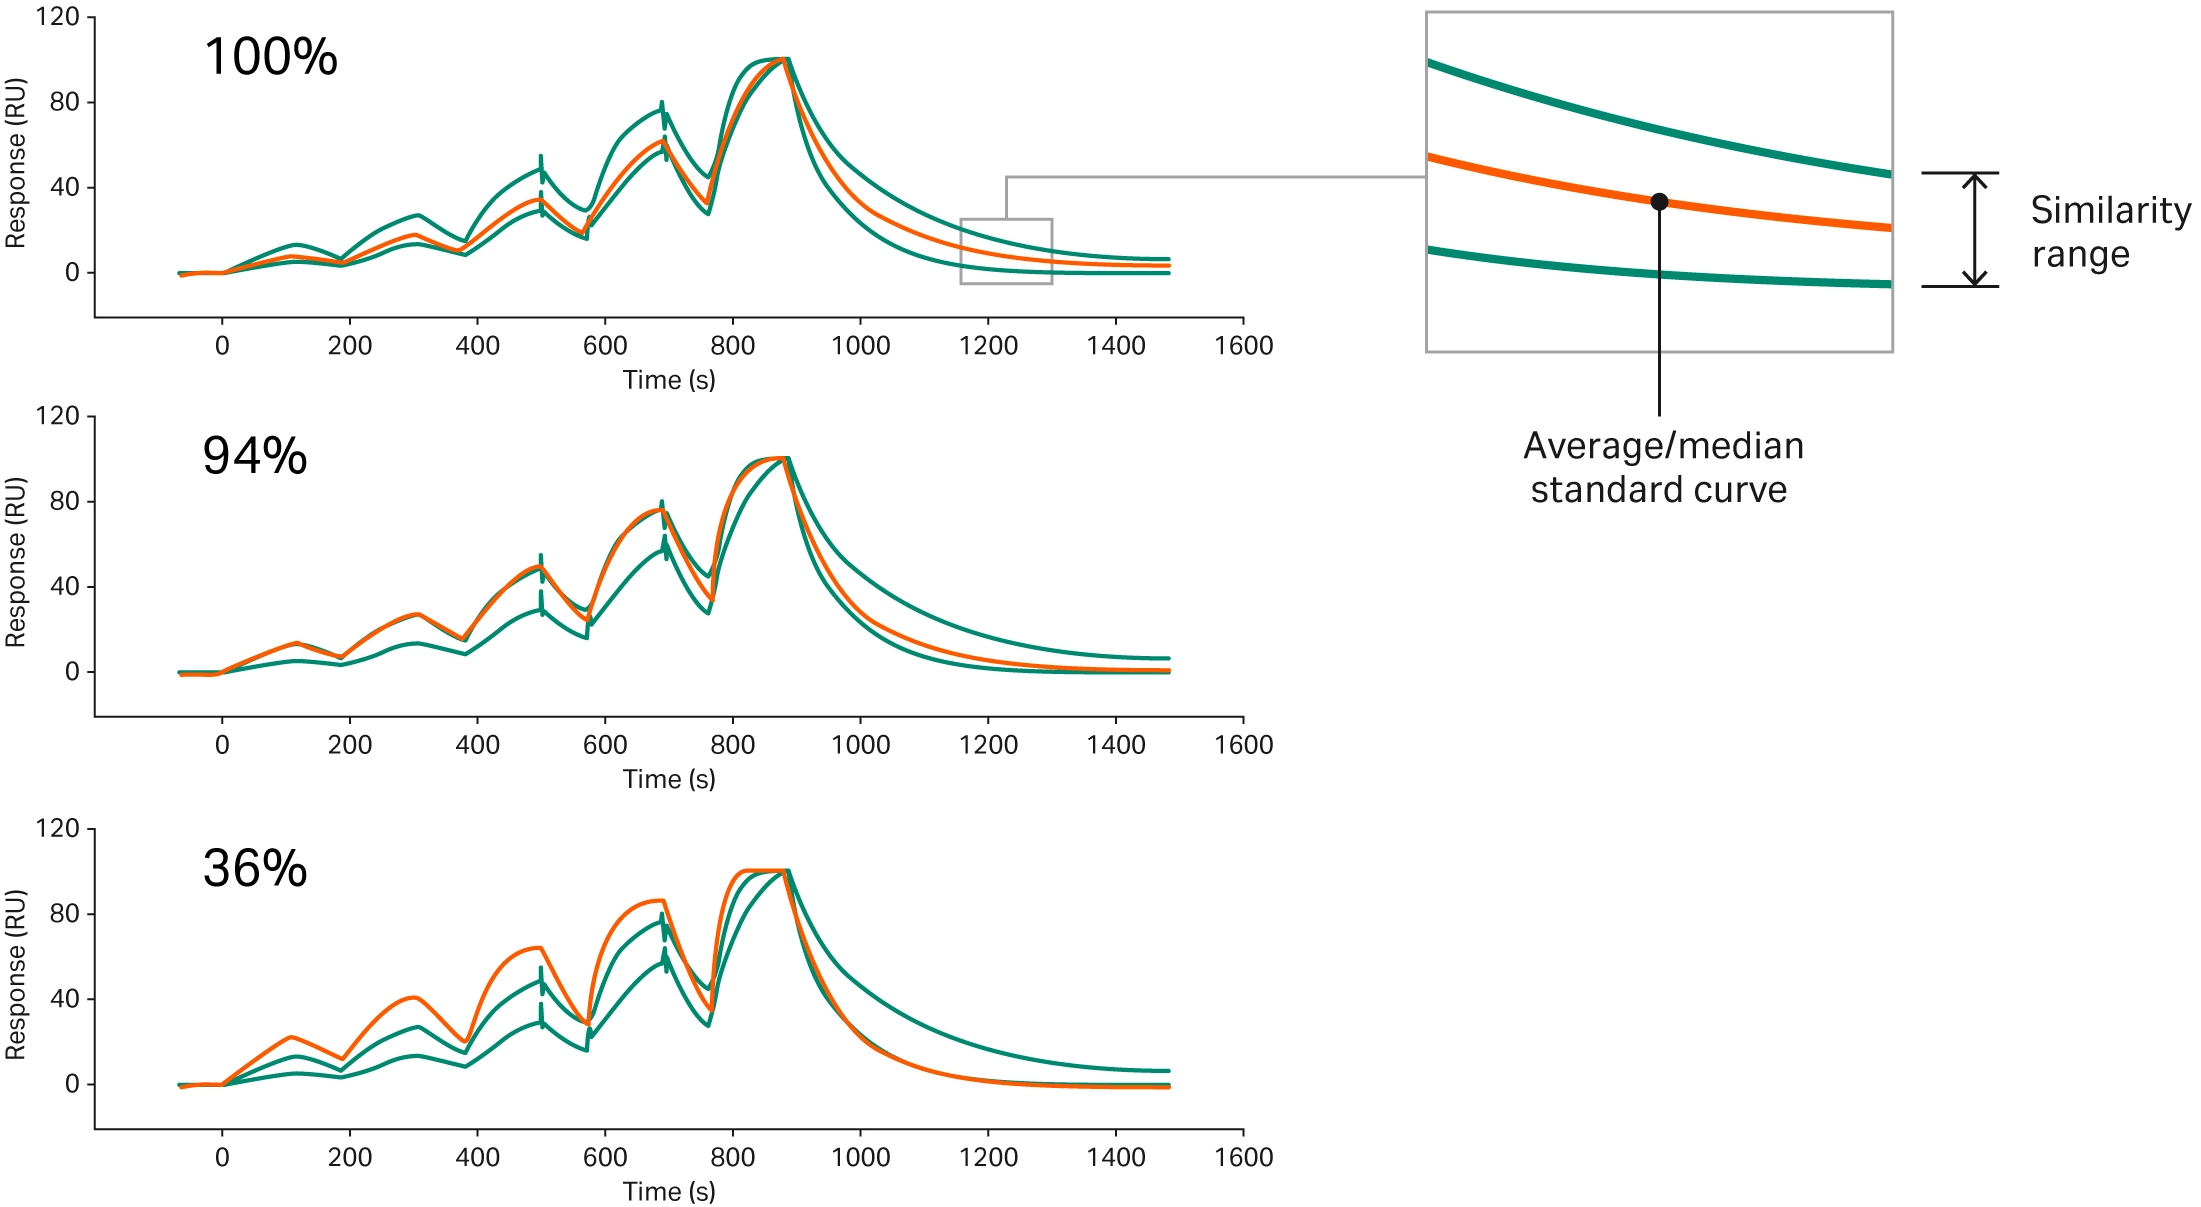
Fig 6. Example sensorgrams and similarity scores. The sample sensorgram is shown in red, and two blue sensorgrams represent the upper and lower limits of the window of variation.
In a case study carried out by Sartorius-Stedim BioOutsource, Truxima, which is a biosimilar to MabThera, was assessed for similarity to the reference biologic (37). Prior research demonstrated that the post-translational modifications seen in the biosimilar had the potential to alter the functionality of the biologic. Surprisingly, measurement of binding affinity using Biacore SPR technology did not reveal any differences. To investigate this further, the researchers used Biacore Sensorgram comparison tool to compare the binding profiles for the biosimilar and reference biologic. The similarity score for the biosimilar was demonstrated to be substantially lower than the reference biologic, suggesting that the association and dissociation rates did in fact differ (Fig 7).
The Sensorgram comparison tool, therefore, provides a more in-depth comparison between the binding curve of the biosimilar and the reference biologic and produces an outcome (the similarity score) that is easy to comprehend.
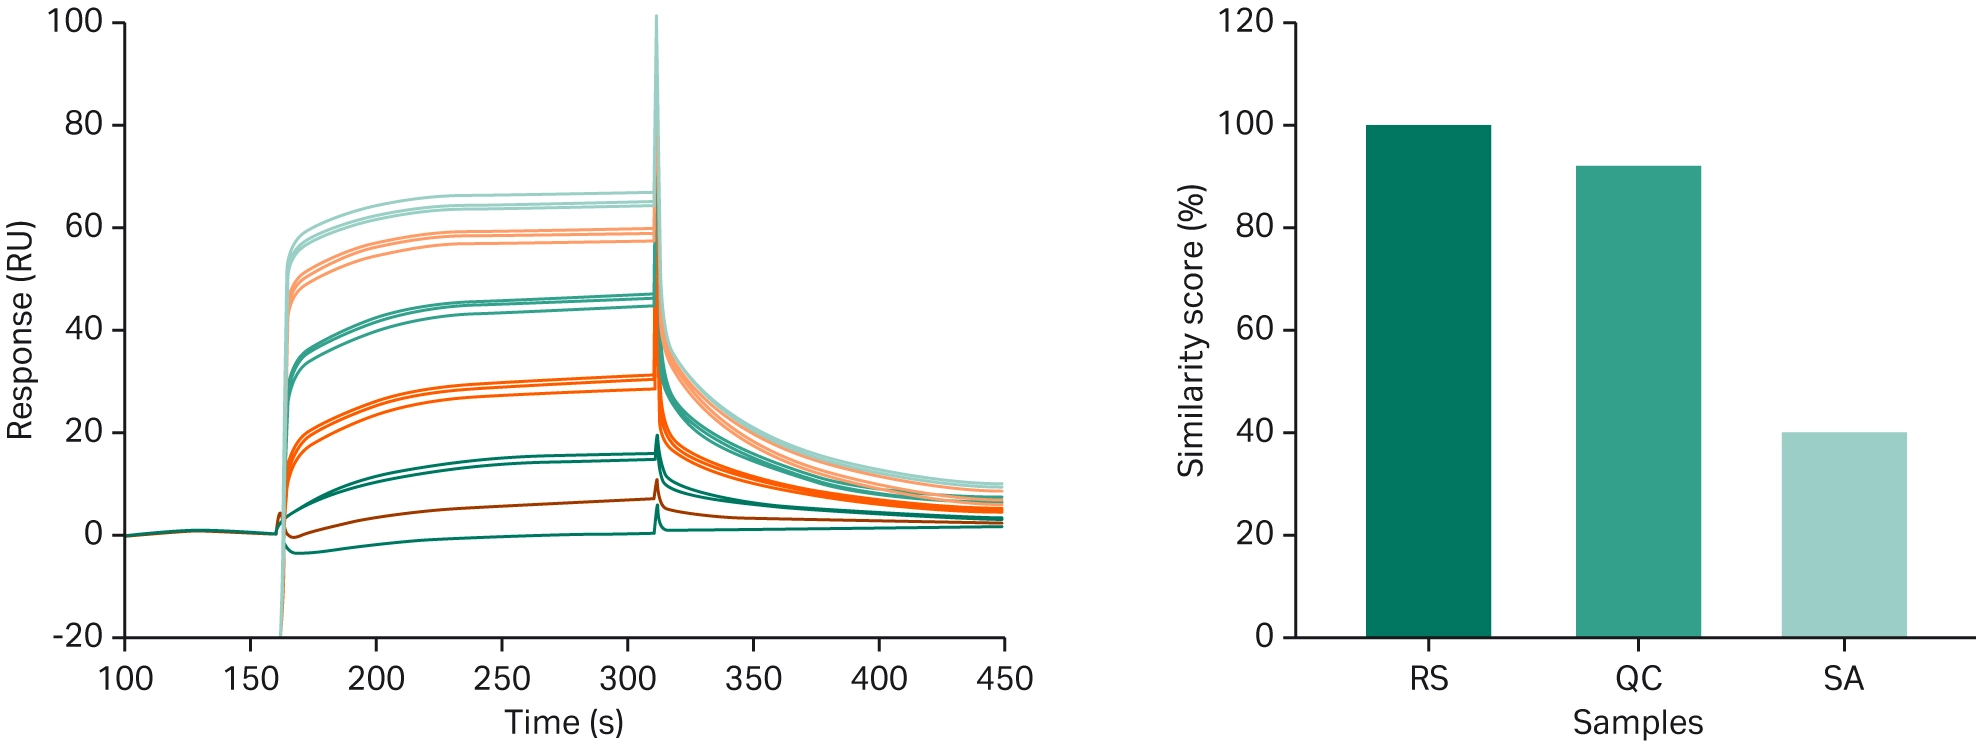
Fig 7. Overlay of sensorgrams from a concentration series of Mabthera and the biosimilar (left), and the similarity scores from the sensorgram comparison (right).
The advantages of SPR in developing and validating biosimilars
The demand for biosimilars is continuing to rise as more blockbuster drugs reach their patent expiry. Biosimilars must undergo assessment of CQAs to demonstrate sufficient similarity to the reference biologic and achieve regulatory approval. Biacore SPR technology forms a key step in the regulatory assessment of biosimilars and is a crucial tool for the development and validation of biosimilars. Key advantages of the use of Biacore SPR technology for biosimilar analysis include:
The production of high-throughput, reproducible results
Assessing biosimilars requires the analysis of many lot numbers of both the biosimilar and the reference biologic to include a representative selection of product and reach valid comparisons. Biacore SPR assays are high-throughput and provide rapid determination of binding characteristics for all products (38). Biacore systems are also highly precise and enhance reproducibility of results.
The incorporation of a sensorgram comparison tool
Other standard methods for assessing target binding provide only a snapshot of the interaction, limiting the information that can be obtained from the data and limiting comparison. Biacore SPR system records interactions in real-time, producing sensorgrams that can be directly compared across the entirety of the binding interaction, and enables the incorporation of comparison tools. The use of Biacore Sensorgram comparison tool provides a more comprehensive assessment of similarities in binding characteristics between biosimilars and reference biologics. Traditional kinetics and affinity fitting models often fail to capture complex interaction profiles. Sensorgram comparison overcomes this limitation by enabling direct evaluation of full binding profiles without relying on any fitting models. This approach allows rapid, objective, and regulatory-compliant comparison of complex interactions, providing clear, quantitative evidence of bio-similarity.
The use of label-free detection
Unlike other common techniques for analyzing biomolecular interactions, Biacore SPR technology does not require the use of labels. The binding of labels to biologics or to proteins of interest can alter protein conformation, potentially altering binding kinetics (39). Label-free Biacore SPR technology allows proteins and biologics to retain their native structure and function to improve accuracy of results.
Provision of key information on critical quality attributes
CQAs must be comprehensively assessed to achieve regulatory compliance. Biacore SPR technology provides detailed, high-quality data on CQAs (binding affinity, kinetics, and concentration), supporting the validation of biosimilars. Biacore SPR technology is also compliant with 21 CFR Part 11—meeting regulatory requirements.
Summarized Biacore SPR system features
Biacore systems by Cytiva are platforms for label-free interaction analysis using SPR technology. Designed to deliver high-quality, information-rich data, Biacore system answers critical questions about molecular binding and similarity, accelerating your research toward meaningful conclusions.
With advanced features for high-throughput and high-sensitivity analysis, Biacore instruments provide real-time evaluation of affinity, kinetics, epitope binning, sensorgram comparison, and concentration across a broad molecular weight range using minimal sample volumes.
Biacore Insight Software provides unified instrument control and data evaluation with optional application-specific extensions. It includes machine learning-based tools and seamless integration capabilities for automated workflows and cross-platform data management—enhancing efficiency and reproducibility in your lab.
Conclusion
Biacore SPR systems are an essential tool for the development and validation of biosimilars, providing crucial data to support agreement with critical quality attributes and comparability assessment. These systems address many hurdles in biosimilar development, with their sensitivity, high-throughput nature, and label-free capabilities. The Sensorgram comparison tool provides a comprehensive analysis of similarities in binding curve shape throughout whole interactions, moving beyond a static analysis of binding affinity alone. The high-quality, in-depth data results in robust and reliable analysis, enhancing regulatory compliance and driving forward the introduction of new biosimilars to the market.
FAQ
- What is SPR?
Surface plasmon resonance (SPR) is a label-free technique used to study biomolecular interactions in real time. It detects changes in the refractive index near an SPR sensor surface when molecules bind, providing insights into binding kinetics, affinity, selectivity, and concentration. SPR is widely used in drug discovery and protein characterization due to its sensitivity, high quality, robustness, and application versatility. - How does SPR support biosimilar comparability studies?
Biacore SPR provides real‑time kinetic and affinity data that are essential for demonstrating similarity between a biosimilar and its reference biologic. The system enables researchers to compare binding characteristics across multiple lots, ensuring that biosimilars meet regulatory expectations for critical quality attributes (CQAs). - What is a similarity score, and how is it used in biosimilar assessment?
The similarity score is a quantitative value generated by the Biacore Insight Software Sensorgram comparison tool. It measures how closely a biosimilar’s binding curve falls within the reference product’s established window of variation. This provides an easy‑to‑interpret indicator of comparability without requiring curve fitting. - Why are Fc receptor binding assays important in biosimilar development?
Many biologics rely on Fc‑mediated effector functions such as ADCC, CDC, and phagocytosis. SPR‑based Fc receptor binding assays ensure the biosimilar binds comparably to the same Fcγ receptors and FcRn as the reference biologic—crucial for maintaining efficacy, half‑life, and safety. - Can Biacore SPR detect differences caused by post‑translational modifications (PTMs)?
Yes. Biacore SPR is sensitive to PTM‑induced changes, such as glycosylation or charge variants, that can affect binding behavior. By comparing binding kinetics and affinity across isolated variants, SPR helps determine whether PTMs impact CQAs. - How is SPR advantageous compared to other analytical techniques for biosimilars?
Unlike labeled techniques, SPR is label‑free, preserving the native state of biomolecules. It measures interactions in real time, producing detailed sensorgrams rather than single‑point readouts. This allows deeper evaluation of binding kinetics and enhances accuracy, reproducibility, and regulatory compliance.
References
- European Medicines Agency. Biosimilar medicines: Overview | European Medicines Agency. www.ema.europa.eu. https://www.ema.europa.eu/en/human-regulatory-overview/biosimilar-medicines-overview
- In brief: Biologics and biosimilars. Nih.gov. Published February 8, 2023. https://www.ncbi.nlm.nih.gov/books/NBK499546/
- López-Siguero JP, Pfäffle R, Chanson P, Szalecki M, Höbel N, Zabransky M. Ten years’ clinical experience with biosimilar human growth hormone: a review of efficacy data. Drug Design, Development and Therapy. 2017;Volume 11:1489-1495. doi:10.2147/dddt.s130320
- Biosimilars approved in Europe. www.gabionline.net. https://www.gabionline.net/biosimilars/general/biosimilars-approved-in-europe
- The patent cliff steepens. Nature Reviews Drug Discovery. 2010;10(1):12-13. doi:10.1038/nrd3356
- Comparison of the cost of development of biologicals and biosimilars. www.gabionline.net. Accessed November 24, 2025. https://www.gabionline.net/reports/comparison-of-the-cost-of-development-of-biologicals-and-biosimilars
- Abdelaziz A, Winn AN, Dusetzina SB, Mitchell AP. Biologic Drug Prices in Medicare Part B After Entry of Biosimilars to the Market. JAMA Network Open. 2025;8(11):e2542937-e2542937. doi:10.1001/jamanetworkopen.2025.42937
- Patent expiration to drive biosimilars market expansion to 2032. European Pharmaceutical Review. https://www.europeanpharmaceuticalreview.com/news/226316/patent-expiration-to-drive-biosimilars-market-expansion-to-2032/
- Chow SC, Song F, Bai H. Analytical Similarity Assessment in Biosimilar Studies. The AAPS Journal. 2016;18(3):670-677. doi:10.1208/s12248-016-9882-5
- Lim S. Overview of the Regulatory Framework and FDA’s Guidance for the Development and Approval of Biosimilar and Interchangeable Products in the US. https://www.fda.gov/files/drugs/published/Overview-of-the-Regulatory-Framework-and-FDA's-Guidance-for-the-Developmet-and-Approval-of-Biosmiliar-and-Interchangeable-Products-in-the-US.pdf
- European Medicines Agency. Committee for Medicinal Products for Human Use (CHMP) Guideline on Similar Biological Medicinal Products.; 2014. https://www.ema.europa.eu/en/documents/scientific-guideline/guideline-similar-biological-medicinal-products-rev1_en.pdf
- Kirchhoff CF, Wang XM, Conlon HD, Anderson S, Ryan AM, Bose A. Biosimilars: Key regulatory considerations and similarity assessment tools. Biotechnology and Bioengineering. 2017;114(12):2696-2705. doi:10.1002/bit.26438
- Vulto AG, Jaquez OA. The process defines the product: what really matters in biosimilar design and production? Rheumatology. 2017;56(suppl_4):iv14-iv29. doi:10.1093/rheumatology/kex278
- DrugPatentWatch. A Strategic Guide to Regulatory Considerations for Biosimilar Analytical Similarity Assessments. DrugPatentWatch – Transform Data into Market Domination. Published October 17, 2024. Accessed December 9, 2025. https://www.drugpatentwatch.com/blog/regulatory-considerations-for-biosimilar-analytical-similarity-assessments/
- Application note: Surface plasmon resonance. Cytiva; 2025.
- Xie L, Zhang E, Xu Y, et al. Demonstrating Analytical Similarity of Trastuzumab Biosimilar HLX02 to Herceptin® with a Panel of Sensitive and Orthogonal Methods Including a Novel FcγRIIIa Affinity Chromatography Technology. BioDrugs. 2020;34(3):363-379. doi:10.1007/s40259-020-00407-0
- Magnenat L, Palmese A, Fremaux C, et al. Demonstration of physicochemical and functional similarity between the proposed biosimilar adalimumab MSB11022 and Humira®. MAbs. 2016;9(1):127-139. doi:10.1080/19420862.2016.1259046
- Hofmann HP, Kronthaler U, Fritsch C, et al. Characterization and non-clinical assessment of the proposed etanercept biosimilar GP2015 with originator etanercept (Enbrel®). Expert Opinion on Biological Therapy. 2016;16(10):1185-1195. doi:10.1080/14712598.2016.1217329
- Shibata H, Harazono A, Kiyoshi M, Saito Y, Ishii-Watabe A. Characterization of Biosimilar Monoclonal Antibodies and Their Reference Products Approved in Japan to Reveal the Quality Characteristics in Post-approval Phase. BioDrugs. 2025;39(4):645-667. doi:10.1007/s40259-025-00722-4
- Gürel B, Çapkın E, Parlar A, et al. Optimized Methods for Analytical and Functional Comparison of Biosimilar mAb Drugs: A Case Study for Avastin, Mvasi, and Zirabev. Scientia Pharmaceutica. 2022;90(2):36. doi:10.3390/scipharm90020036
- Wang H, Wu L, Wang C, et al. Biosimilar or Not: Physicochemical and Biological Characterization of MabThera and Its Two Biosimilar Candidates. ACS Pharmacol Transl Sci. 2021;4(2):790-801. doi:10.1021/acsptsci.0c00225
- Miranda-Hernández MP, López-Morales CA, Ramírez-Ibáñez ND, et al. Assessment of Physicochemical Properties of Rituximab Related to Its Immunomodulatory Activity. J Immunol Res. 2015;2015:910763. doi:10.1155/2015/910763
- Gogesch P, Dudek S, van Zandbergen G, Waibler Z, Anzaghe M. The Role of Fc Receptors on the Effectiveness of Therapeutic Monoclonal Antibodies. Int J Mol Sci. 2021;22(16):8947. doi:10.3390/ijms22168947
- Johnson P, Glennie M. The mechanisms of action of rituximab in the elimination of tumor cells. Semin Oncol. 2003;30(1 Suppl 2):3-8. doi:10.1053/sonc.2003.50025
- Visser J, Feuerstein I, Stangler T, Schmiederer T, Fritsch C, Schiestl M. Physicochemical and Functional Comparability Between the Proposed Biosimilar Rituximab GP2013 and Originator Rituximab. BioDrugs. 2013;27(5):495-507. doi:10.1007/s40259-013-0036-3
- Lee KH, Lee J, Bae JS, et al. Analytical similarity assessment of rituximab biosimilar CT-P10 to reference medicinal product. MAbs. 2018;10(3):380-396. doi:10.1080/19420862.2018.1433976
- Xu Y, Xie L, Zhang E, et al. Physicochemical and functional assessments demonstrating analytical similarity between rituximab biosimilar HLX01 and the MabThera®. mAbs. 2019;11(3):606-620. doi:10.1080/19420862.2019.1578147
- Seo N, Huang Z, Kuhns S, et al. Analytical and functional similarity of biosimilar ABP 798 with rituximab reference product. Biologicals. 2020;68:79-91. doi:10.1016/j.biologicals.2020.08.002
- Jassem S, Wang W, Sweet H, et al. Functional and Nonclinical Similarity of ABP 980, a Biosimilar of Trastuzumab. Pharm Res. 2019;36(12):177. doi:10.1007/s11095-019-2702-8
- Goyal P, Iyer J, Adhikary L, et al. Physicochemical and functional characterization of trastuzumab-dkst, a trastuzumab biosimilar. Future Med Chem. 2021;13(18):1531-1557. doi:10.4155/fmc-2021-0113
- Hajba L, Szekrényes Á, Borza B, Guttman A. On the glycosylation aspects of biosimilarity. Drug Discov Today. 2018;23(3):616-625. doi:10.1016/j.drudis.2018.01.009
- Mukherji SK. Bevacizumab (Avastin). AJNR Am J Neuroradiol. 2010;31(2):235-236. doi:10.3174/ajnr.A1987
- Zhao YY, Wang N, Liu WH, Tao WJ, Liu LL, Shen ZD. Charge Variants of an Avastin Biosimilar Isolation, Characterization, In Vitro Properties and Pharmacokinetics in Rat. PLOS ONE. 2016;11(3):e0151874. doi:10.1371/journal.pone.0151874
- Torkashvand F, Mehranfar M, Rashidi Gero M, et al. Trastuzumab Charge Variants: a Study on Physicochemical and Pharmacokinetic Properties. Iran Biomed J. 2023;27(2-3):108-116. doi:10.52547/ibj.3837
- Sörgel F, Schwebig A, Holzmann J, Prasch S, Singh P, Kinzig M. Comparability of Biosimilar Filgrastim with Originator Filgrastim: Protein Characterization, Pharmacodynamics, and Pharmacokinetics. BioDrugs. 2015;29(2):123-131. doi:10.1007/s40259-015-0124-7
- Karlsson R, Pol E, Frostell Å. Comparison of surface plasmon resonance binding curves for characterization of protein interactions and analysis of screening data. Anal Biochem. 2016;502:53-63. doi:10.1016/j.ab.2016.03.007
- Gorman TA, Moncrieff S, Anderson G. Generating a Quality Attribute Profile for Antibody-Based Biosimilars: Assessing Differences in Fc-Associated Effector Functions. 2021. Accessed November 6, 2025. https://www.sartorius.com/download/691636/sensorgram-comparison-white-paper-en-b-sartorius-pdf-data.pdf
- Schneider CS, Bhargav AG, Perez JG, et al. Surface plasmon resonance as a high throughput method to evaluate specific and non-specific binding of nanotherapeutics. J Control Release. 2015;219:331-344. doi:10.1016/j.jconrel.2015.09.048
- Bobone S, Storti C, Fulci C, et al. Fluorescent Labeling Can Significantly Perturb Measured Binding Affinity and Selectivity of Peptide-Protein Interactions. J Phys Chem Lett. 2024;15(40):10252-10257. doi:10.1021/acs.jpclett.4c01767