Summary
This application note evaluates GF 10 filter media produced using an improved manufacturing design based on a newly qualified raw material. We compare the new media to the legacy GF 10, which is part of a planned update incorporating customer feedback.
Material property testing showed comparable performance between the two versions, while the new GF 10 shows improved mechanical strength, greater water repellency, a slightly lower pressure drop, and consistently high particle retention efficiency. Application‑level testing showed comparable PM10 and PM2.5 mass‑capture performance and stable microgram‑level mass behavior during handling and thermal‑stability evaluations. These results indicate comparable performance of the new material across core gravimetric workflows. Continuous PM2.5 β‑ray attenuation measurements also showed closely matching time‑series behavior among all channels, indicating that new GF 10 performs comparably to the legacy material in continuous monitoring applications.
Overall, GF 10 produced using the improved manufacturing design performs comparably to legacy GF 10 in PM10 and PM2.5 particulate matter sampling, including continuous PM2.5 β-ray attenuation monitoring, supporting its use within existing customer workflows.
Introduction
PM10, PM2.5 and continuous air monitoring
Airborne particulate matter (PM) is one of the most significant environmental health challenges worldwide, particularly fine particles in the PM10 and PM2.5 size fractions. Their health relevance is documented extensively in the World Health Organization Global Air Quality Guidelines, which summarize global scientific evidence on exposure and adverse outcomes (1).
Regulatory monitoring frameworks rely on both gravimetric reference methods and continuous monitoring technologies. In the United States, the National Ambient Air Quality Standards (NAAQS) define PM criteria and associated requirements for reference and equivalent methods (2). Gravimetric Federal Reference Methods remain the regulatory foundation due to their traceability and stability, while continuous instruments provide high-resolution temporal data important for daily operational planning, forecasting, and pollution event management. Standard method references and technical descriptions of ambient PM monitoring systems are maintained through the U.S. EPA’s Air Monitoring Methods resources (3). Within these workflows, filter media play a critical role.
Among continuous methods, β‑ray attenuation monitors (BAMs) are widely used. Their operating principle, signal behavior, and performance considerations (including sensitivity to humidity, flow control, and mass loading) are described in technical assessments such as the β‑attenuation method overview and multi‑country equivalence evaluations (4).
Role of GF 10 in air monitoring
GF 10 has long been used in PM10, PM2.5, and continuous β‑attenuation monitoring workflows. It is valued for its stable mass, reliable flow behavior, and high particulate retention, all of which support accurate and reproducible mass determinations under typical ambient monitoring conditions.
Transition in raw material for GF 10
The raw material historically used to manufacture GF 10 has been replaced as part of a planned modernization of the manufacturing process. GF 10 will continue to be produced using newly qualified raw material under the same commercial product name. The new material was selected and validated to maintain established GF 10 performance characteristics, including stable mass, consistent flow resistance, and high particulate retention. It also supports improved manufacturing consistency and enhanced mechanical robustness. For clarity, the two materials are referred to throughout this note as “legacy GF 10” and “new GF 10”.
Materials and methods
A combination of Cytiva in‑house testing (for material property evaluation) and independent external laboratory evaluations was used to compare legacy GF 10 and new GF 10 across parameters relevant to PM10 and PM2.5 gravimetric methods and continuous PM2.5 β‑ray attenuation monitoring. The full experimental design, including the tests performed, number of lots, and number of replicates, is summarized in Table 1. Both material versions were evaluated under comparable and representative conditions. All testing followed established internal procedures or standard environmental monitoring practices. For continuous monitoring, results are reported as channels (1 channel for legacy GF 10 and 3 channels for the new GF 10), each consisting of approximately 88 hourly time‑series observations, rather than discrete replicate counts.
| Testing parameter | Laboratory | GF 10 | Lots | Replicates per Lot |
|---|---|---|---|---|
| Grammage | Cytiva | Legacy | 1 | 4 |
| New | 2 | 32 | ||
| Thickness | Cytiva | Legacy | 1 | 4 |
| New | 2 | 32 | ||
| Dry burst | Cytiva | Legacy | 1 | 3 |
| New | 2 | 24 | ||
| Water repellency | Cytiva | Legacy | 1 | 2 |
| New | 2 | 6 | ||
| Pressure drop |
Cytiva |
Legacy | 1 | 2 |
| New |
2 | 6 | ||
| Retention |
Cytiva |
Legacy |
1 | 2 |
| New |
2 | 6 | ||
| Gravimetric method - PM10 |
External laboratory |
Legacy |
1 | 10 paired runs |
| New |
1 | 10 paired runs |
||
| Gravimetric method - PM2.5 |
External laboratory |
Legacy |
1 | 6 paired runs; 3 filters per run (tested in parallel using three samplers) |
| New |
1 | 6 paired runs; 3 filters per run (tested in parallel using three samplers) |
||
| Continuous PM2.5 β-ray attenuation |
External laboratory |
Legacy |
1 | 1 channel; ~88 timepoints |
| New |
1 | 3 channels; each ~88 timepoints |
||
| Drop test |
External laboratory |
Legacy |
1 | 10 |
| New |
1 | 10 |
||
| Drying test |
External laboratory |
Legacy |
1 | 10 |
| New |
1 | 10 |
Table 1. Overview of test parameters, laboratories, lots, and replicates for both legacy GF 10 and new GF 10.
Material properties
All measurements performed by the Cytiva laboratory in Hangzhou, China were conducted on filters conditioned under ambient conditions. Legacy GF 10 was evaluated using one production lot, while new GF 10 was evaluated using two production lots, with replicate numbers defined in Table 1.
The following material‑property tests were performed using established internal methods:
- Grammage (g/m²): measured after controlled conditioning and dimensional cutting.
- Thickness (µm at 53 kPa): determined using a calibrated thickness gauge.
- Dry burst strength (kPa): measured by applying increasing pneumatic pressure until rupture.
- Water repellency (in H2O): determined using a hydrostatic-head test.
- Pressure drop (mm H2O at 16.7 L/min): measured at the gravimetric reference flow rate.
- Particle retention (% at 16.7 L/min): assessed using a standardized particulate challenge.
Application‑level performance
External laboratory testing was conducted under controlled temperature and humidity for consistent and reproducible comparisons between legacy GF 10 and new GF 10. Both materials were tested using a single production lot for all application‑level evaluations, with the number of runs defined in Table 1. Prior to testing, all filters were conditioned for stability. Following each test, they were re‑equilibrated before final weighing.
- Gravimetric PM10 testing
Filters (47 mm) were conditioned for ≥24 h at 15–30 °C (± 1 °C) and 50 ± 5% RH, weighed (W1), installed in samplers operating at 16.67 L/min, sampled for 20–24 h, re-conditioned, and reweighed (W2).
PM concentration was calculated as:
PM = (W2 – W1) / total sampled air volume
For PM10 one sampler per filter grade was operated in parallel, with one filter per sampler per day - Gravimetric PM2.5 testing
Filters (90 mm) were conditioned for ≥24 h at 15–30 °C (± 1 °C) and 50 ± 5% RH, weighed (W1), installed in samplers operating at 100 L/min, sampled for 20–24 h, re-conditioned, and reweighed (W2).
PM concentration was calculated as:
PM = (W2 – W1) / total sampled air volume
For PM2.5 testing, three samplers per filter grade were operated in parallel, with one filter per sampler per day. A size-selective inlet was used for PM2.5 sampling. - Drop test (handling robustness)
Filters were conditioned and weighed (W1), mounted in standard clamps, and dropped twice from a height of 25 cm onto a clean, hard surface. After re‑equilibration, filters were reweighed (W2). The acceptance criterion required the average mass change (W2 – W1) to be < 20 µg. - Drying test (thermal mass stability)
Conditioned filters were weighed (W1), placed in an oven at 40 ± 2 °C for ≥ 48 hours, returned to laboratory conditions, re‑equilibrated, and reweighed (W2). The acceptance criterion was again |W2 – W1| < 20 µg. - Continuous PM2.5 β‑ray attenuation
Continuous PM2.5 monitoring was performed using β‑ray attenuation instruments configured with either one channel (legacy GF 10) or three channels (new GF 10). Each channel recorded approximately 88 hourly time points over the monitoring period. A continuous glass fiber filter tape was used in the instrument-specific sampling cassette, and all channels were operated under identical conditions, enabling direct comparison of time-series behavior across filter types.
Results and discussion
Material properties
Quality control measurements were performed on legacy GF 10 and new GF 10. The evaluation included grammage, thickness, dry‑burst strength, water repellency, pressure drop, and particle retention. Results for both materials are summarized in Table 2, presented as minimum, maximum, and average values based on the replicate scheme described in Table 1. Across all parameters, new GF 10 maintains or improves performance relative to legacy GF 10.
| Parameter | Legacy GF 10 (min–max / avg) | New GF 10 (min–max / avg) |
|---|---|---|
| Grammage (g/m2) | 64–67 / 66 | 64–67 / 66 |
| Thickness (µm @ 53 kPa) | 277–286 / 281 | 296–320 / 311 |
| Dry-burst (kPa) | 37–40 / 38 | 54–78 / 66 |
| Water repellency (in H2O) | 26–32 / 29 | 51–67 / 57 |
| Pressure drop (mm H2O @ 16.7 L/min) | 14.7–15.2 / 15.0 | 13.6–14.9 / 14.4 |
| Retention (% @ 16.7 L/min) | 99.68–99.73 / 99.71 | 99.82–99.87 / 99.85 |
Table 2. Summary statistics (min, max, and average) for material‑property measurements comparing legacy GF 10 and new GF 10.
Grammage (basis weight)
Both materials center on the same basis‑weight target (66 g/m2, range 64–67 g/m2), indicating that new GF 10 maintains the established mass‑per‑area specification used historically for legacy GF 10. This suggests that any differences observed in mechanical or flow behavior arise from internal media structure rather than changes in mass loading.
Thickness (measured at 53 kPa)
At the same basis weight, new GF 10 showed greater thickness (296–320 µm; average 311 µm) than legacy GF 10 (277–286 µm; average 281 µm). While the new material showed a broader observed thickness range, evaluation across multiple lots and replicates showed that all measurements fell within the defined range for the new GF 10 and reflected expected lot‑to‑lot manufacturing variability (Table 2).
Dry‑burst strength
New GF 10 showed substantially higher dry‑burst strength (54–78 kPa; average 66 kPa) relative to legacy GF 10 (37–40 kPa; average 38 kPa). This is consistent with the increased mechanical robustness of the new raw material construction.
Water repellency
Hydrostatic‑head testing showed higher water‑repellency values for new GF 10 (51–67 in H2O; average 57 in H2O) compared with legacy GF 10 (26–32 in H2O; average 29 in H2O). Improved water repellency may support more stable filter conditioning and reduce susceptibility to environmental humidity effects during weighing.
Pressure drop at 16.7 L/min
At the gravimetric reference flow rate, new GF 10 exhibited a slightly lower pressure drop (13.6–14.9 mm H2O; average 14.4 mm H2O) compared with legacy GF 10 (14.7–15.2 mm H2O; average 15.0 mm H2O). A modest reduction in pressure drop may support improved flow‑control stability during sampling.
Particle retention at 16.7 L/min
Both materials achieved high particle retention efficiency. New GF 10 showed slightly higher retention values (99.82–99.87%; average 99.85%) compared with legacy GF 10 (99.68–99.73%; average 99.71%). These retention levels support consistent mass capture during gravimetric sampling while maintaining compatibility with reference‑method flow conditions.
Application‑level performance
Applications‑based testing compared legacy GF 10 and new GF 10 across gravimetric PM10, gravimetric PM2.5, handling robustness (drop test), thermal stability (drying test), and continuous β‑ray attenuation performance. Together, these tests represent the primary workflows in which GF 10 is routinely used. Across all methods, both materials showed closely aligned behavior under the test conditions applied, although performance in specific customer applications may vary depending on system configuration, sampling conditions, and workflow parameters.
Gravimetric PM10
Paired PM10 measurements were collected using legacy GF 10 and new GF 10 under identical conditioning, sampling, and weighing conditions. The resulting mass concentrations are shown in Figure 1.
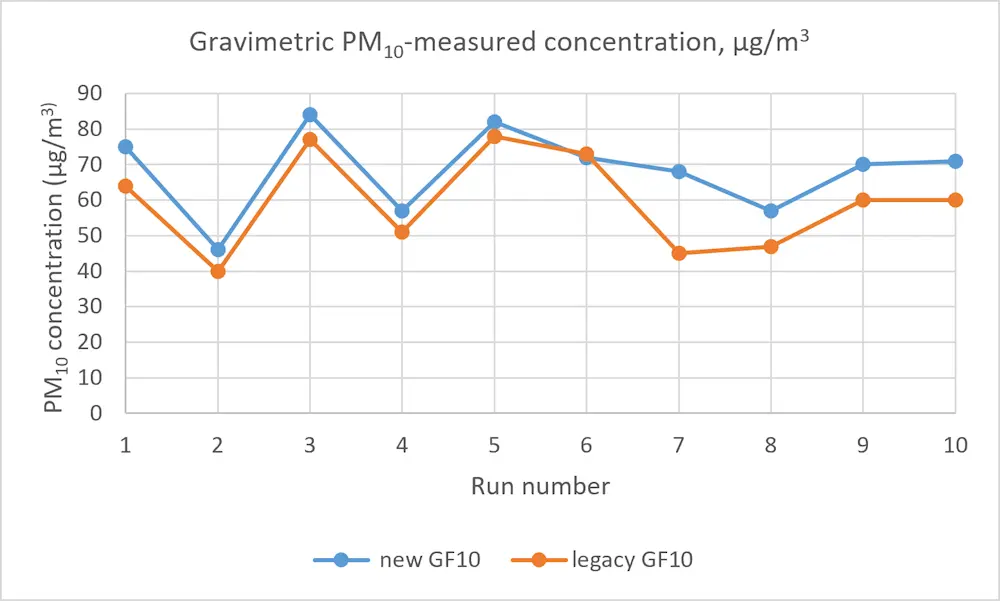
Fig 1. Gravimetric PM10 concentrations measured using legacy GF 10 and new GF 10.
Across all ten paired runs, the two data series tracked closely, displaying parallel behavior and consistently similar mass readings. Minor run‑to‑run variations were observed, with new GF 10 occasionally showing slightly higher values. However, all differences were within the expected range for 20–24‑hour ambient sampling at the reference flow rate. The small, localized increases observed for new GF 10 may be related to its slightly greater thickness and higher particle retention capability, which may contribute to slightly higher capture of larger particulate fractions.
Gravimetric PM2.5
Gravimetric PM2.5 measurements were conducted under identical sampling conditions for both filter grades, as shown in Figure 2. Results are presented as mean PM2.5 concentrations per run (n = 3), with variability expressed as ± standard deviation (SD).
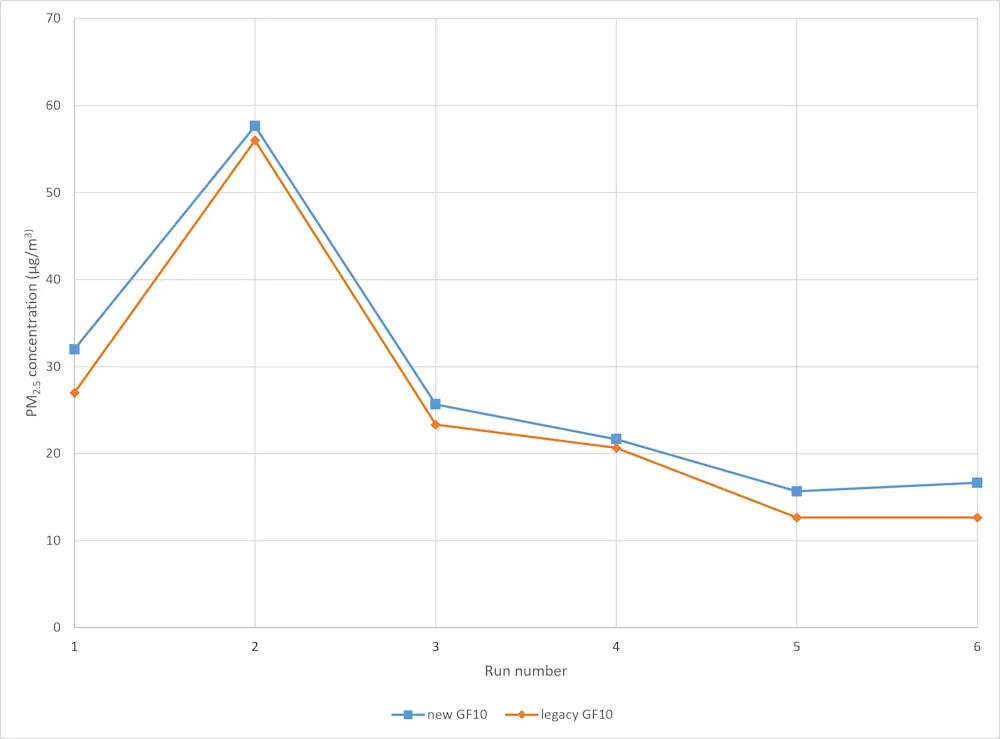
Fig 2. Mean gravimetric PM2.5 concentrations measured using legacy GF 10 and new GF 10 (mean ± SD, n = 3 samplers per filter grade per run).
Across all sampling days, the two data series tracked closely, displaying consistent trends and similar temporal behavior, including a shared peak followed by a gradual decrease in concentration. Minor variations between the materials were observed, with new GF 10 consistently showing slightly higher PM2.5 concentrations compared to legacy GF 10. The variability within each run, expressed as standard deviation, was comparable between the two materials. This tendency is consistent with the material property results, where new GF 10 exhibits greater thickness and slightly improved particle retention efficiency, which may contribute to slightly higher capture of fine particulate matter during sampling.
Overall, the paired results show comparable PM2.5 mass-capture performance, supporting the use of new GF 10 in PM2.5 applications.
Drop test
Handling robustness was evaluated by measuring mass changes before and after a controlled drop sequence. Mass‑change values for all replicates are shown in Figure 3.
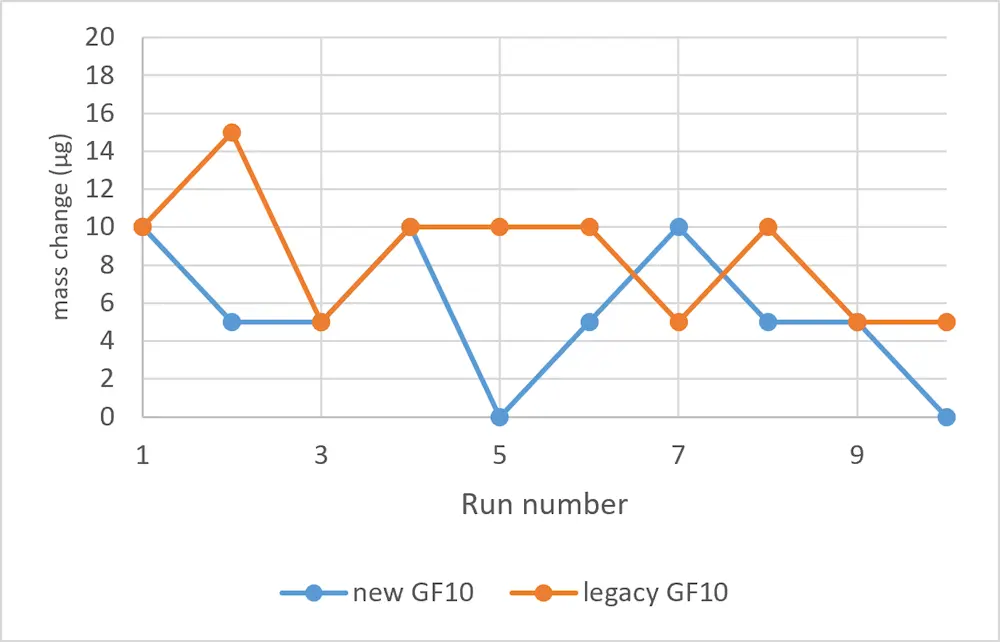
Fig 3. Mass‑change measurements obtained during the drop test for legacy GF 10 and new GF 10.
Both GF 10 variants showed minimal mass change after dropping, with all values well within the ± 20 µg acceptance range. New GF 10 exhibited a narrower distribution of mass changes, consistent with the higher mechanical strength observed in material‑property testing.
Drying test
Thermal stability was assessed by exposing filters to 40 ± 2 °C for at least 48 hours. Mass‑change results are shown in Fig 4.
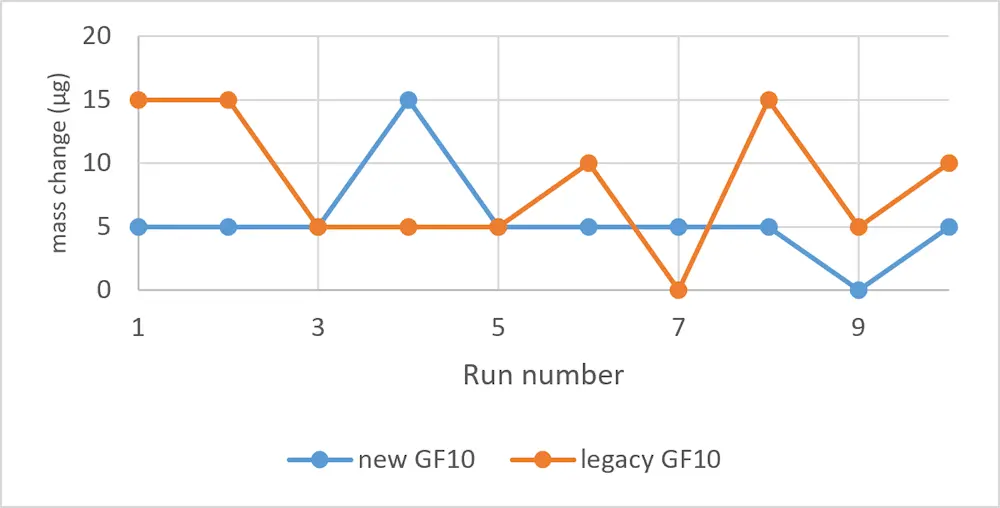
Fig 4. Mass-change measurements from the drying test for legacy GF 10 and new GF 10.
Both materials showed low and consistent mass change following thermal exposure, with all replicates remaining within the acceptance range. New GF 10 showed a slightly tighter distribution, consistent with stable mass behavior under thermal stress.
Combined drop‑test and drying‑test results showed that both materials maintain stable microgram‑level mass characteristics under typical handling and conditioning scenarios.
Continuous PM2.5 β‑ray attenuation
Continuous PM2.5 monitoring performance was evaluated using β‑ray attenuation instruments configured with one legacy GF 10 channel and three new GF 10 channels. The resulting time‑series signals are presented in Figure 5.
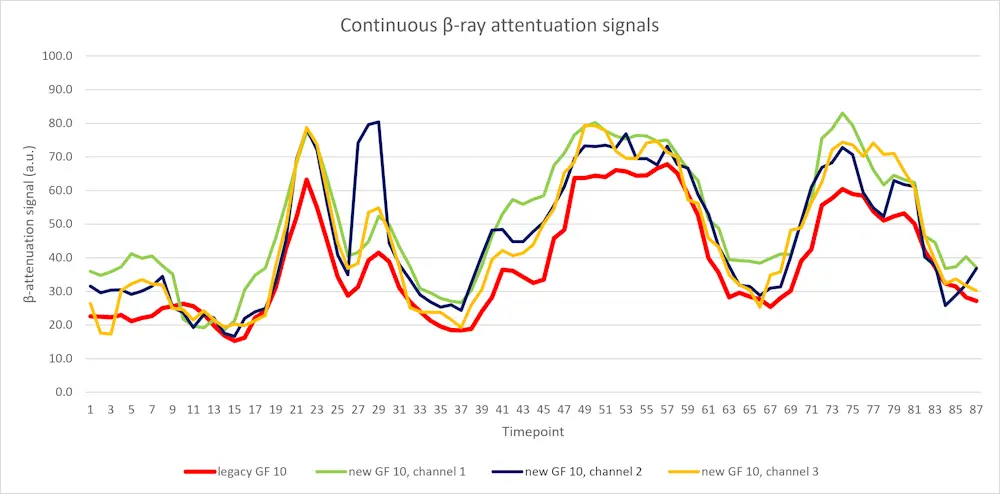
Fig 5. Continuous PM2.5 β‑ray attenuation time‑series signals measured using legacy GF 10 and new GF 10.
Across the full monitoring period, new GF 10 channels closely followed the legacy GF 10 channel, with matched baseline levels, short‑term fluctuations, and peak events.
A short‑term signal increase was observed on the new GF 10 channel 2 near time‑points 27-29, with smaller changes also visible in the remaining channels. The larger amplitude on channel 2 suggests that the event was instrument or sampling related rather than material specific, as all channels were exposed to the same ambient conditions. After this brief fluctuation, all channels returned to a consistent baseline without evidence of drift or divergence.
The consistent overlap of the time-series traces indicates that new GF 10 performs comparably to legacy GF 10 in continuous PM2.5 β‑attenuation monitoring workflows.
Conclusions
Comprehensive evaluation across material‑property testing and application‑level workflows showed that the new GF 10 performs comparably to the legacy material in particulate matter sampling, while providing improvements in several key physical parameters. The new GF 10 maintains the established basis weight specification while exhibiting increased thickness, substantially higher dry‑burst strength, improved water repellency, a modest reduction in pressure drop, and consistently high particle retention efficiency.
Gravimetric PM10 and PM2.5 testing showed closely aligned mass capture behavior across all runs under comparable conditions. For PM2.5, the new GF 10 consistently yielded slightly higher average concentrations compared to legacy GF 10. This tendency is consistent with the observed material properties, including greater thickness and higher particle retention efficiency, which may contribute to slightly higher capture of fine particulate matter.
Handling and thermal stability evaluations, including drop and drying tests, showed stable microgram-level mass behavior for both materials, indicating reliable performance during filter handling, conditioning, sampling, and post-sampling processing.
Continuous PM2.5 β-ray attenuation measurements showed consistent time-series behavior between the new and legacy materials, with aligned baseline response, transient events, and recovery characteristics. These results indicate that the new GF 10 performs comparably to legacy GF 10 in continuous monitoring workflows.
Overall, the combined improvements in mechanical strength, water repellency, flow resistance, and retention with comparable gravimetric and continuous monitoring performance, support the use of the new GF 10 in PM10, PM2.5, and continuous air‑monitoring applications within existing sampling frameworks. As with any filter media, final suitability should be verified in the intended customer application.
References
- World Health Organization. WHO Global Air Quality Guidelines. Geneva Who; 2021.
- US EPA. National Ambient Air Quality Standards (NAAQS) for PM. US EPA. Published April 13, 2020. https://www.epa.gov/pm-pollution/national-ambient-air-quality-standards-naaqs-pm
- US EPA O. Air Monitoring Methods - Criteria Pollutants. www.epa.gov. Published February 8, 2017. https://www.epa.gov/amtic/air-monitoring-methods-criteria-pollutants
- The Environment Agency 2024 UK Report for On-Going Particulate Matter (PM 10 and PM 2.5) Equivalence.; 2024. Accessed March 12, 2026. https://uk-air.defra.gov.uk/assets/documents/reports/cat05/2509300425_2024_Ongoing_Particulate_Matter_Equivalence_Report.pdf