

This work evaluates hollow fiber (HF) pore size, critical flux, and filtrate flux to define robust operating parameters for a CHO steady-state perfusion process using tangential flow filtration (TFF).
- The optimal pore size was 0.2 µm, showing stable transmembrane pressure (TMP) and sieving performance comparable to 0.45 µm and more favorable than 750 kDa or 0.65 µm.
- Critical flux experiments established operating limits, identifying ~ 9 LMH at 1000 s⁻¹ and ~ 13 LMH at 2000 s⁻¹ for the 0.2 µm HF filter.
- Higher filtrate flux increased fouling and TMP, with 6 LMH producing the steepest TMP rise and most pronounced sieving decay.
- Filtrate fluxes of 2 to 4 LMH delivered stable long-term performance, showing minimal impact on pressure or sieving during extended perfusion.
- A multiplex TFF setup enabled efficient comparison of multiple HF filters under identical culture conditions, accelerating parameter evaluation.
Introduction
Operating a continuous perfusion process with high viability and productivity at high cell concentration requires an effective cell‑retention strategy. In bioprocessing, HF filters used with TFF are one of the most established approaches for perfusion cell cultures. TFF performance directly influences cell viability, productivity, and product recovery, and can be affected by factors such as pore size, shear rate, filtrate flux, and the tendency of the membrane to foul over time. Selecting the right HF configuration and defining appropriate operating parameters are therefore essential to ensuring predictable filtration behavior throughout a perfusion cell culture.
In this work, we evaluated key HF and TFF parameters to define a robust process for a Chinese hamster ovary (CHO) perfusion cell culture. We performed the following experiments:
- Compare HF pore sizes and assess their impact on product sieving and fouling behavior.
- Determine the critical flux of the selected HF at different shear rates to guide filter sizing and flux selection.
- Investigate the effect of filtrate flux on long term filtration performance under steady state perfusion conditions.
Together, these experiments provide practical insight into HF selection and TFF operating limits for continuous CHO cell cultures.
Experiment 1: Investigating the impact of HF pore size on filtration performance
Materials and methods
We evaluated product sieving and filter fouling for different pore sizes in HF membranes during a perfusion cell culture. A multiplex TFF setup was designed to enable simultaneous investigation of four HF filters with loops connected to a single Xcellerex™ XDR-10 bioreactor. A CHO cell line producing mAbs was cultured in a steady-state perfusion process (Table 1). Four 3X2MA type HF filters, covering the ultrafiltration and microfiltration ranges, were evaluated (750 kDa, 0.2 µm, 0.45 µm, and 0.65 µm). We monitored feed, retentate, and permeate pressures in real time for each HF filter, and TMP evolution along with product sieving was used to assess filter fouling. The filter flux was kept equivalent for each filter and once steady state viable cell density had been achieved, it was fixed at 4 LMH. The bioreactor was inoculated to 0.8 million viable cells (MVC)/mL. Perfusion started on Day 2 of culture and cell bleed started on Day 8, one day before achieving the target viable cell density (VCD). Samples were taken daily from the bioreactor and harvest line throughout the duration of the culture to calculate the product sieving coefficient.
Table 1. Culture conditions and bioreactor settings for Experiments 1and 3 in XDR-10 multiplex TFF perfusion setup
| Parameter |
Setting |
|---|---|
| Culture working volume | 8 L |
| Temperature setpoint | 37°C |
| Agitation | 30–40 W/m3 |
| pH setpoint | 6.9 ± 0.1 |
| pH control | Upward: 7.5% w/v sodium bicarbonate; Downward: CO2 |
| DO setpoint | 40% |
| DO control | Cascade control by air and oxygen through 20 µm sintered sparge disc |
| Target VCD at inoculation | 0.9 ± 0.1 MVC/mL |
| Target VCD at steady state | 80 ± 10 MVC/mL |
| Target viability | > 90% |
| Target perfusion rate (CSPR) at steady state |
15 pL/cell/d |
| Recirculation flow rate |
77 mL/min per HF, equals 1000 s-1 shear rate. For HF with 0.65 µm pore size, 1000 s-1 shear rate is attained at 50 mL/min recirculation flow. |
| Culture medium |
Medium used in bioreactor at start: HyClone™ ActiPro™ medium Perfusion medium: ActiPro™ supplemented with CB1 and CB3 |
Results and discussion
Looking at the product sieving profiles, the 750 kDa HF displayed substantially lower sieving from the start, below 70%, but had less decay over time (Fig 1B). The 0.65 µm HF showed comparable performance with the 0.2 and 0.45 µm HF in the beginning but had the steepest sieving decay and the highest increase in TMP (Fig 1B and 2A).
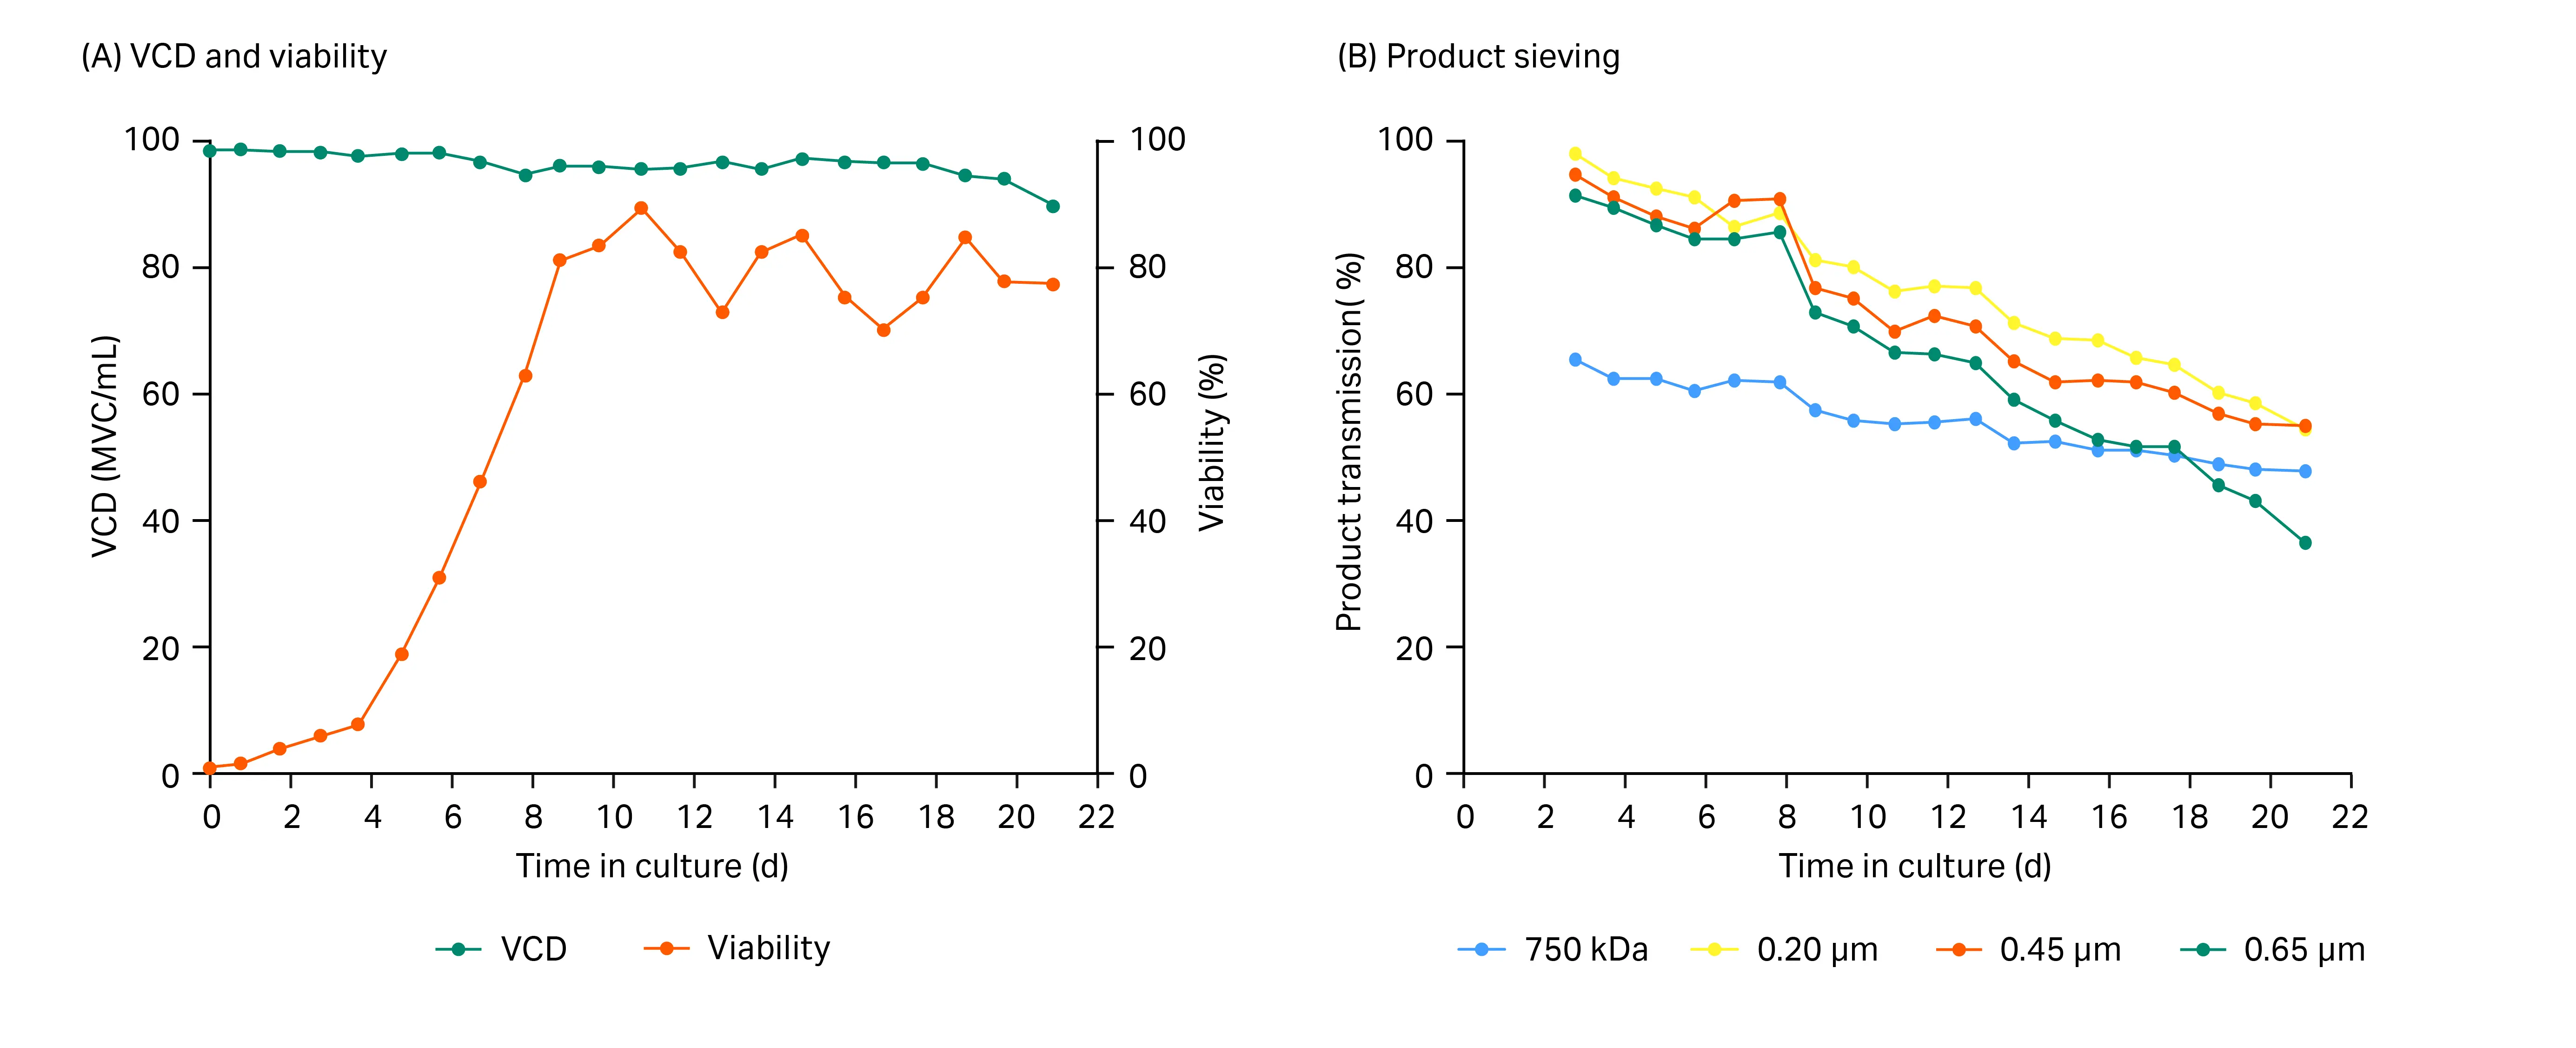
Fig 1. Graphs showing viable cell density and cell culture viability and product sieving for the duration of the culture. (A) Cell culture VCD and viability and (B) sieving of the IgG product for the tested HF filters.
The HF filters pressure trends were similar, except for the 0.65 µm HF which displayed a significantly higher feed pressure from Day 1 (Fig 2). The sharp increase from Day 0 to Day 1 indicates that the inlet might have become partially blocked during the first day of culture. When we examined the filters post-run dead cells and debris were found at the inlet of the 0.65 µm filter explaining the higher feed pressure observed.
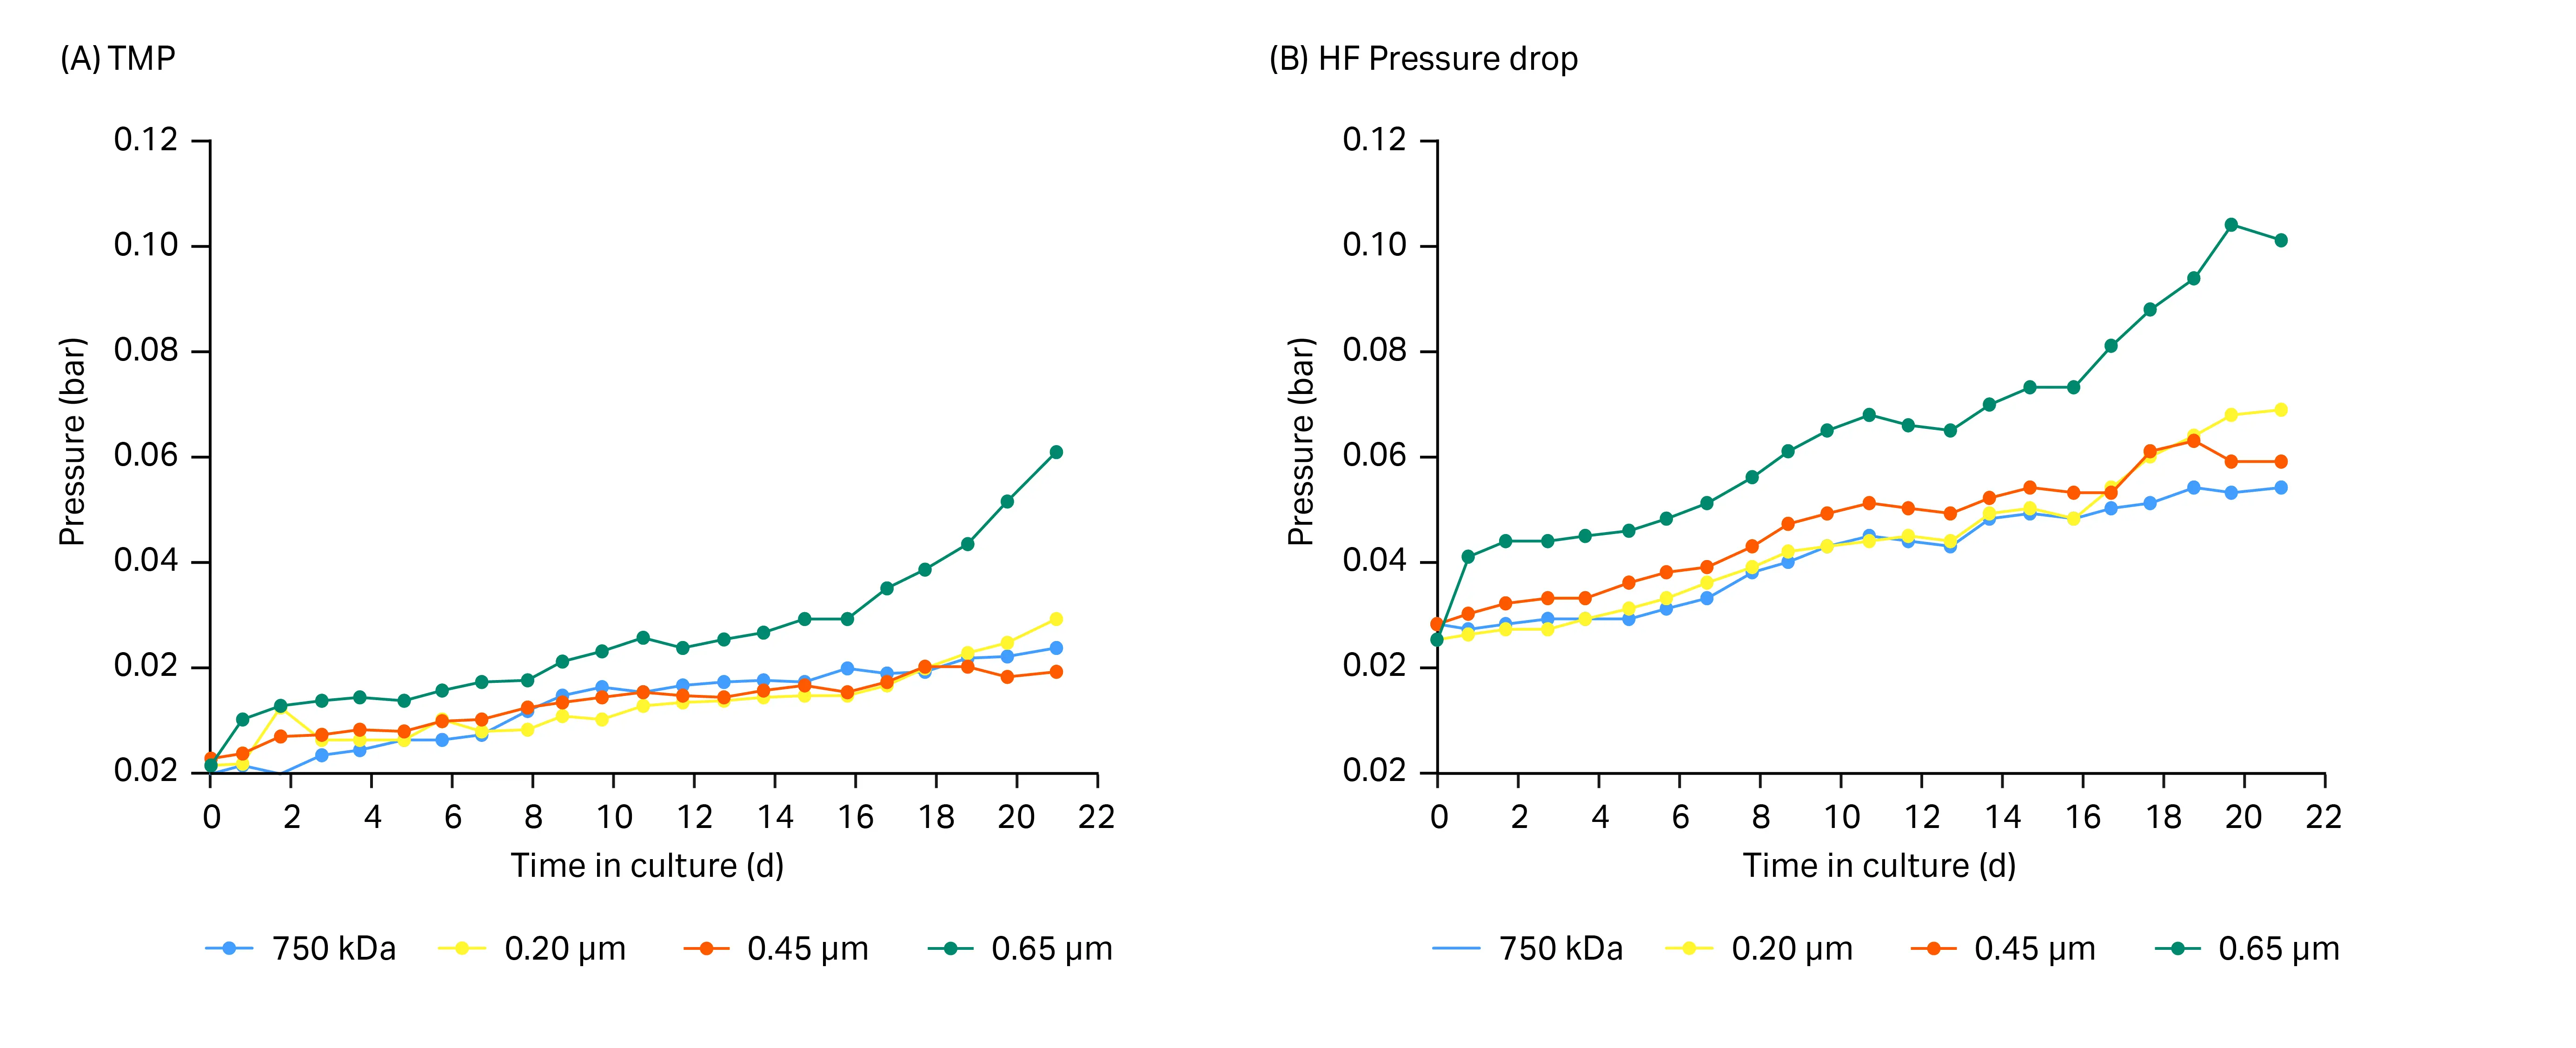
Fig 2. Graphs showing transmembrane pressure and pressure drop for the duration of the culture. (A) TMP and (B) pressure drop for the tested HF filters. 1 bar = 14.5 psi = 0.1 MPa.
In terms of filter performance, it was difficult to distinguish between 0.45 and 0.2 µm pore sizes (Fig 1–3). Both displayed similar sieving and TMP evolution. Consequently, either of these two could have been selected based on these criteria for the following experiments. Since 0.2 µm is widely used in perfusion, we selected that pore size for the following experiments.
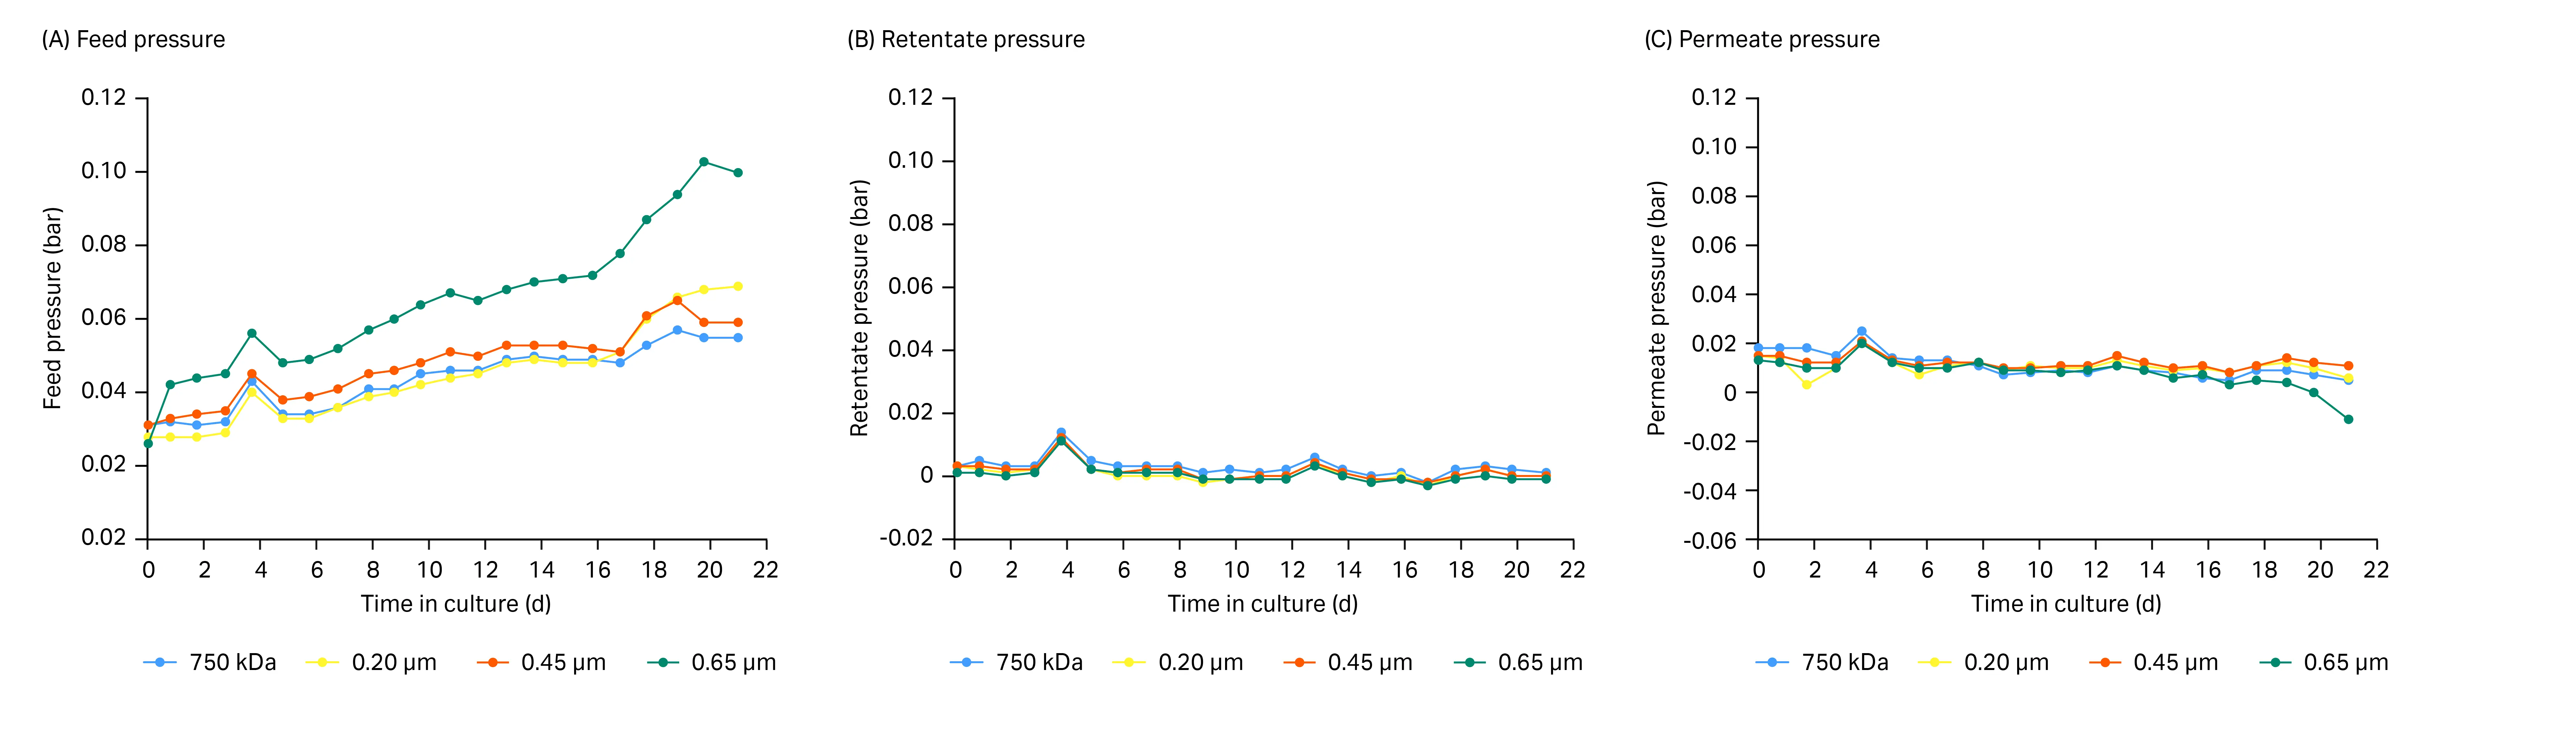
Fig 3. Graphs showing feed, retentate, and permeate pressure for the duration of the culture. (A) Feed pressure, (B) retentate pressure, and (C) permeate pressure. 1 bar = 14.5 psi = 0.1 MPa.
Experiment 2: Assessing the critical flux for the HF filter
Materials and methods
To estimate the flux operating range for the filter selected in Experiment 1, CFP-2-E-3X2MA (0.2 µm), we performed critical flux experiments in a small-scale perfusion culture. The aim was to establish the critical flux for the HF filter at two shear rates, 1000 and 2000 s-1. Feed, retentate and permeate pressures, and calculated TMP were logged in real time via the LCO-i100 console (Levitronix). At each shear rate we increased the filter flux in discrete steps until TMP was destabilized. Before and after each set of flux-ramping, samples of VCD and viability were taken to ensure these parameters remained within target.
Before initiating the flux experiments, we thawed a vial containing the mAb-producing CHO cell line and expanded it in a shake flask culture before inoculating the bioreactor (Table 2). We took samples once daily from the bioreactor and harvest line throughout the duration of the culture. Perfusion started on Day 3 and the target VCD of 80 MVC/mL was achieved on Day 8 at which cell bleeding started. We kept the cell concentration close to the target for the remainder of the culture and on Day 10 we initiated critical flux experiments. After finalizing these on Day 12, the culture was terminated.
Table 2. Culture conditions and bioreactor settings for flux excursion experiments in Applikon 2 L bioreactor
| Parameter |
Setting |
|---|---|
| Culture working volume | 1.5 L |
| Agitation | 30–40 W/m3 |
| Target perfusion rate (CSPR) at steady state | 15 pL/cell/d |
| Recirculation flow rate | 77 mL/min; Equals 1000 s-1 shear rate over HF |
| TFF loop flow path i.d. | 1/8 inch |
| Temperature setpoint | 37°C |
| pH setpoint | 6.8 ± 0.1 |
| pH control | Upward: 7.5% w/v sodium bicarbonate; Downward: CO2 |
| Dissolved oxygen (DO) setpoint | 40% |
| DO control | Air primarily and oxygen secondarily through 15 µm sintered sparger |
| pCO2 control |
L-sparger 7×1mm drilled holes. Increase by 10 mL/min incrementally if pCO2 > 14 kPa. |
| Target inoculation cell conc. |
0.9 ± 0.1 MVC/mL |
| Target steady state VCD |
80 ± 10 MVC/mL |
| Target viability |
> 90% |
| Culture medium |
Medium used at start and during flux excursion: HyClone™ ActiPro™ medium. Perfusion medium: HyClone™ ActiPro™ medium supplemented with CB1 and CB3. |
Results and discussion
As indicated in Figure 5 (orange marking), critical flux was found at 9 LMH applying 1000 s-1 and 13 LMH when applying 2000 s-1 shear rate. The point at which the critical flux is found is to some extent dependent on what rate of TMP increase one allows for, as can be seen in Table 3 and 4. Therefore, the safety margin between the critical flux and the highest flux applied in the perfusion process should be set wide.
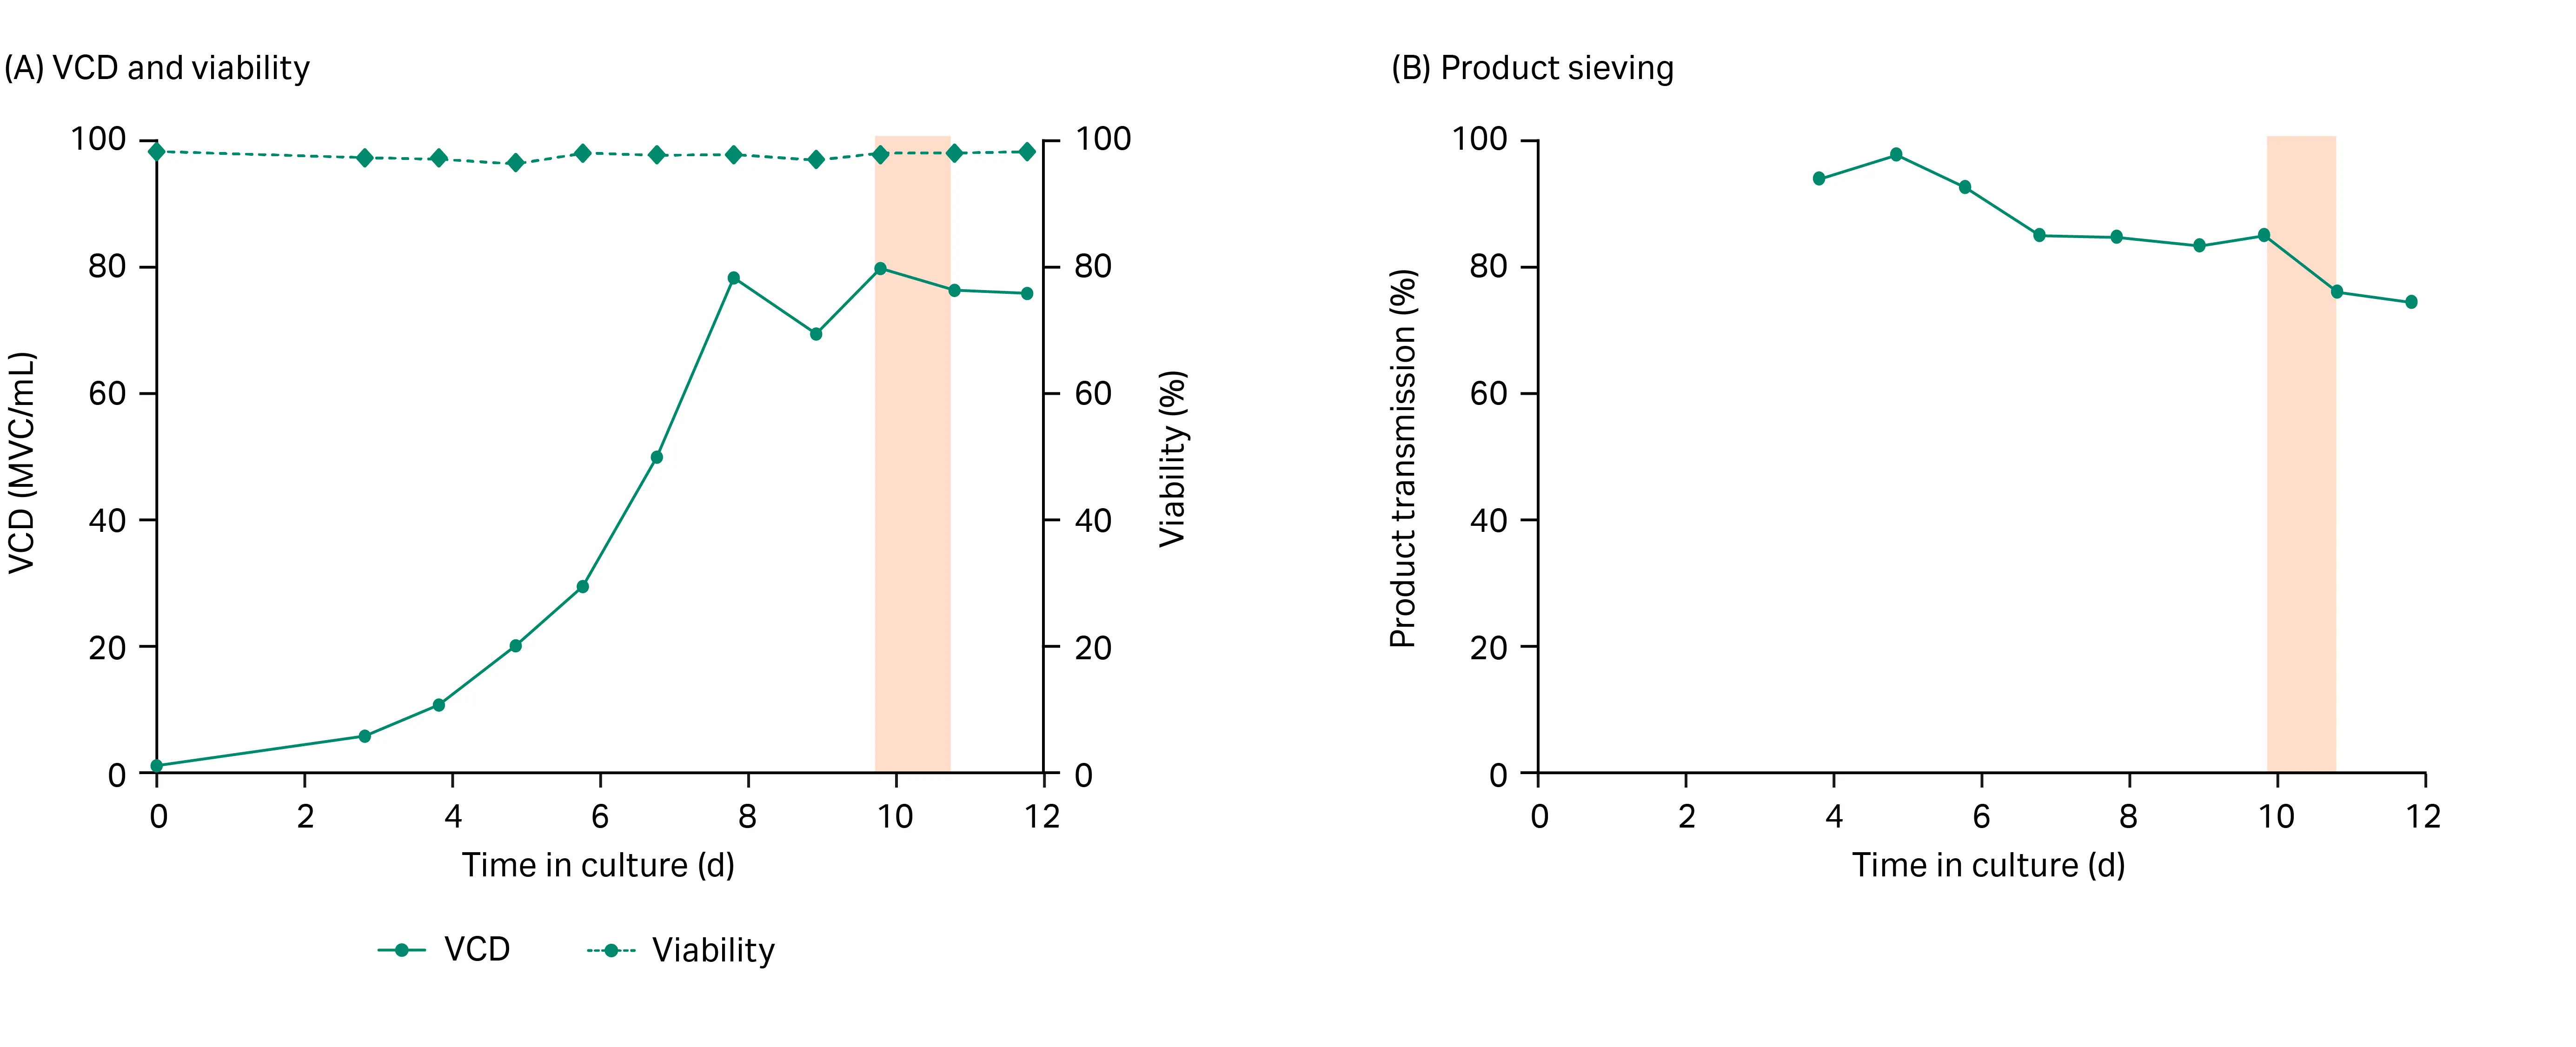
Fig 4. Graphs showing viable cell density, cell viability, and product sieving for the duration of the culture in Experiment 2. (A) Cell culture VCD and viability and (B) product sieving. orange marking indicates time of critical flux experiments.
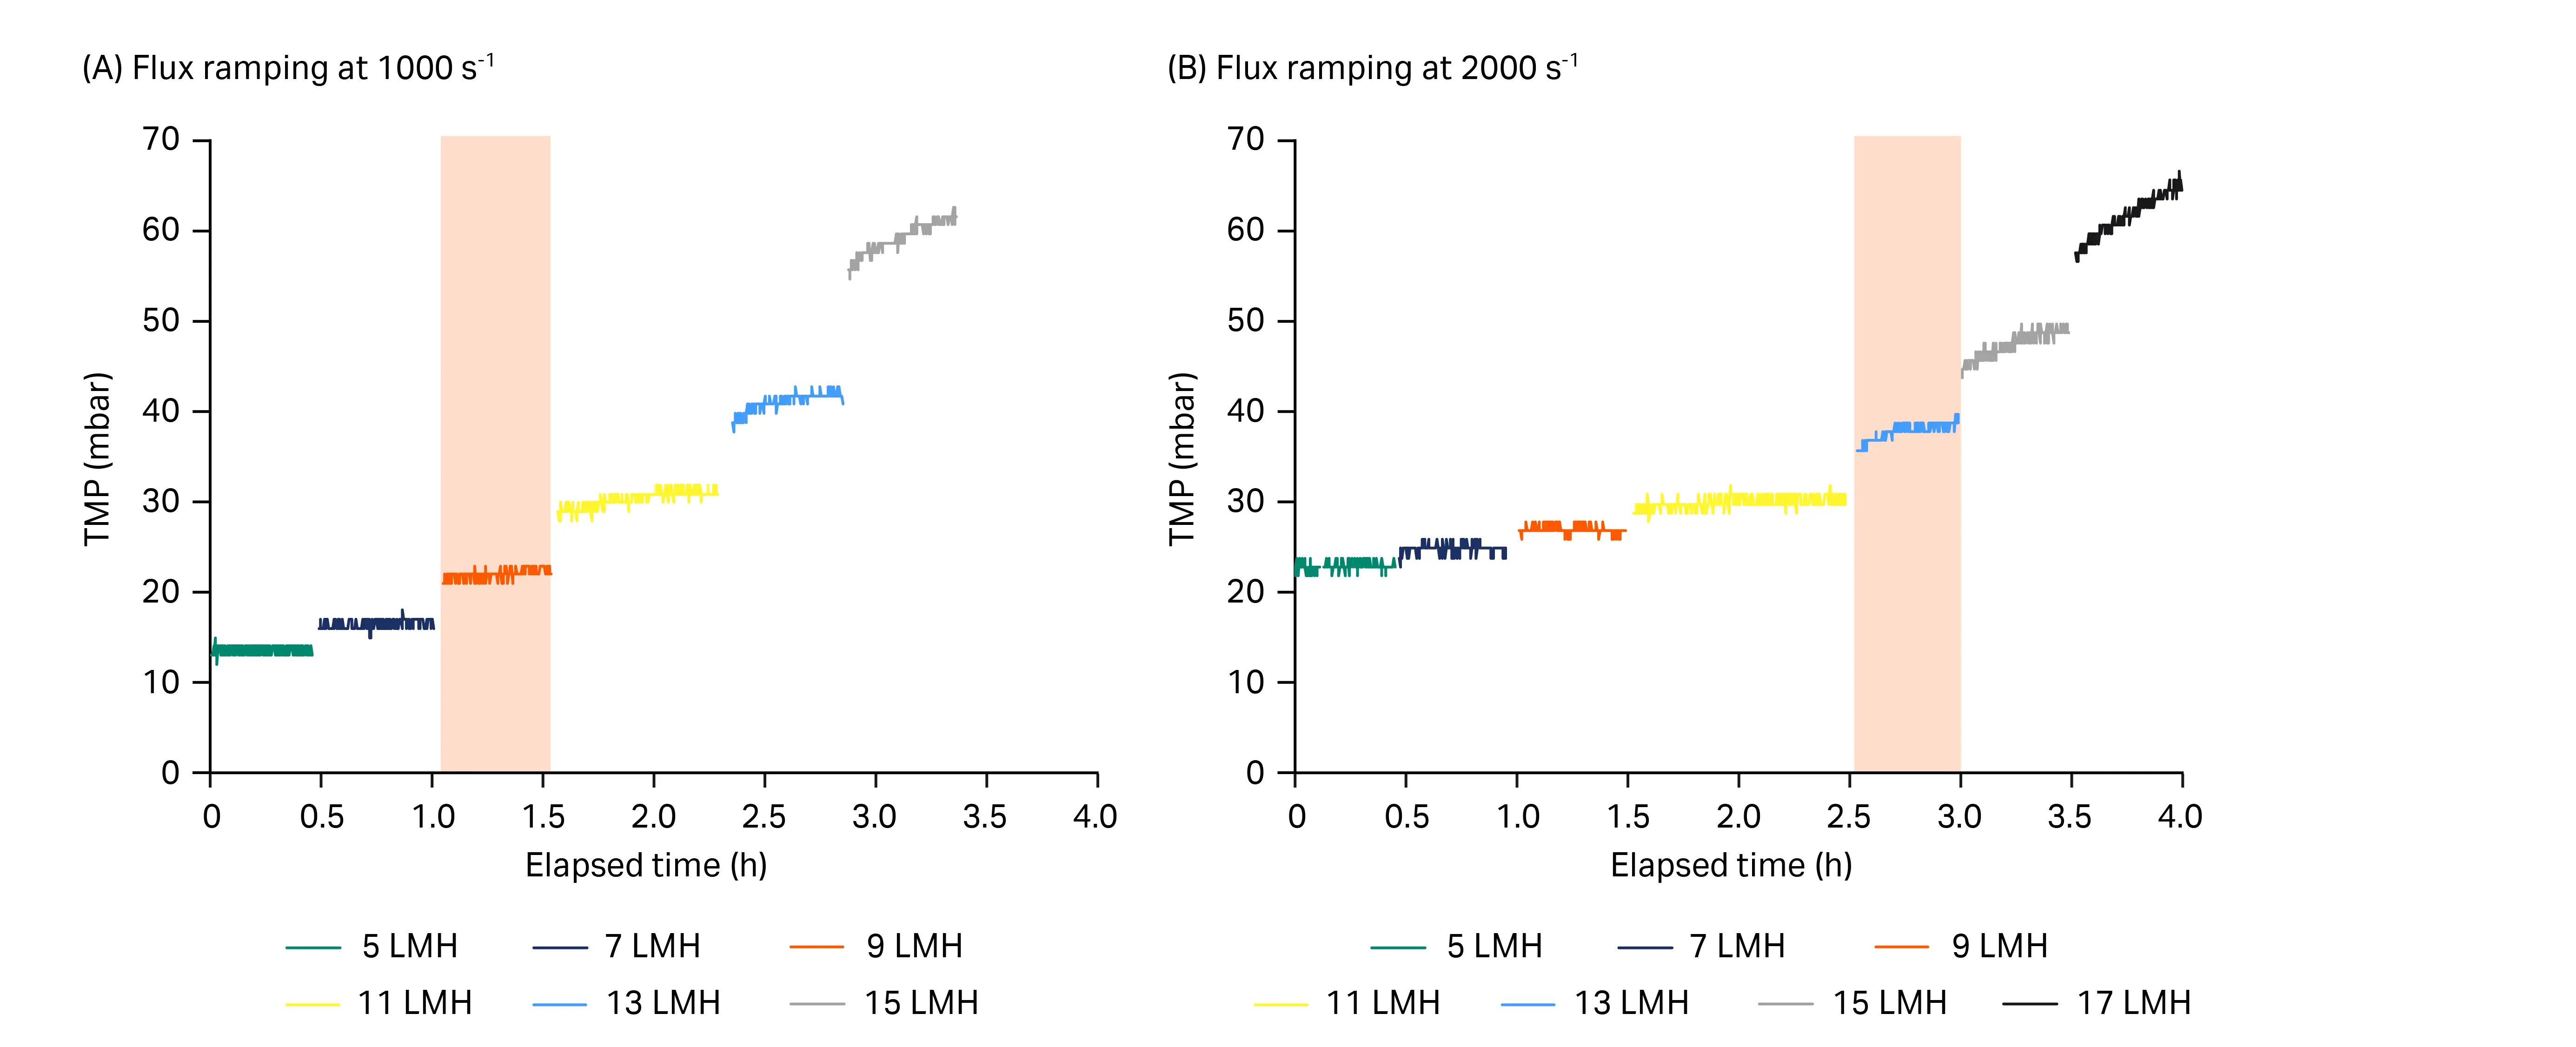
Fig 5. Graphs showing critical flux tests at two different shear rates. Orange marking indicates time of critical flux experiments. (A) 1000 s-1 shear rate and (B) 2000 s-1 shear rate. 1 bar = 14.5 psi = 0.1 MPa.
Table 3. Summary of experiments at 1000 s-1 shear rate
| Permeate flow rate (mL/min) |
Permeate flux (LMH) |
TMPmin (mbar) |
TMPmax (mbar) |
Slope (mbar/h) |
R2 |
|---|---|---|---|---|---|
| 1.92 | 5 | 12 | 15 | -0.05 |
0.00 |
| 2.68 | 7 | 15 | 18 | 1.06 |
0.09 |
| 3.45 | 9 | 21 | 23 | 2.29 |
0.30 |
| 4.22 | 11 | 28 | 32 | 3.62 |
0.64 |
| 4.98 | 13 | 38 | 43 | 5.99 |
0.70 |
| 5.75 | 15 | 55 | 63 | 11.60 |
0.89 |
Table 4. Summary of experiments at 2000 s-1 shear rate
| Permeate flow rate (mL/min) |
Permeate flux (LMH) |
TMPmin (mbar) |
TMPmax (mbar) |
Slope (mbar/h) |
R2 |
|---|---|---|---|---|---|
| 1.92 | 5 | 22 | 24 | 0.64 | 0.03 |
| 2.68 | 7 | 23 | 26 | 0.16 |
0.00 |
| 3.45 | 9 | 26 | 28 | -0.53 |
0.03 |
| 4.22 | 11 | 28 | 32 | 1.01 |
0.21 |
| 4.98 | 13 | 36 | 40 | 5.76 |
0.68 |
| 5.75 | 15 | 44 | 50 | 8.73 |
0.79 |
| 6.52 | 17 | 57 | 67 | 15.26 |
0.94 |
Additionally, there are limitations in pressure sensor resolution at the low level of pressure employed in small-scale TFF perfusion and the extensive duration of perfusion applications is additionally a challenge to utilize the critical flux methodology. Finally, critical flux will likely vary with cell type, cell concentration, and viability.
All this considered, the results indicate that critical flux can serve as a guideline in determining the operational flux and sizing the filter to culture volume for perfusion applications. To get a fair assessment of the critical flux, testing should be limited to one flux ramp-up per HF filter.
Experiment 3: Studying the effect of filtrate flux on filter performance
Materials and methods
In a third and final experiment, we investigated the effect of filter flux on performance using the 2 µm HF filter. Four identical HF filters (CFP-2-E-3X2MA) were investigated in the Xcellerex™ XDR-10 bioreactor multiplex TFF setup. The same CHO cell line as in Experiment 1 and 2 was cultured in steady-state perfusion. Again, we monitored feed, retentate, and filtrate pressure along with TMP for the entire run. Product sieving and TMP evolution was utilized to evaluate filter performance.
We set the filter flux to three different levels at steady state—2, 4, and 6 LMH. The 2 LMH setting was run in duplicate to assess the filter-to-filter variability. We inoculated the bioreactor to 0.8 MVC/mL and started perfusion on Day 2 of culture. Cell bleed started Day 8, one day before achieving the target VCD of 80 MVC/mL. The cell concentration was thereafter kept around the target for 20 d and samples were taken daily from the bioreactor and harvest line to calculate the sieving coefficient.
Results and discussion
Product sieving profiles were surprisingly similar for the tested fluxes and were comparable to historical sieving data for this process and 3X2MA HF at a steady state flux of 3 LMH (Fig 6). The HF with highest flux (6 LMH) displayed somewhat higher product sieving decay towards the end of the run and had a sieving coefficient of 59% at harvest compared to the other HF filters ending at slightly below 70%.
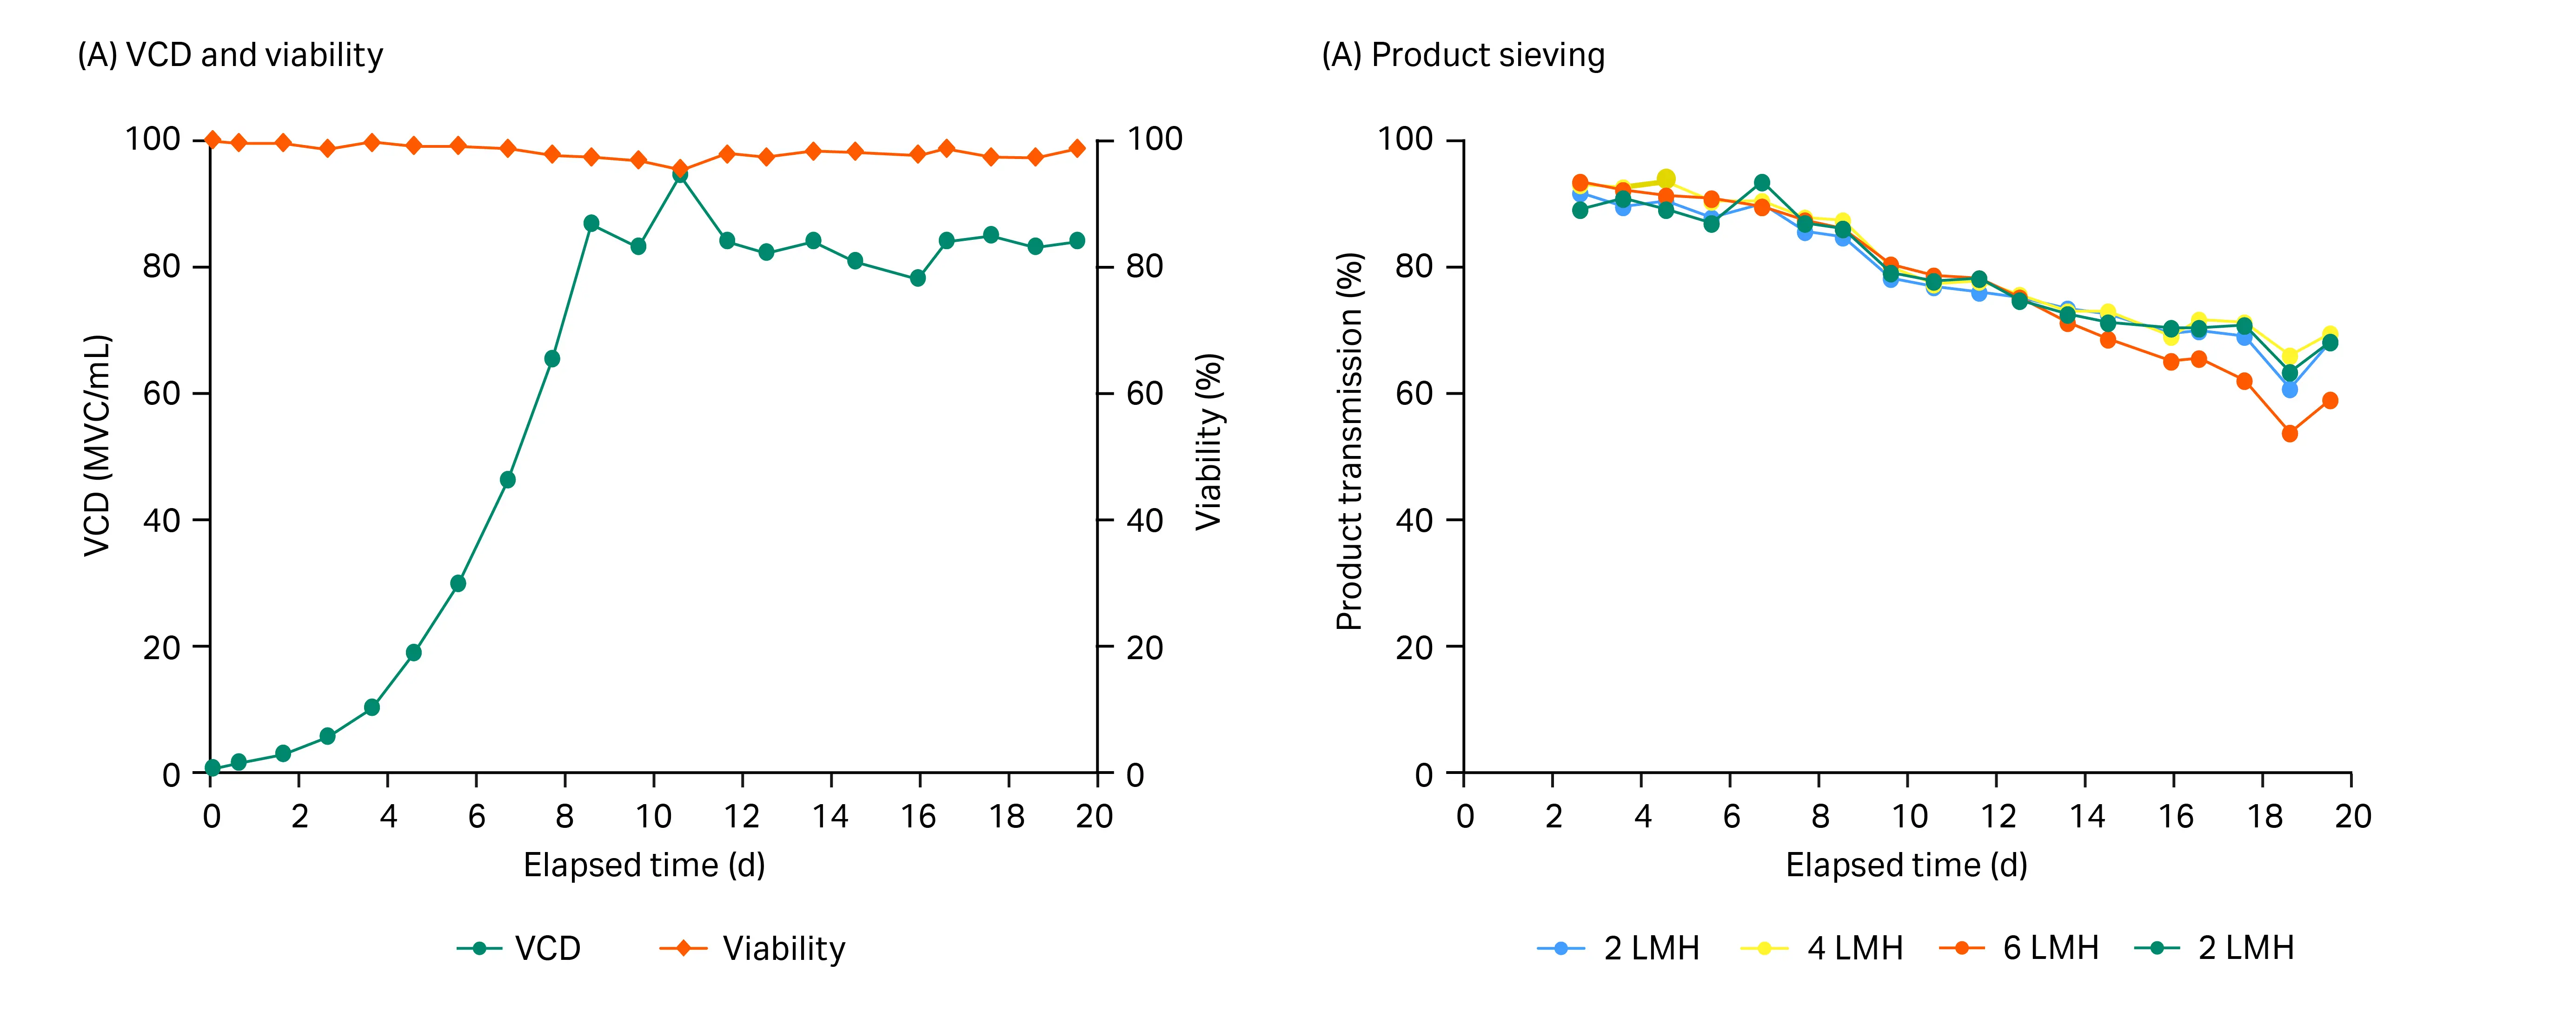
Fig 6. Graphs showing viable cell density and cell viability for the duration of the cell culture, and product sieving at different filtrate flux. (A) Cell culture VCD and viability and (B) sieving of IgG product for HF filters tested at different filtrate flux.
Looking at pressure, the different filter fluxes resulted in similar pressure profiles for feed and retentate pressure and thus pressure drop (Fig 7 and 8). However, the permeate pressure of the filter employed at the highest flux (6 LMH) started dropping sharply after 10 d and thus resulting in a TMP increase. At harvest, the TMP was 40 mbar for the 6 LMH filter which was roughly double the TMP of the other filters that shared a similar TMP profile throughout the run. Examining the filters post-run showed no dead cells or cell debris at the filter inlets, consistent with the feed-pressure profiles.
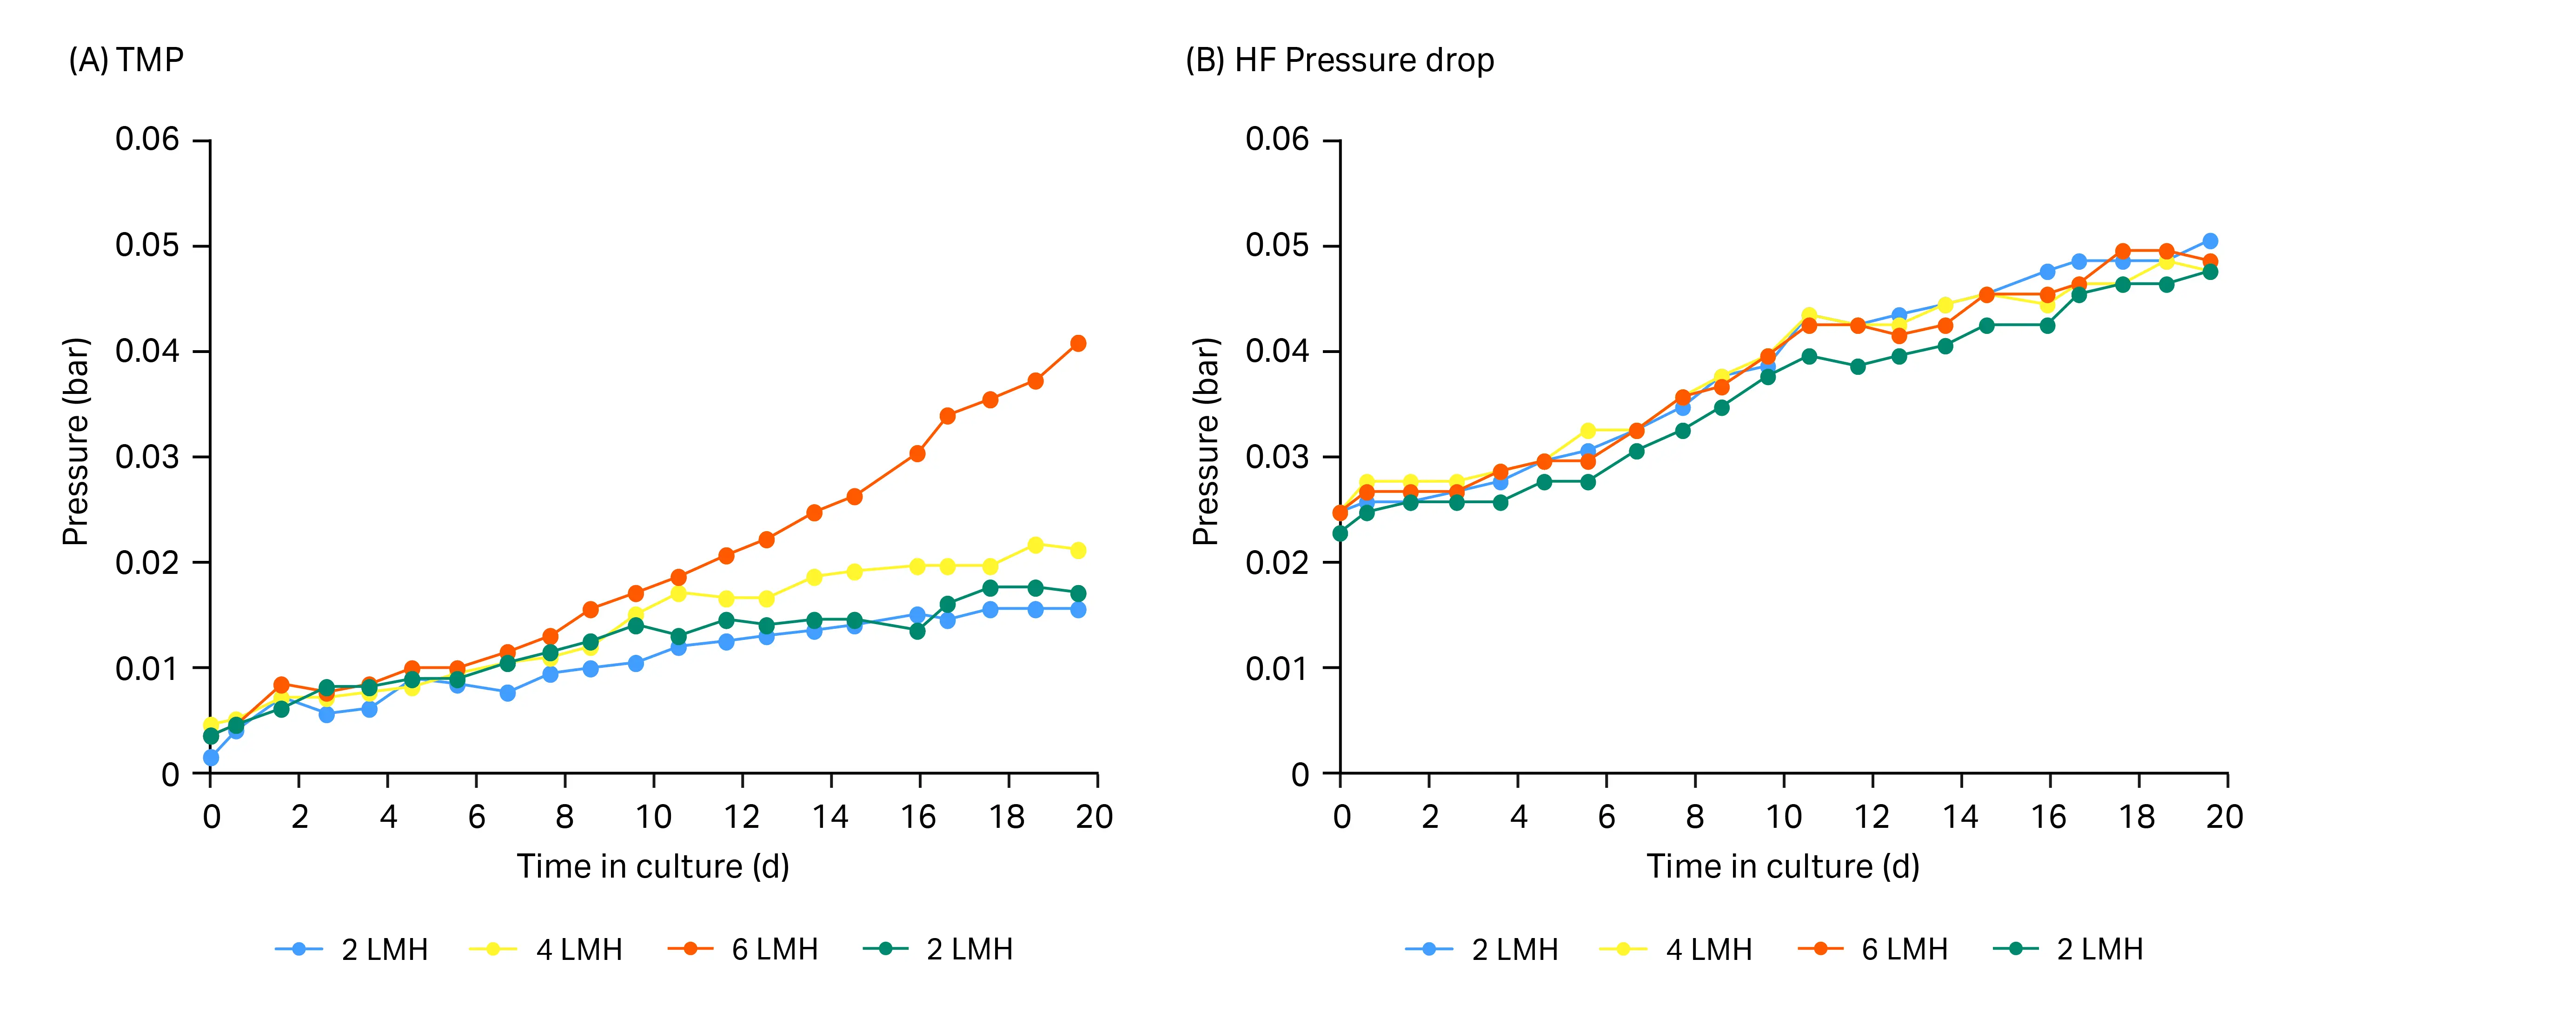
Fig 7. Graphs showing transmembrane pressure and pressure drop for the duration of the cell culture. (A) TMP and (B) pressure drop for HF filters tested at different filtrate flux. 1 bar = 14.5 psi = 0.1 MPa.
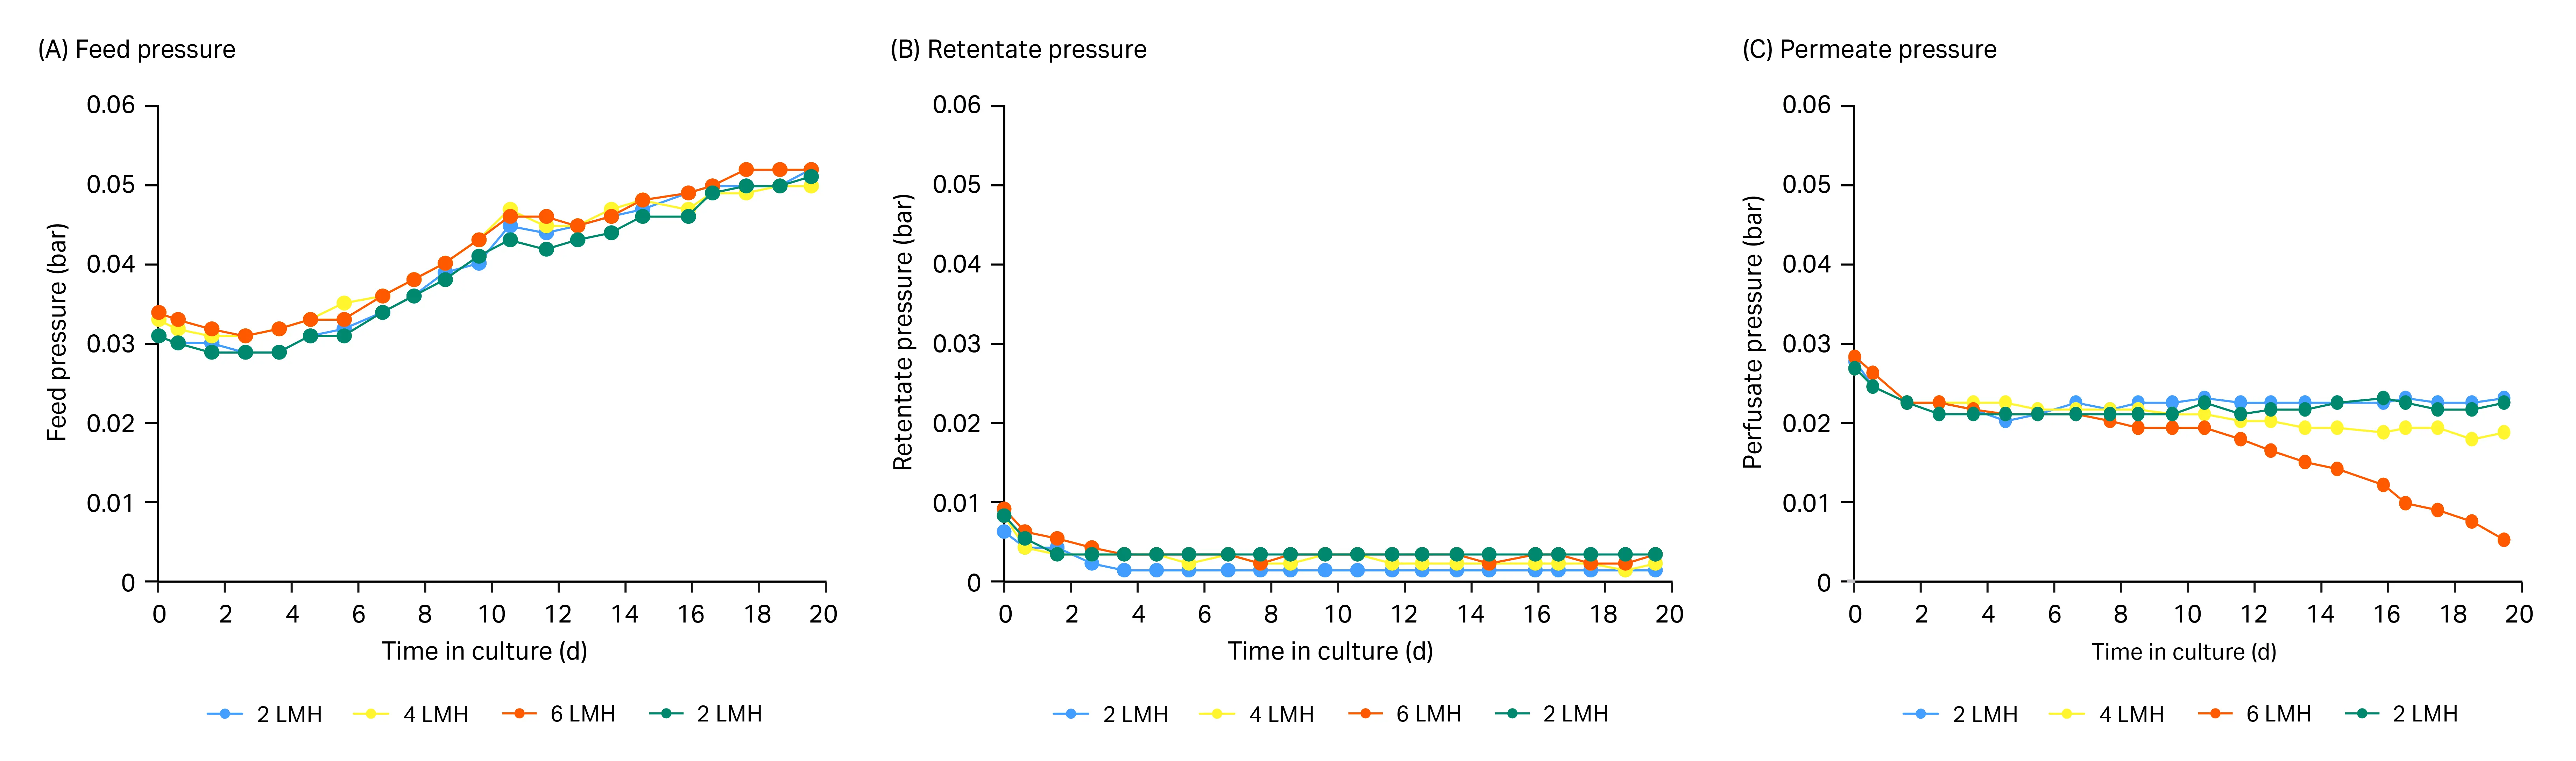
Fig 8. Graphs showing feed, retentate, and permeate pressure at different filtrate flux for the duration of the cell culture. (A) Feed pressure, (B) retentate pressure, and (C) permeate pressure. 1 bar = 14.5 psi = 0.1 MPa.
Summary and conclusions
We have performed a series of experiments to select the most favorable HF configuration and optimize TFF parameters for a CHO cell steady-state perfusion process. To accelerate experimentation, a multiplex TFF test setup was constructed for Experiments 1 and 3.
In the first study, we evaluated ultrafiltration and microfiltration 3X2 HF filters with respect to sieving and fouling. Results showed significantly different sieving decay profiles for the 750 kDa and 0.65 µm HF filters. The 750 kDa filter displayed a flat sieving decay profile but started at lower level compared to the other filters. The 0.65 µm pore size had the largest TMP increase and lowest sieving towards the end of the run. The 0.2 and 0.45 µm HF filters displayed similar sieving performance and pressure profiles. We decided to move forward with 0.2 µm for the remaining experiments.
In the second study, we performed critical flux experiments in perfusion cell culture to establish the critical flux at two different shear rates for the CFP-2-E-3X2MA HF filter. The results showed a destabilization of the TMP around 9 LMH at 1000 s-1 and 13 LMH at 2000 s-1 shear rate. The results indicate that the critical flux methodology could be employed in perfusion cell culture to assess the possible flux range to operate within and thus provide guidance on filter sizing.
The third study aimed to assess the impact of permeate flux on filter performance. The impact on product sieving was unexpectedly small in the tested range of 2 to 6 LMH. The effect on pressure profiles was more substantial and as expected the highest flux resulted in steepest TMP increase over time. Results showed correlation between higher flux and increased fouling as well as lower sieving. The difference in performance between 2 and 4 LMH was marginal, at 6 LMH the impact on sieving was more pronounced.
Frequently asked questions (FAQ)
What pore size should I use for CHO perfusion with a hollow fiber TFF device?
Based on these experiments, 0.2 µm and 0.45 µm pore sizes perform similarly, but 0.2 µm is widely used for in perfusion cell culture.
How do I determine the critical flux for my perfusion process?
Critical flux is identified by gradually increasing permeate flux until TMP begins to destabilize. In this study, the critical flux for the 0.2 µm 3X2MA hollow fiber was ~ 9 LMH at 1000 s⁻¹ and ~ 13 LMH at 2000 s⁻¹. Only one flux ramp per filter should be used for reliable results.
Does shear rate affect critical flux?
Yes. Higher shear rate increases the critical flux threshold by reducing cake formation and concentration polarization. This allows operation at higher permeate flux without TMP instability. In cell culture perfusion, a higher shear rate may also negatively impact (shear) the cells, and so a compromise is needed when selecting the shear rate to operate at. Shear rates above 2000 s-1 are generally not employed in perfusion cell culture.
How does filtrate flux affect hollow fiber fouling?
Fluxes from 2 to 4 LMH resulted in similar TMP and sieving profiles. At 6 LMH, fouling increased, TMP rose more steeply, and sieving decayed faster, indicating a higher risk of long-term performance decline.
Does filtrate flux influence product sieving?
Only marginally within the tested range. Product sieving remained relatively stable from 2 to 4 LMH; at 6 LMH a modest decrease in sieving was observed toward the end of the culture.
How important is filter-to-filter variability?
In Experiment 3, duplicate runs at 2 LMH showed near identical performance, confirming that 3X2MA hollow fibers exhibit low variability under controlled conditions.
Can I use critical flux from small-scale perfusion for scale-up?
Yes, but with caution. Critical flux depends on cell type, viability, concentration, shear rate, and culture duration. Use critical flux as a guideline, combined with a conservative operating margin for production-scale processes.
Is a multiplex TFF setup necessary for this type of evaluation?
Not required but highly beneficial. Multiplexing enables parallel, controlled comparison of multiple hollow fibers, significantly reducing development time and improving data consistency.
CY57286