Bioreactor scalability is a critical factor in developing cell culture processes for commercial biologics manufacturing. Selecting the right scaling strategy can be challenging, especially when bioreactors differ significantly in geometry. In this study, we evaluated approaches for bridging early development and pilot-scale operations.
Our study highlights two practical strategies for achieving consistent performance (growth, titer and product quality) across scales:
- Maintain similar tip speeds for bioreactor scale-up from 250 mL to 50 L scale
Aligning tip speeds between Ambr 250 (macro sparger) and Xcellerex™ XDR-50 (dual spargers) enables comparable total gas flow per unit volume (vvm) of air and oxygen, supporting similar culture performance across scales. - Match power per unit volume (P/V) and total vvm for cell culture scale-up with Xcellerex™ XDR bioreactor series
Successful bioreactor scalability within the XDR bioreactor platform can be achieved by harmonizing power input per unit volume and total gas flow, ensuring robust process transfer from pilot to production scale.
Introduction
Mini-bioreactor systems provide high-throughput capabilities for testing multiple culture conditions and are commonly employed for clone screening, media optimization, and early-stage process development. Mini-bioreactors have also proven useful as scale-down models for pilot and production-scale bioreactors—provided that appropriate scaling strategies are applied to ensure comparable growth environments and culture performance across scales (1).
While scale-independent process parameters such as temperature, feed strategy, and pH control are straightforward to transfer between culture scales, dissolved oxygen (DO) control presents greater complexity due to interdependent factors such as agitation, gas flow, and sparger configuration. Geometric differences between bioreactor designs further complicate scaling. Additionally, when designing scale-down models, constraints on agitation and gas flow at production scale must be considered to maintain process relevance.
For bioreactor users, key levers for DO control include agitation rate, gas flow rates, and sparger selection. Traditional bioreactor scale-up and scale-down approaches often rely on holding one or two parameters constant, such as:
- Power per unit volume (P/V)
- Tip speed
- Gas flow per unit volume (vvm)
- Mixing time
- Oxygen mass transfer coefficient (kLa)
The choice of scaling strategy depends on the systems and scales involved. For example, matching P/V and vvm while maintaining the oxygen transfer rate (OTR) has proven effective for scaling within our Xcellerex™ XDR bioreactor series. P/V serves as a proxy for mixing, mass transfer, and shear, while matching vvm and OTR ensures adequate CO2 stripping and oxygen supply, respectively. However, when scaling from mini- and micro-bioreactors (≤ 250 mL), where turbulent flow may not be achievable, tip speed is commonly used (2, 3).
In this study, a CHO fed-batch cell culture scale up process for monoclonal antibody (mAb) production was transferred from Xcellerex™ XDR-50 and XDR-500 bioreactors to Ambr 250 mini-bioreactors. Six agitation rates—covering overlapping tip speeds and P/V values used at 50 L scale—were tested to evaluate the applicability of different scaling strategies for process transfer between Ambr 250 and Xcellerex™ XDR bioreactors.
Materials and Methods
Seed expansion
CHO cells were expanded in ActiPro™ medium and maintained in early exponential growth phase (0.3–6.0 × 10⁶ viable cells/mL). Cells were sub-cultured in shake flasks until enough cells were available for bioreactor inoculation. For 250 mL production bioreactors, inoculation was performed directly from shake flasks. For 50 L and 500 L production bioreactors, the seed train was extended through 1 to 2 passages in ReadyToProcess WAVE™ 25 rocking bioreactors. At 500 L scale, the final day of seed expansion was carried out in the production bioreactor by inoculating at half the initial fed-batch volume, followed by a media top-up to full working volume after one day of growth.
Fed-batch process
The production stage was performed as a fed-batch process in three systems: Ambr 250, Xcellerex™ XDR-50, and Xcellerex™ XDR-500. Key bioreactor features are summarized in Table 1. The Ambr 250 fed-batch cultures were operated in duplicate at six different agitation rates. Calculations of tip speed and power input per unit volume (P/V) were performed using our Bioreactor Scaler tool. All bioreactors were inoculated at approximately 1 × 10⁶ viable cells/mL and operated according to the settings listed in Table 2.
In the XDR-50 and XDR-500 bioreactors equipped with dual spargers, a 20 µm sparger was used for DO control, while Ambr 250 vessels used a single open-pipe sparger. During the initial 1 to 2 culture days when oxygen demand was low, DO was maintained using air only.
At 250 mL scale, the initial air flow was set to match the combined air vvm (sparger 1 + 2) used in 50 L and 500 L scales. The DO controller gradually increased air flow until reaching a predefined cap of approximately 0.01 vvm, comparable to the total air vvm in the 50 L and 500 L scales at the point of gas transition from air to oxygen for DO control. After this point, air flow through the primary sparger was reduced and gradually replaced by oxygen as the main gas for DO regulation across all systems.
Cultures were sampled daily, and antifoam was added as needed for foam control. From Day 3 onward, bolus feeding was performed daily using HyClone™ Cell Boost™ 7a and 7b supplements, as detailed in Table 2. Additional glucose was supplied as required to maintain a total concentration of 4 to 6 g/L after feeding, including glucose contributed by HyClone™ Cell Boost™ 7a.
Following each feed, agitation rates were increased to maintain the target P/V. In XDR-50 and XDR-500 bioreactors, macro sparger air flow was adjusted as needed to control pCO2 levels. To achieve comparable pCO2 profiles between the 50 L and 500 L scales, macro sparger air flow was set to maintain a consistent total vvm (combined air and oxygen through both spargers) across scales.
Table 1. Bioreactors used in this scale up study
| Fed-batch process scale | 250 mL | 50 L | 500 L |
|||
|---|---|---|---|---|---|---|
| Culture stage | N Production |
N-1 Seed |
N Production |
N-2 Seed |
N-1 Seed |
N Production |
| Bioreactor system | Ambr 250 | WAVE 25 | XDR-50 |
WAVE 25 |
WAVE 25 |
XDR-500 |
| Vessel size | 12 × 250 mL | 1 × 20 L | 1 × 50 L |
1 × 10 L |
2 × 50 L |
1 × 500 L |
| Spargers used | Open pipe | N/A |
|
N/A |
|
|
| Impeller type | Dual pitch-blade | N/A | Single bottom-mounted pitch-blade |
N/A |
Single bottom-mounted pitch-blade |
|
| Impeller Np | 1.34 | N/A | 0.80 |
N/A |
0.97 |
|
| Impeller Di |
2.6 cm |
N/A |
22.05 cm |
N/A |
26.37 cm |
|
Note: N refers to the production stage, while N-1 and N-2 represents the seed cultures used to inoculate the N and N-1 bioreactors, respectively. Np is the impeller power number, Di is the impeller diameter.
Table 2. Fed-batch process conditions
| Ambr 250 | XDR-50 | XDR-500 |
|
|---|---|---|---|
| Inoculation cell concentration | 1 × 10⁶ viable cells/mL | ||
| Cell culture media | ActiPro™ medium | ||
| Feed solution 1 | HyClone™ Cell Boost™ 7a supplement |
||
| Feed solution 2 | HyClone™ Cell Boost™ 7b supplement |
||
| Glucose solution | 400 g/L stock |
||
| Feed strategy | Daily addition from Day 3 and onwards:
|
||
| Glucose strategy |
Lactate production phase:
|
||
Lactate consumption phase:
|
|||
| Temperature |
37°C |
||
| pH setpoint |
6.95 ± 0.15 |
||
| pH control |
Upward: 7.5% w/v sodium bicarbonate Downward: CO2 (macro sparger) |
||
| DO setpoint |
40% air saturation |
||
| DO control |
Air/oxygen on demand through macro sparger |
Air/oxygen on demand through micro sparger |
Air/oxygen on demand through micro sparger |
| Initial culture volume |
175 mL |
36 L |
350 L |
| P/V |
|
40 W/m3 | 40 W/m3 |
| Tip speed |
|
1.05–1.2 m/s |
1.9–2.1 m/s |
| Initial air flow (vol/min) |
0.5 mL/min |
Sparge 1: 0.04 SLPM Sparge 2: 0.1 SLPM |
Sparge 1: 0.1 SLPM Sparge 2: 1 SLPM |
| Total initial air flow (vvm) |
0.003 min-1 |
0.004 min-1 |
0.003 min-1 |
| Air – sparge 1 cap |
1.4 mL/min |
0.4 L/min |
1 L/min |
| Oxygen flow – sparge 1 |
On demand when sparge 1 air cap flow reached |
||
Results
Cell growth
Cell growth and viability across all culture scales, from 250 mL to 500 L, are presented in Figure 1. All cultures exhibited comparable growth profiles throughout the process duration. Furthermore, the wide range of agitation rates applied at the 250 mL scale did not significantly affect growth performance, demonstrating a broad operational design space that allows flexibility in agitation rate selection without adverse impact on cell growth.
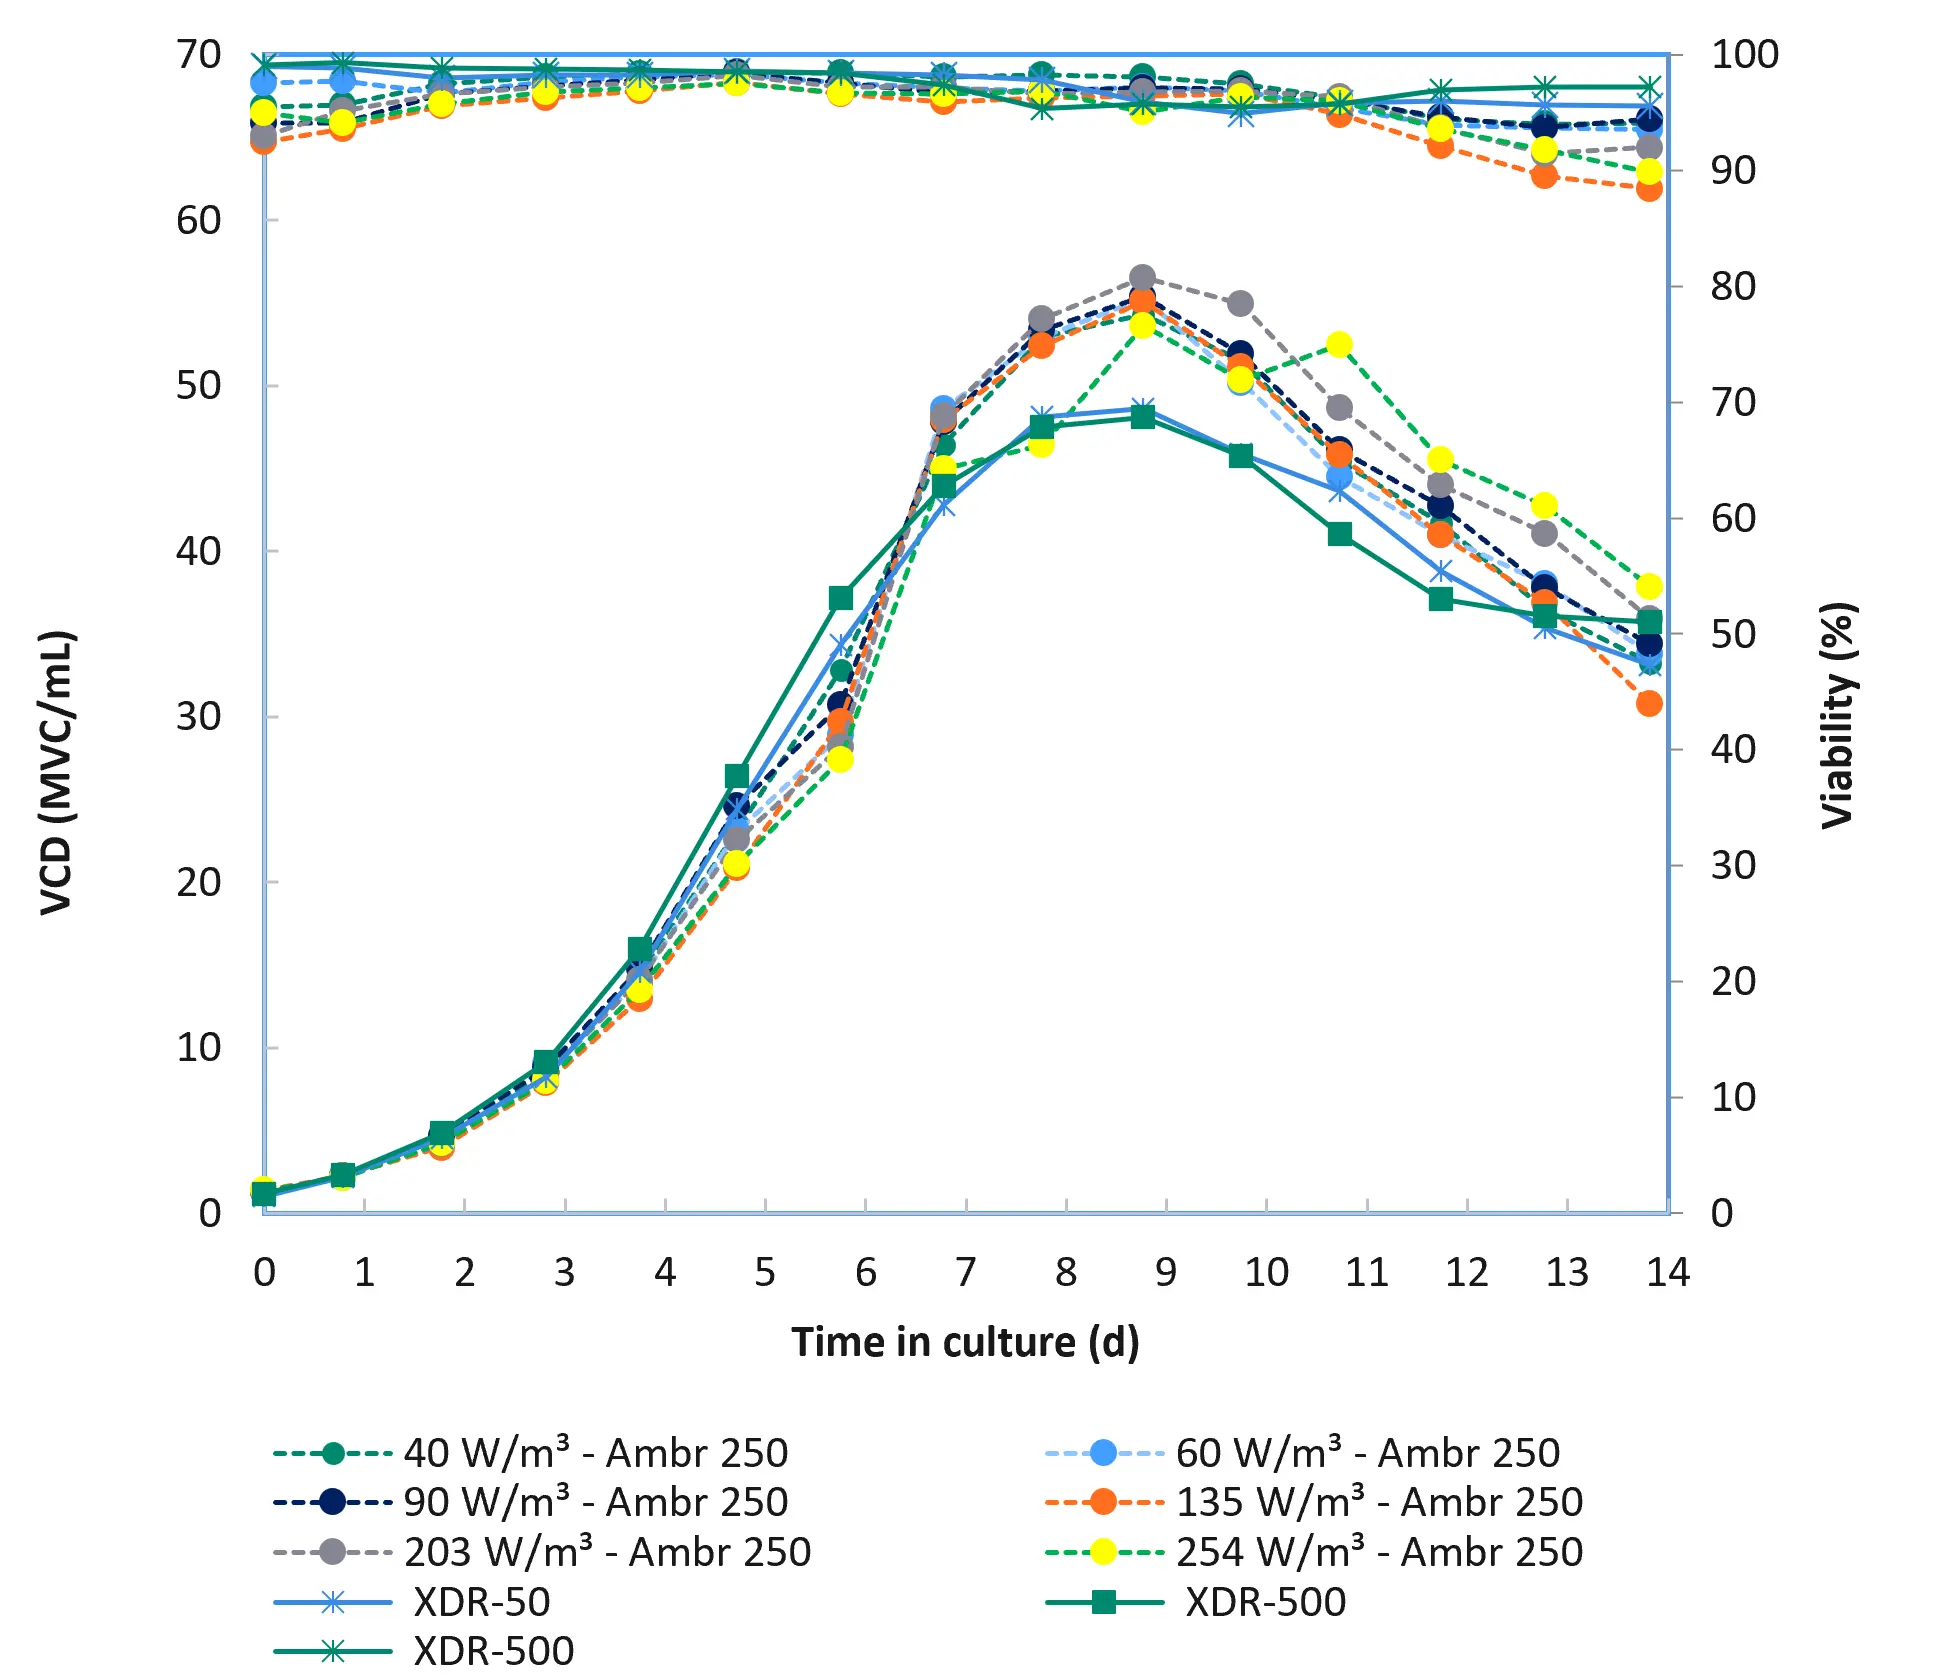
Fig 1. Viable cell density (VCD) and viability in Ambr 250, XDR-50, and XDR-500 cell cultures. Each agitation rate in Ambr 250 was run in duplicate.
Metabolite profiles and mAb titer
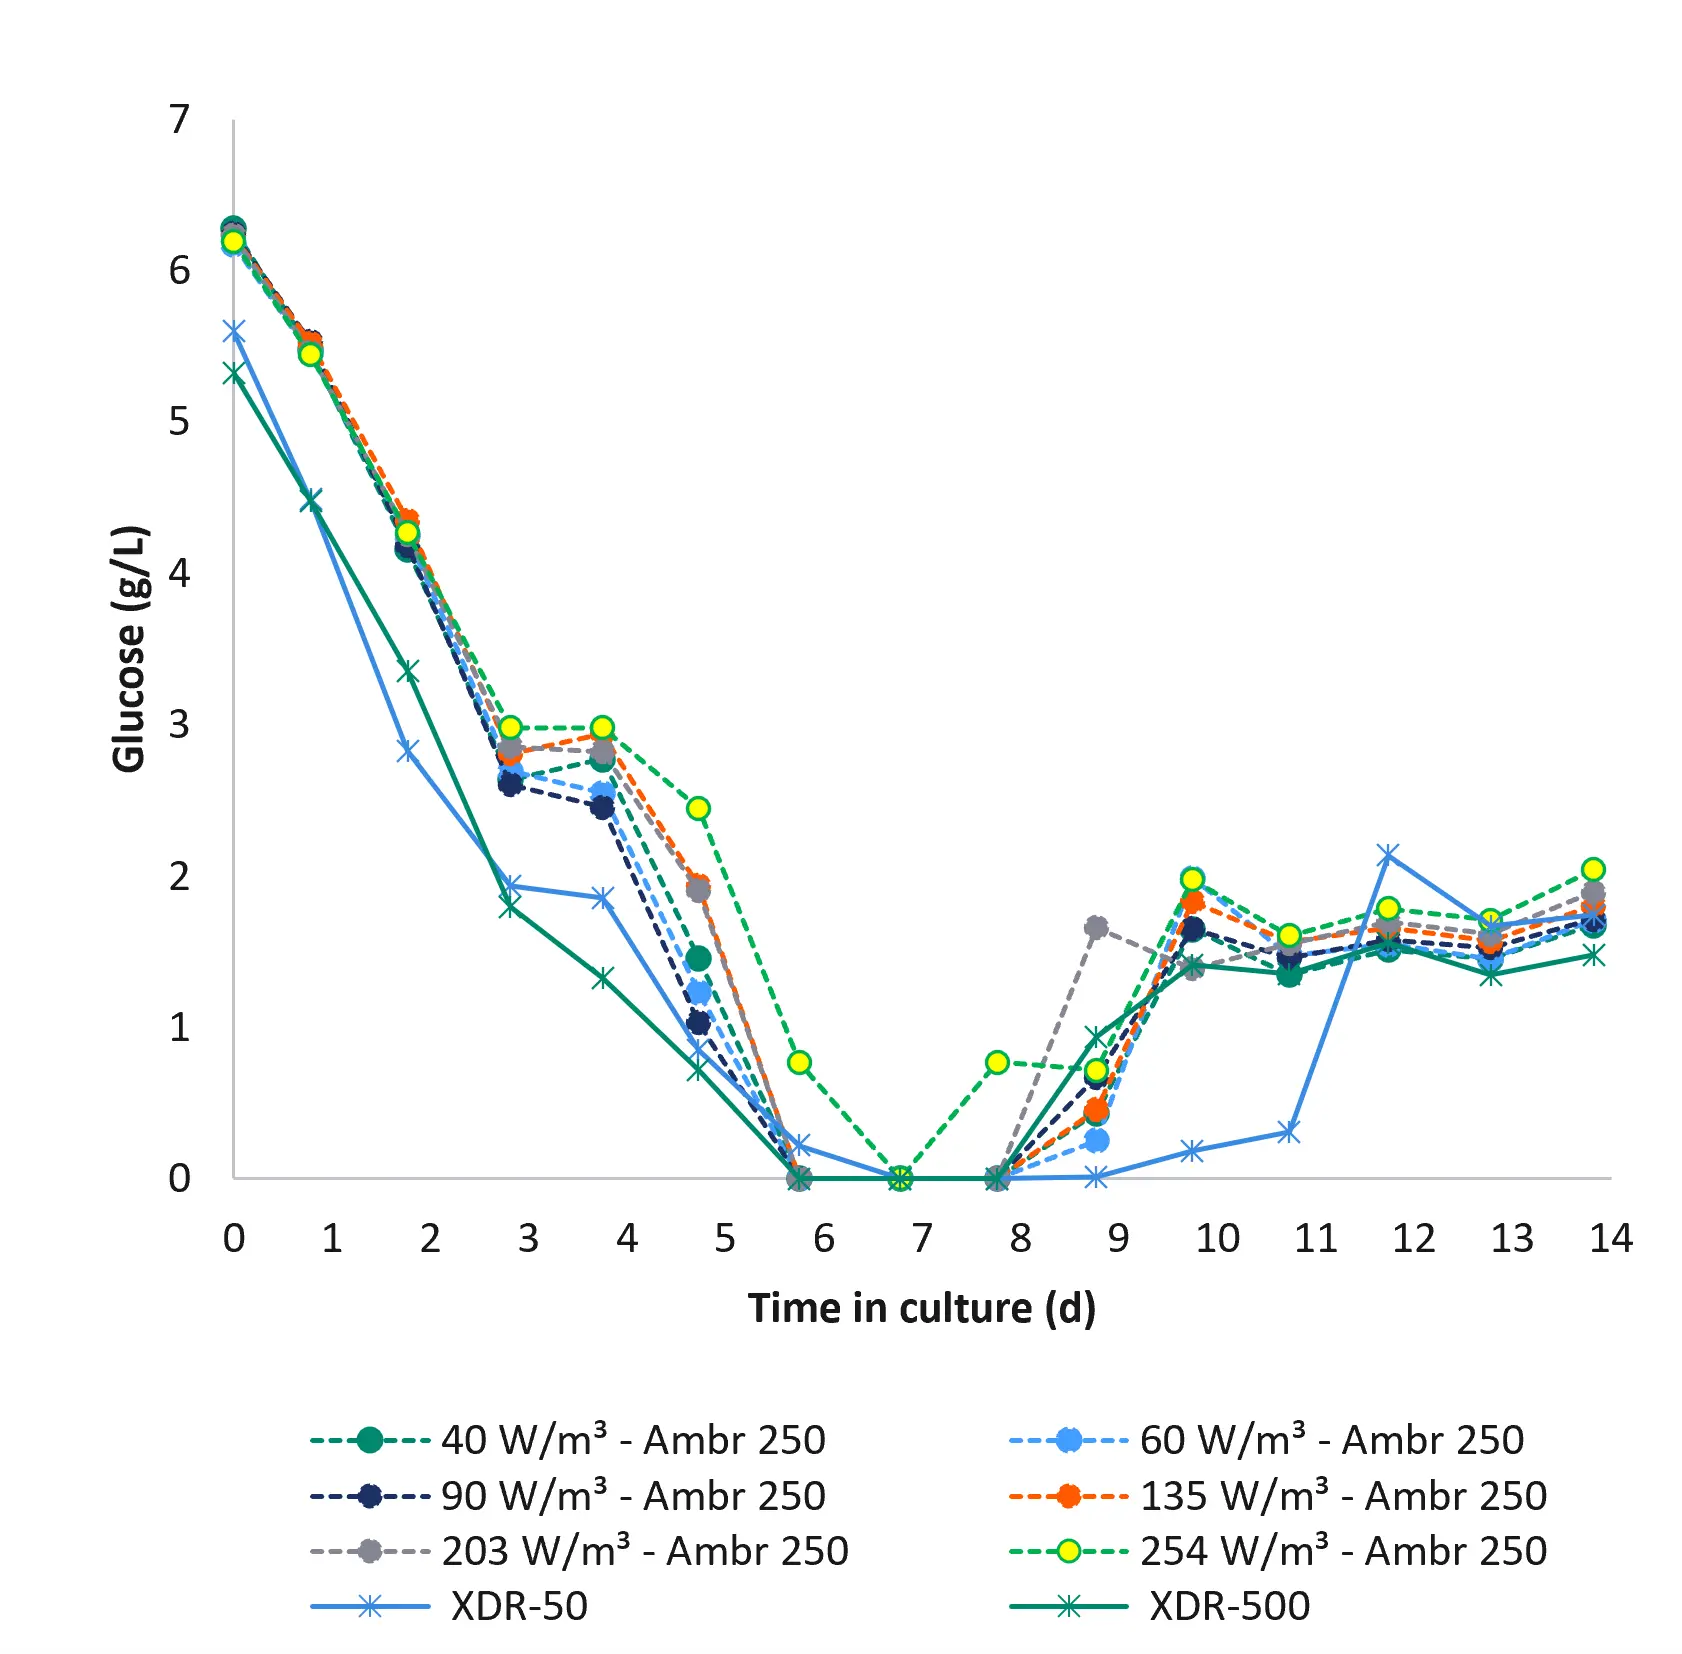
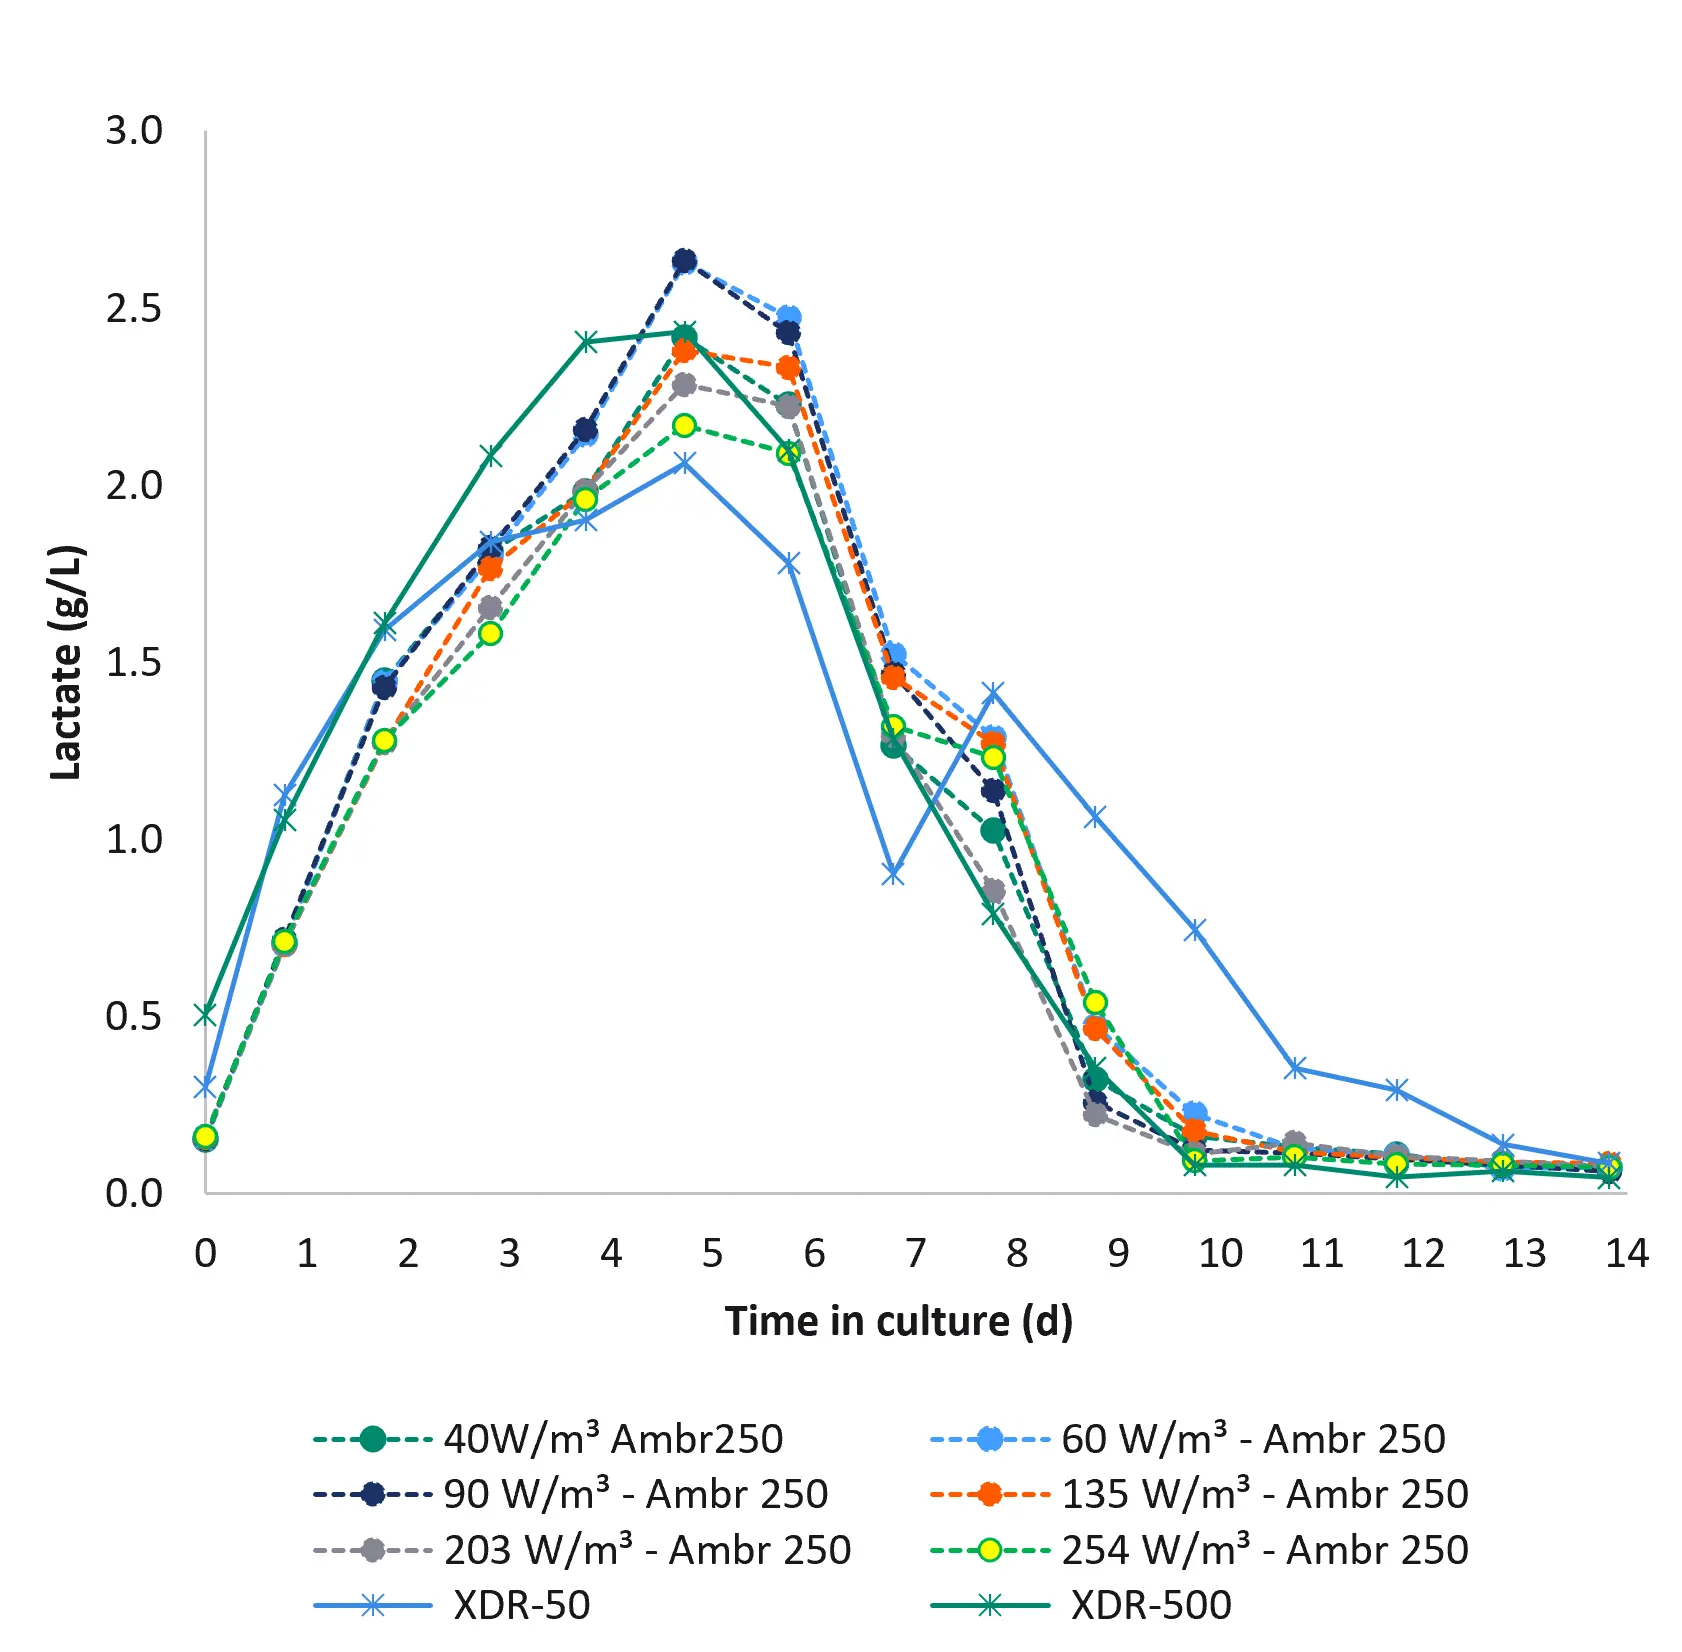
Glucose, lactate, and IgG titer profiles are presented in Figure 2. Consistent metabolite concentrations and monoclonal antibody titers were observed across all scales and agitation conditions.
A)
B)
C)
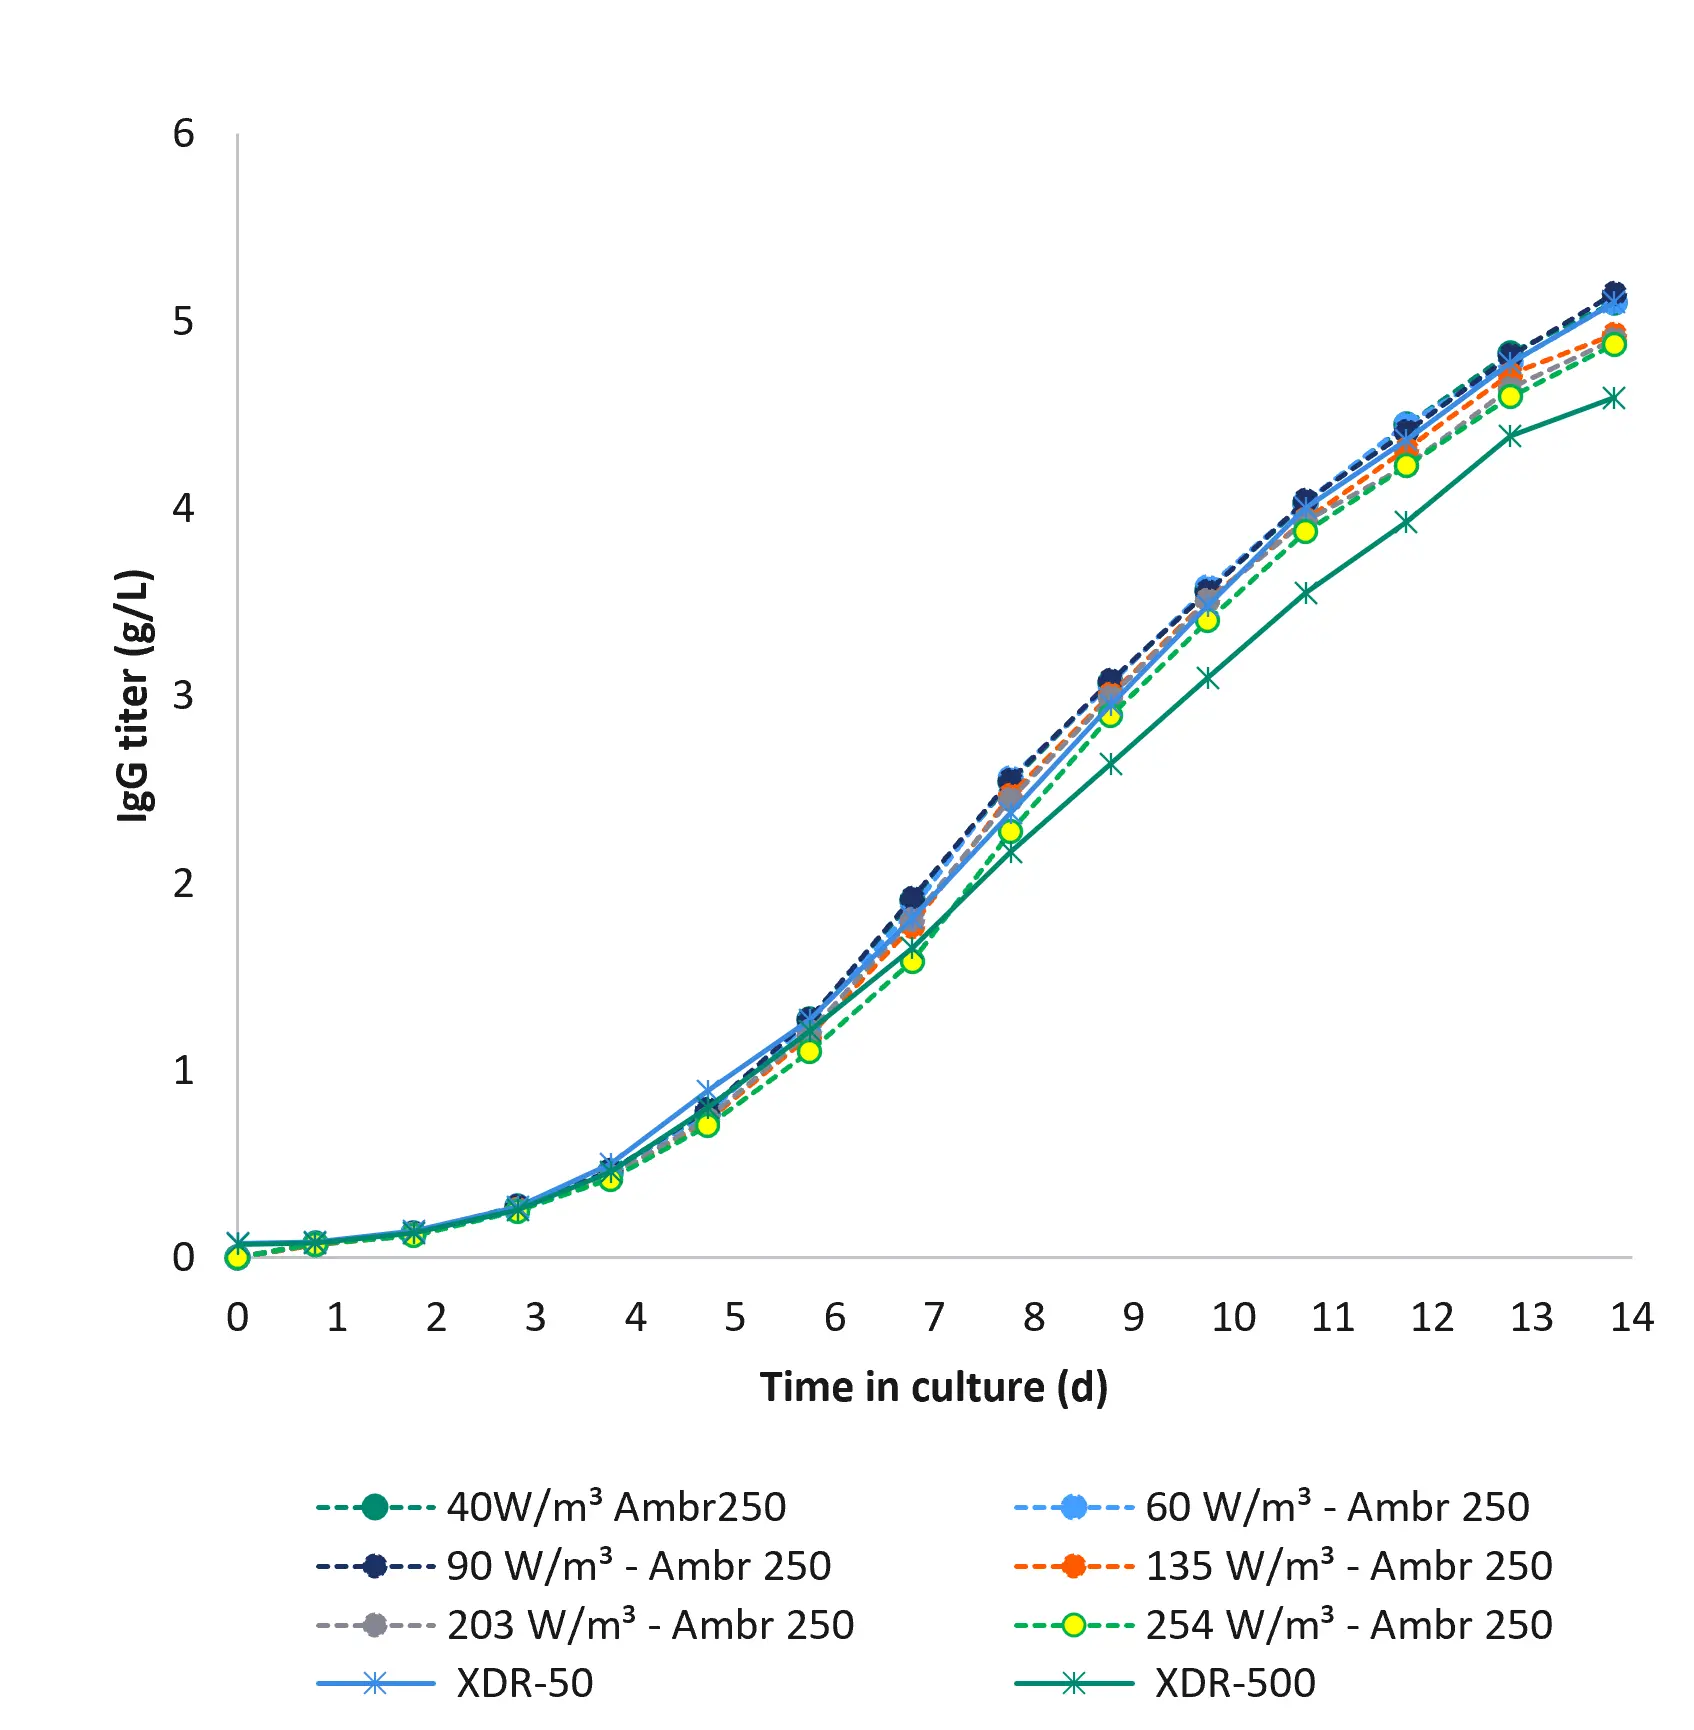
Fig 2. Metabolite and mAb titer profiles in Ambr 250, XDR-50 and XDR-500 cell cultures. A) Glucose levels, B) Lactate levels, C) IgG titer.
Product quality
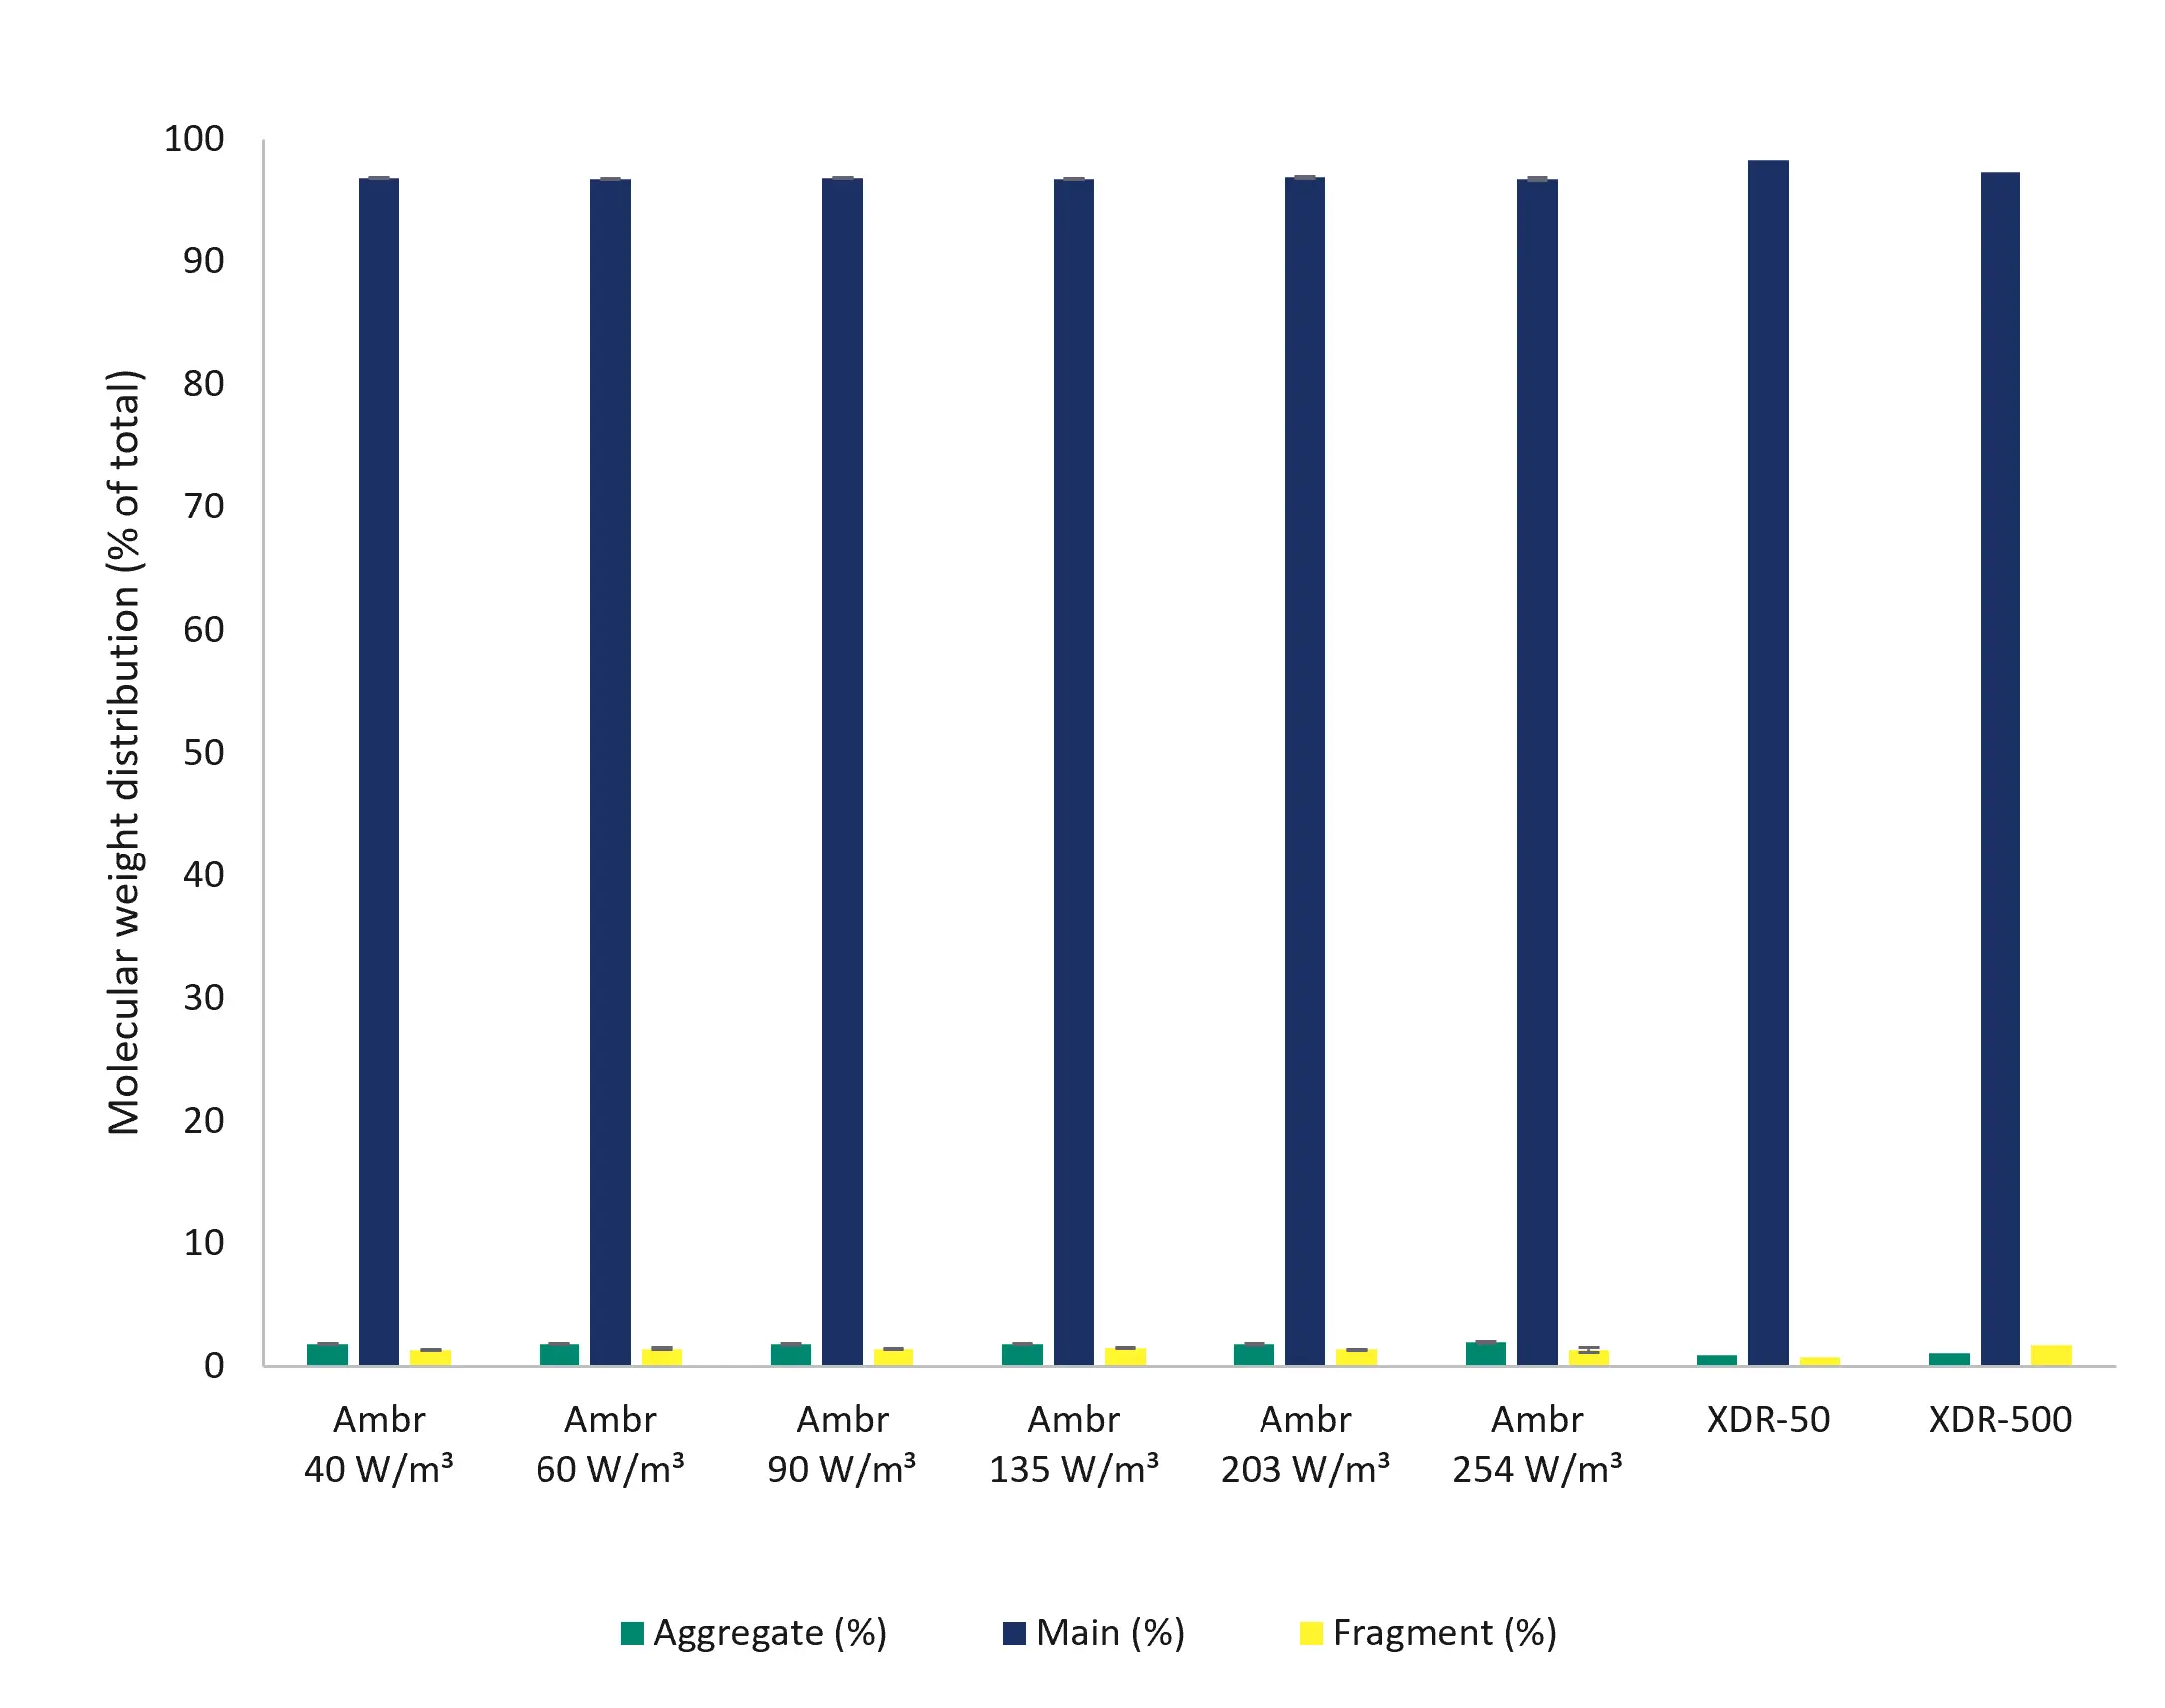
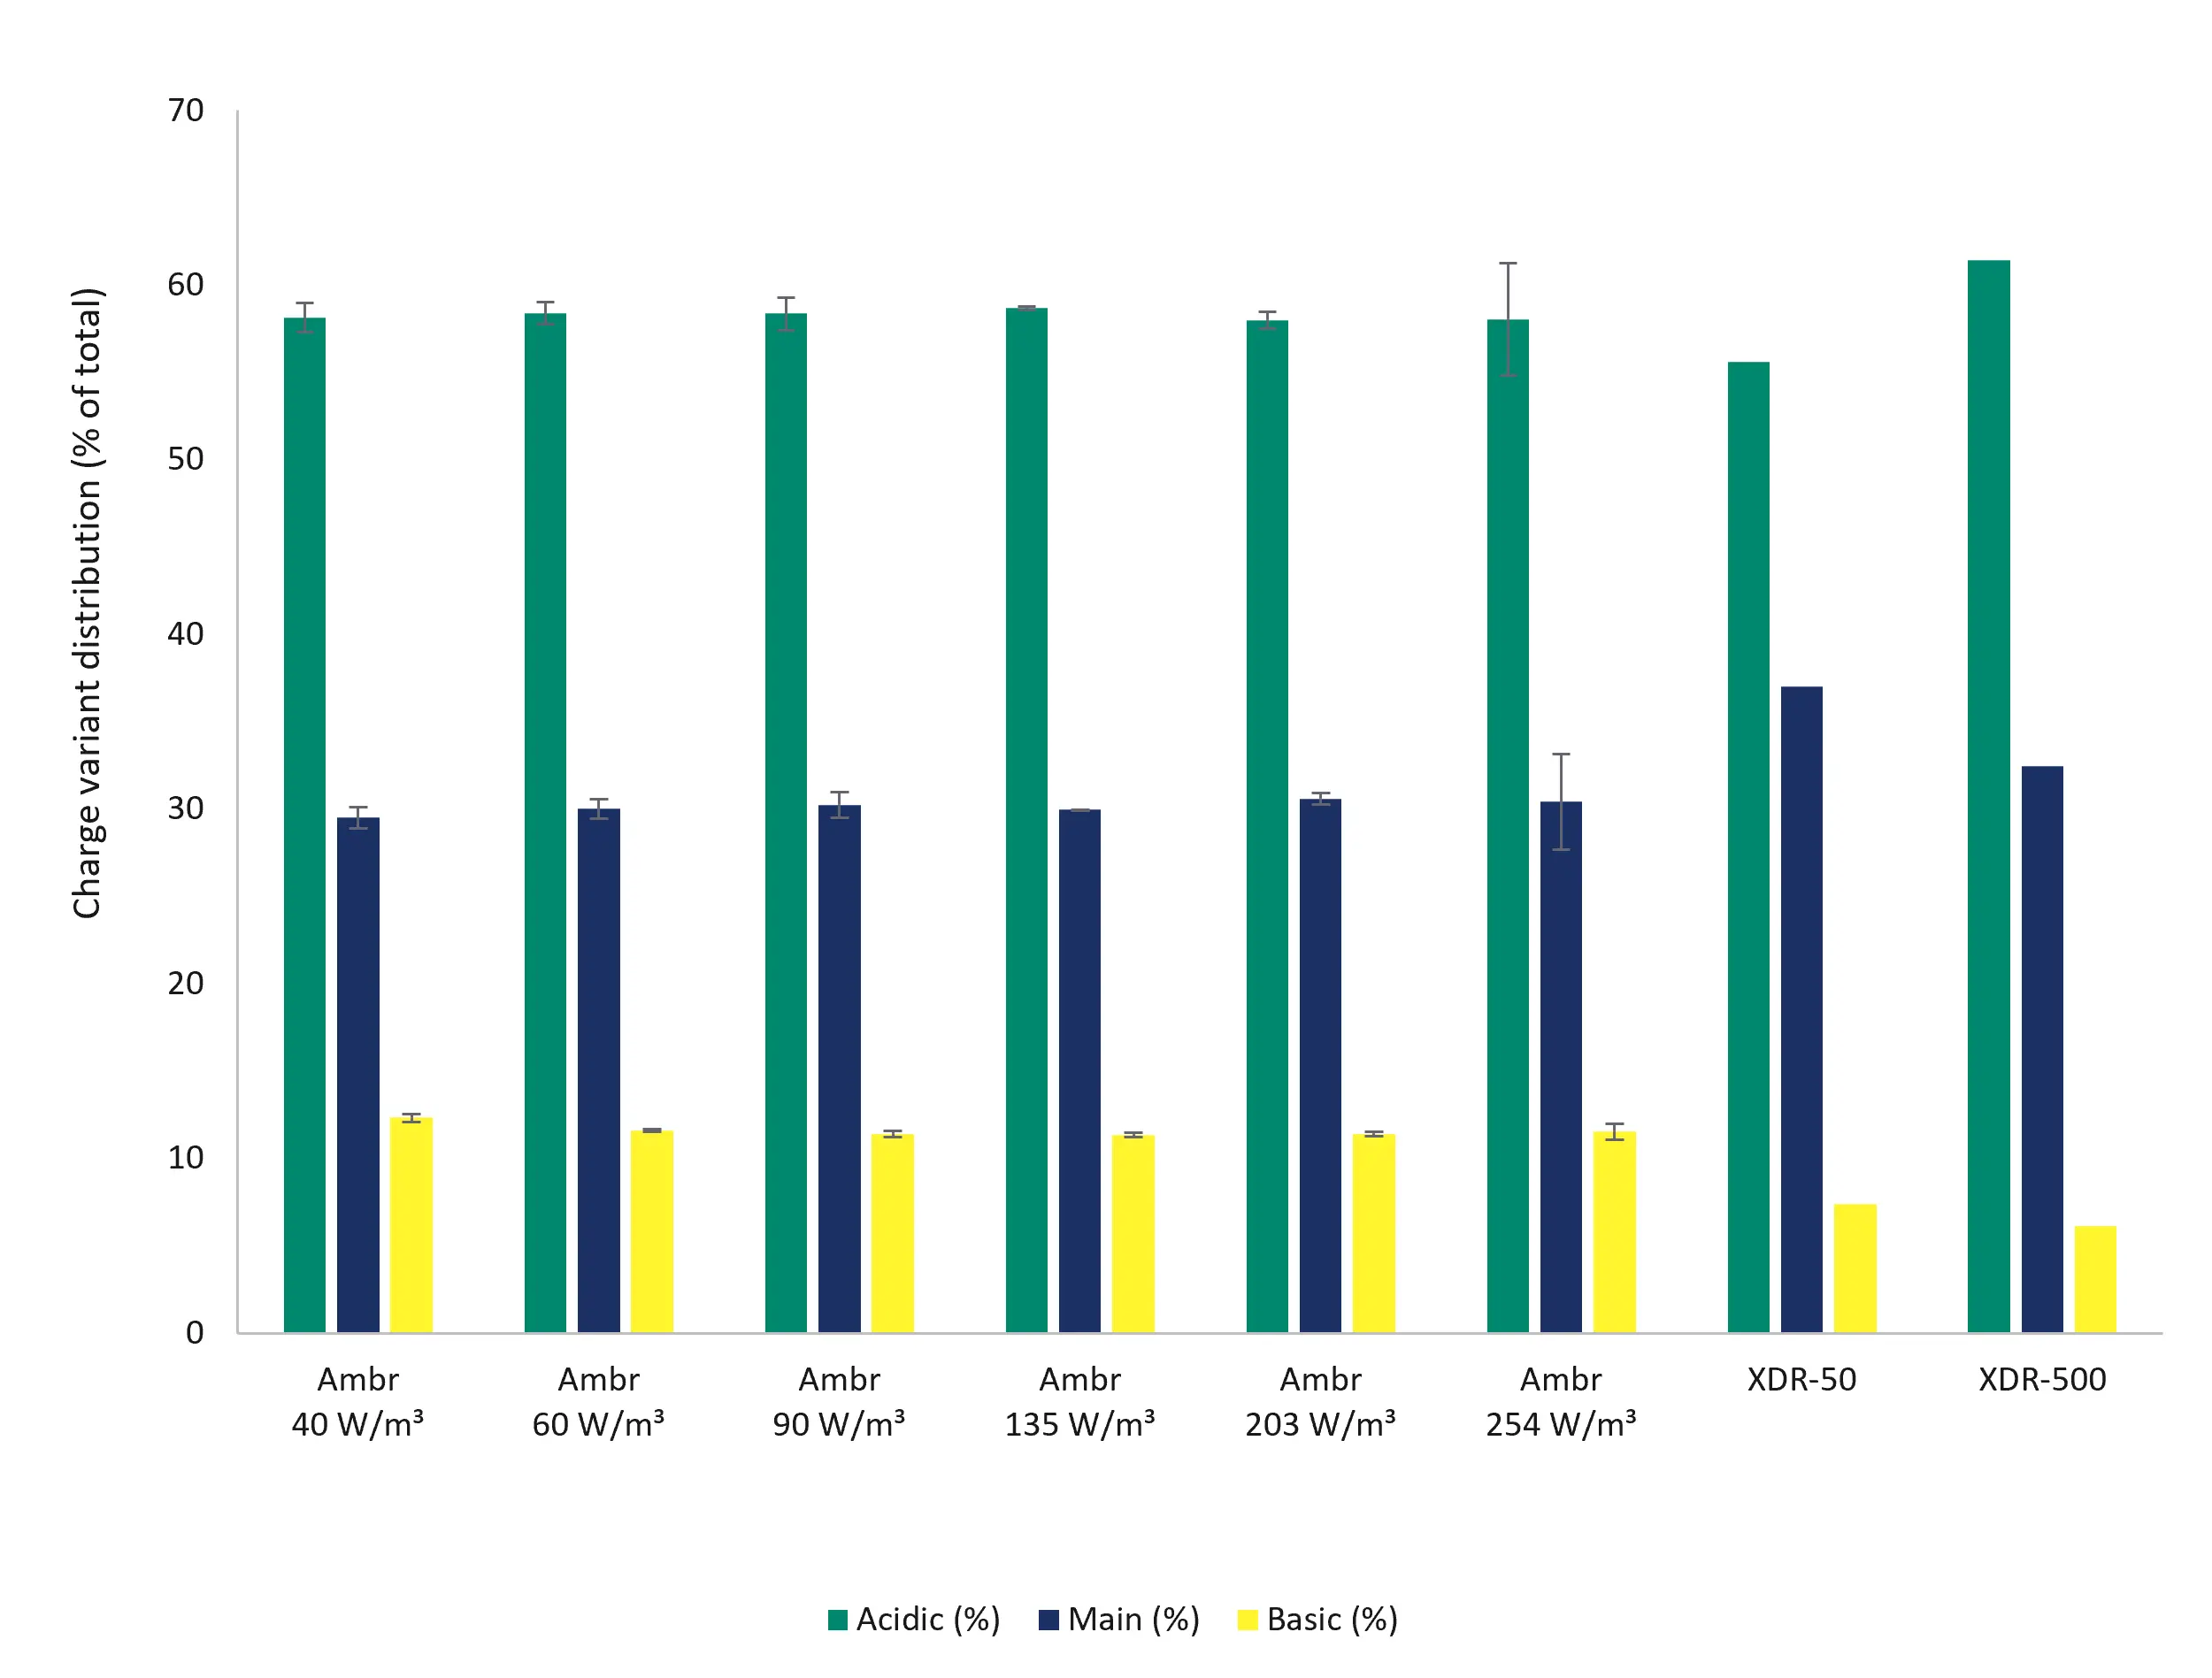
Product quality analysis was performed on harvest samples from culture Day 14. Comparable size, charge and glycan distribution was observed in all cell cultures from 250 mL to 500 L scale (Fig 3).
A)
B)
C)
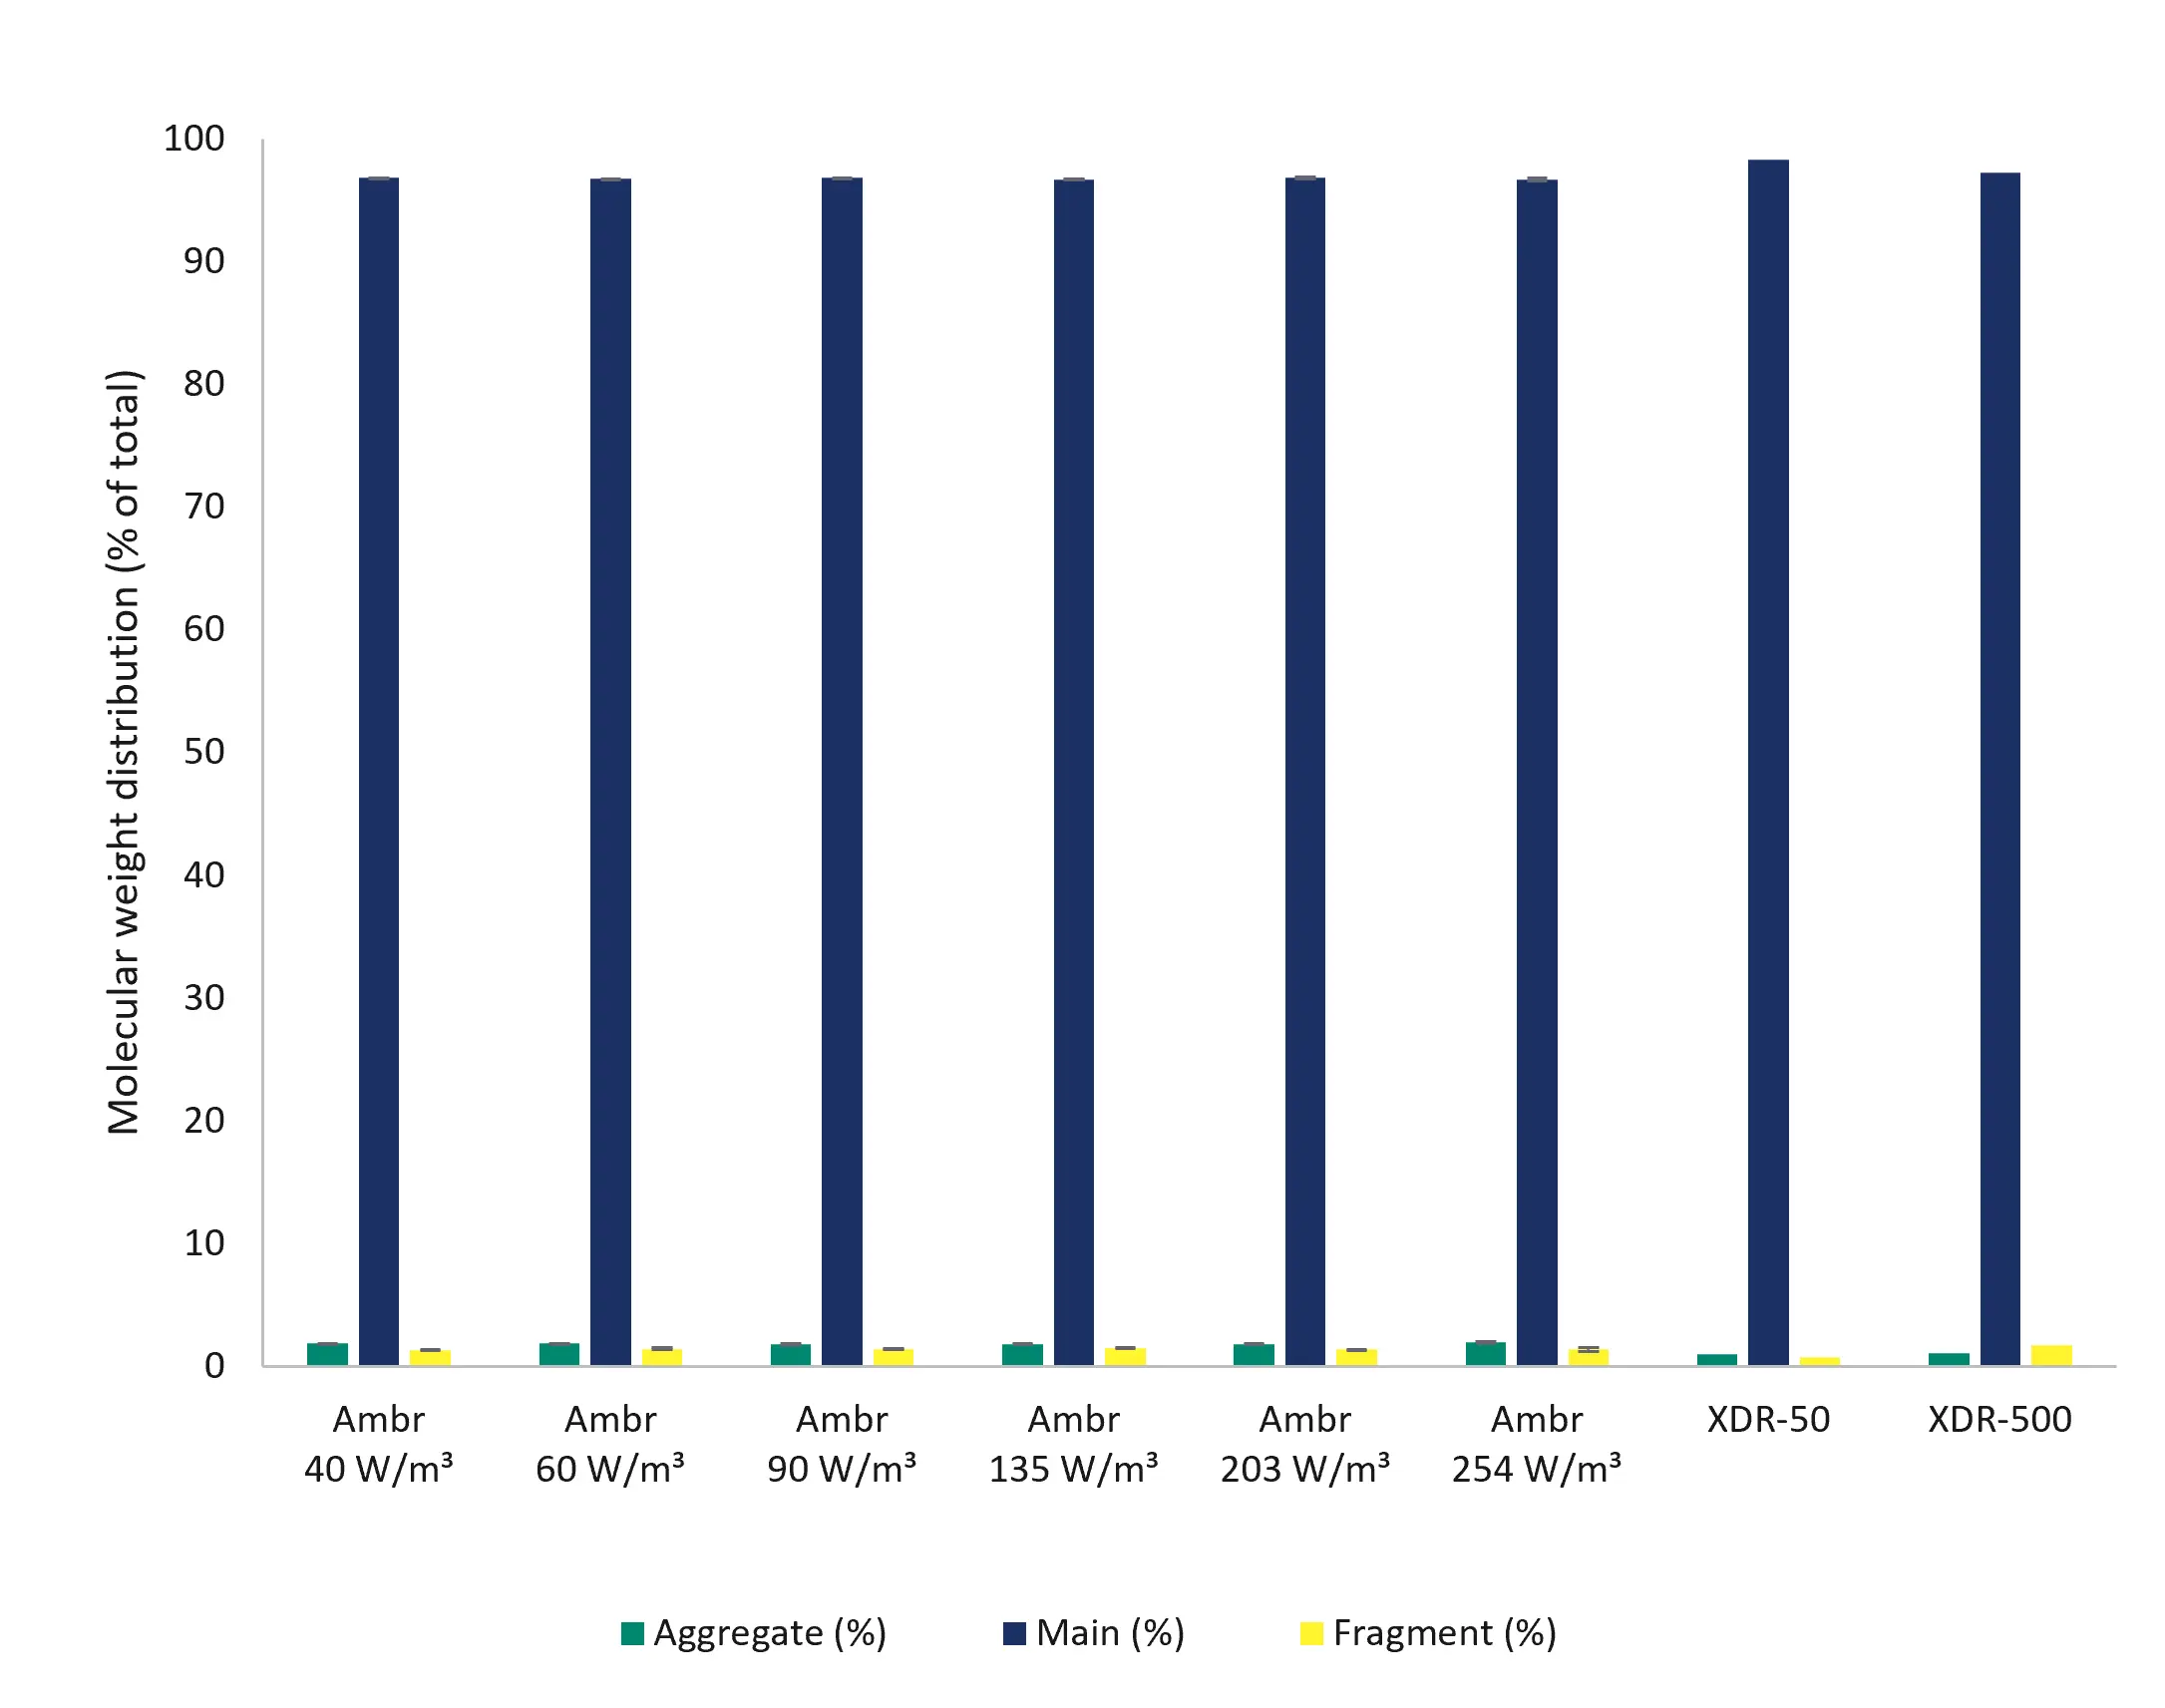
Fig 3. Product quality on culture Day 14 in Ambr 250, XDR-50 and XDR-500 cell cultures. A) Molecular weight distribution, B) Charge variant distribution, C) N-linked glycosylation distribution.
Scaling parameters
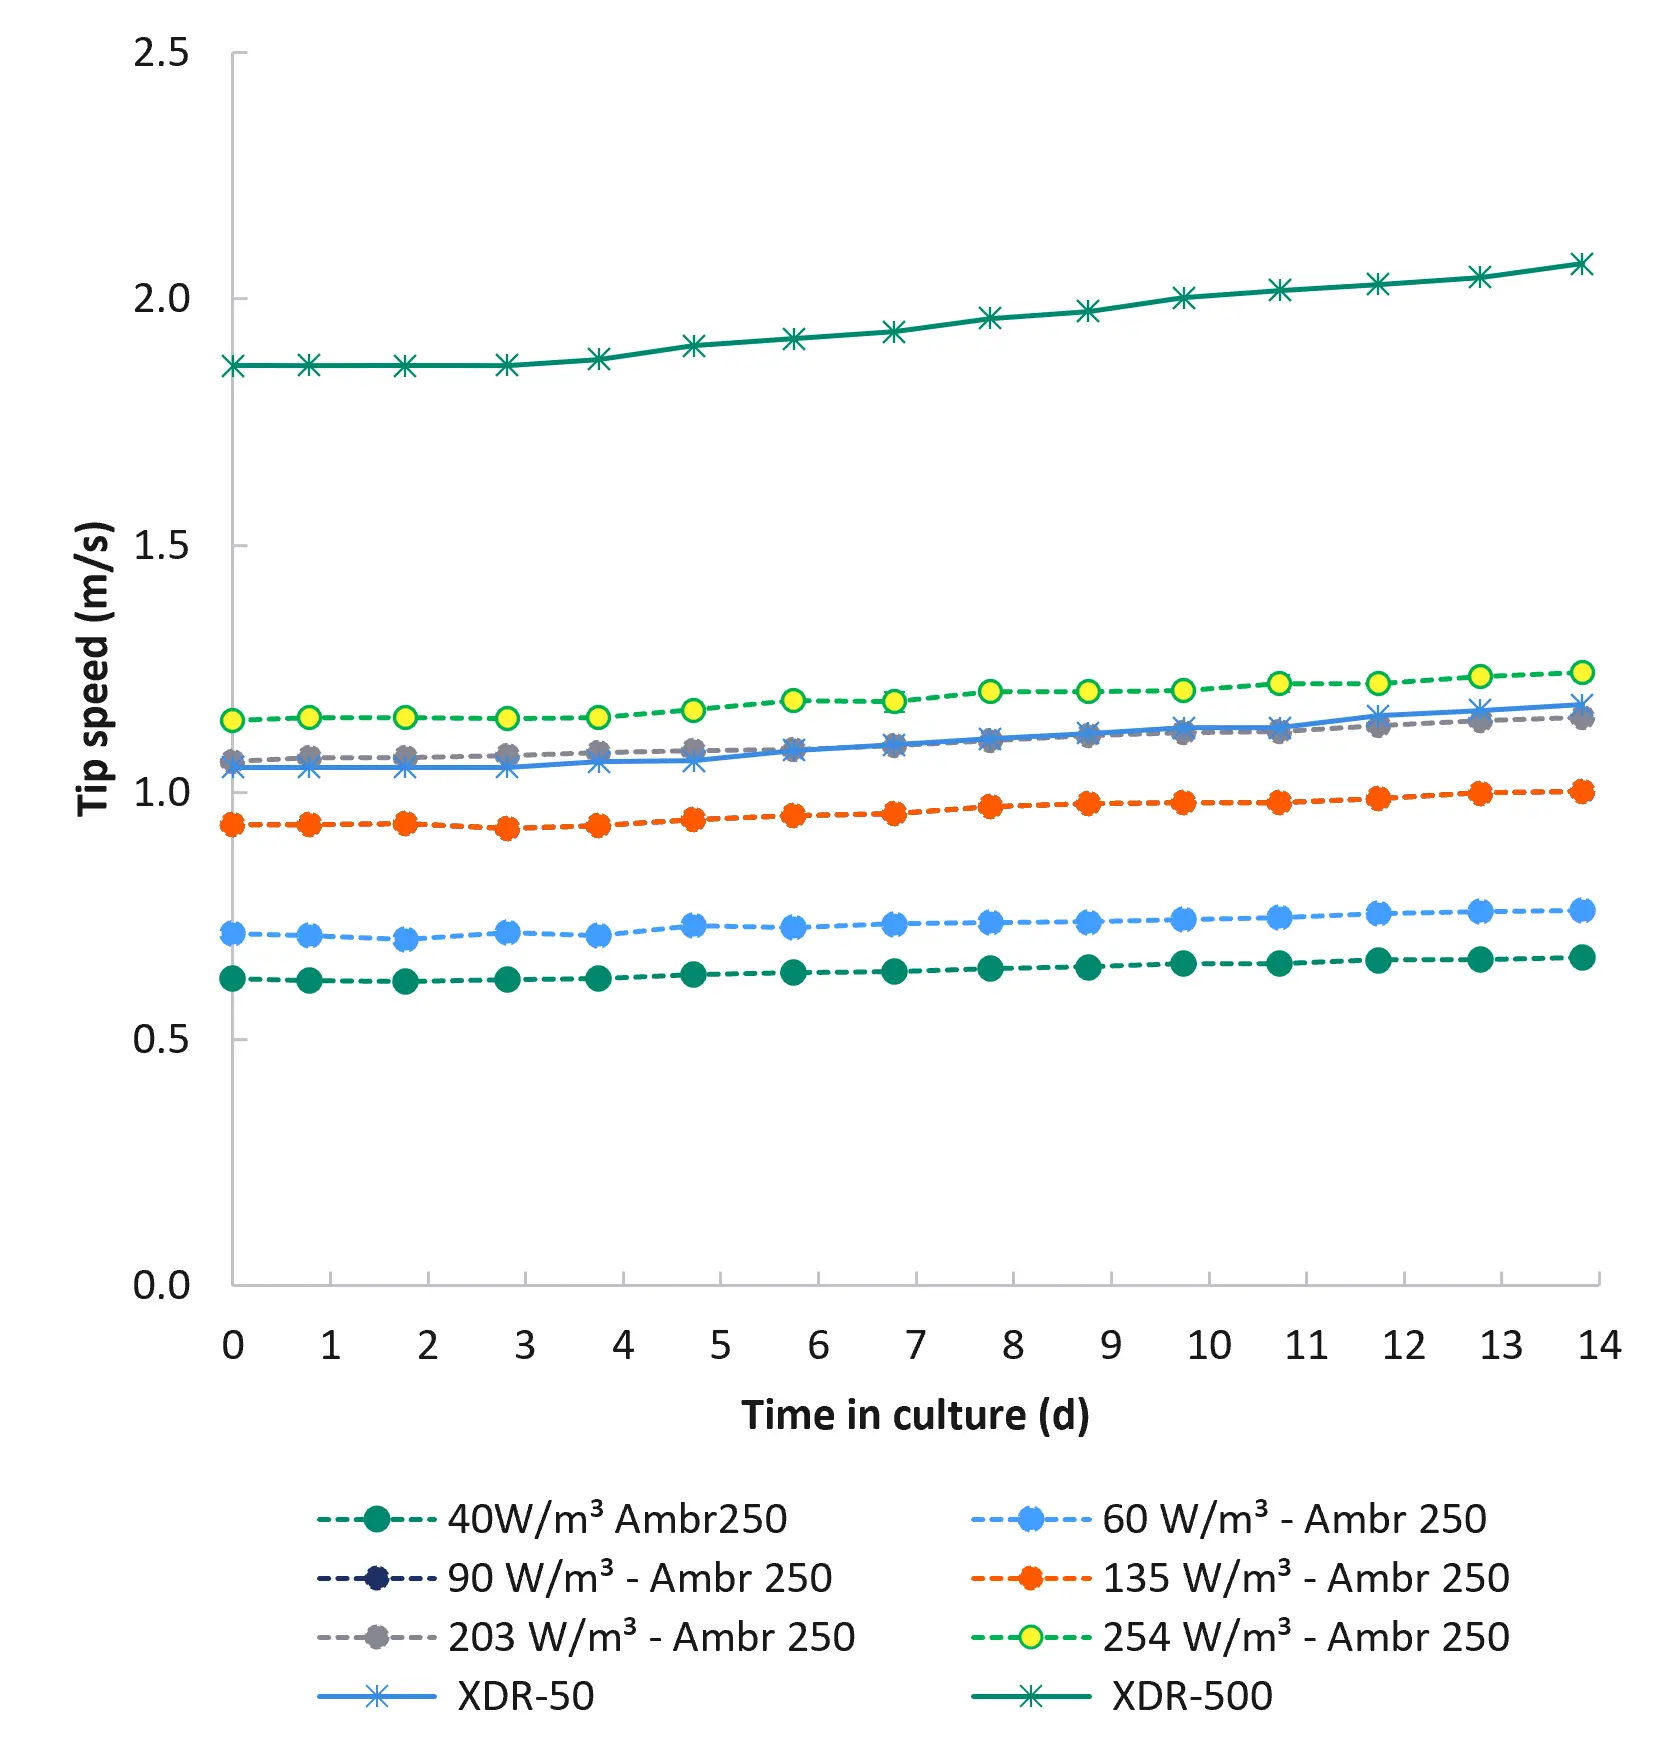
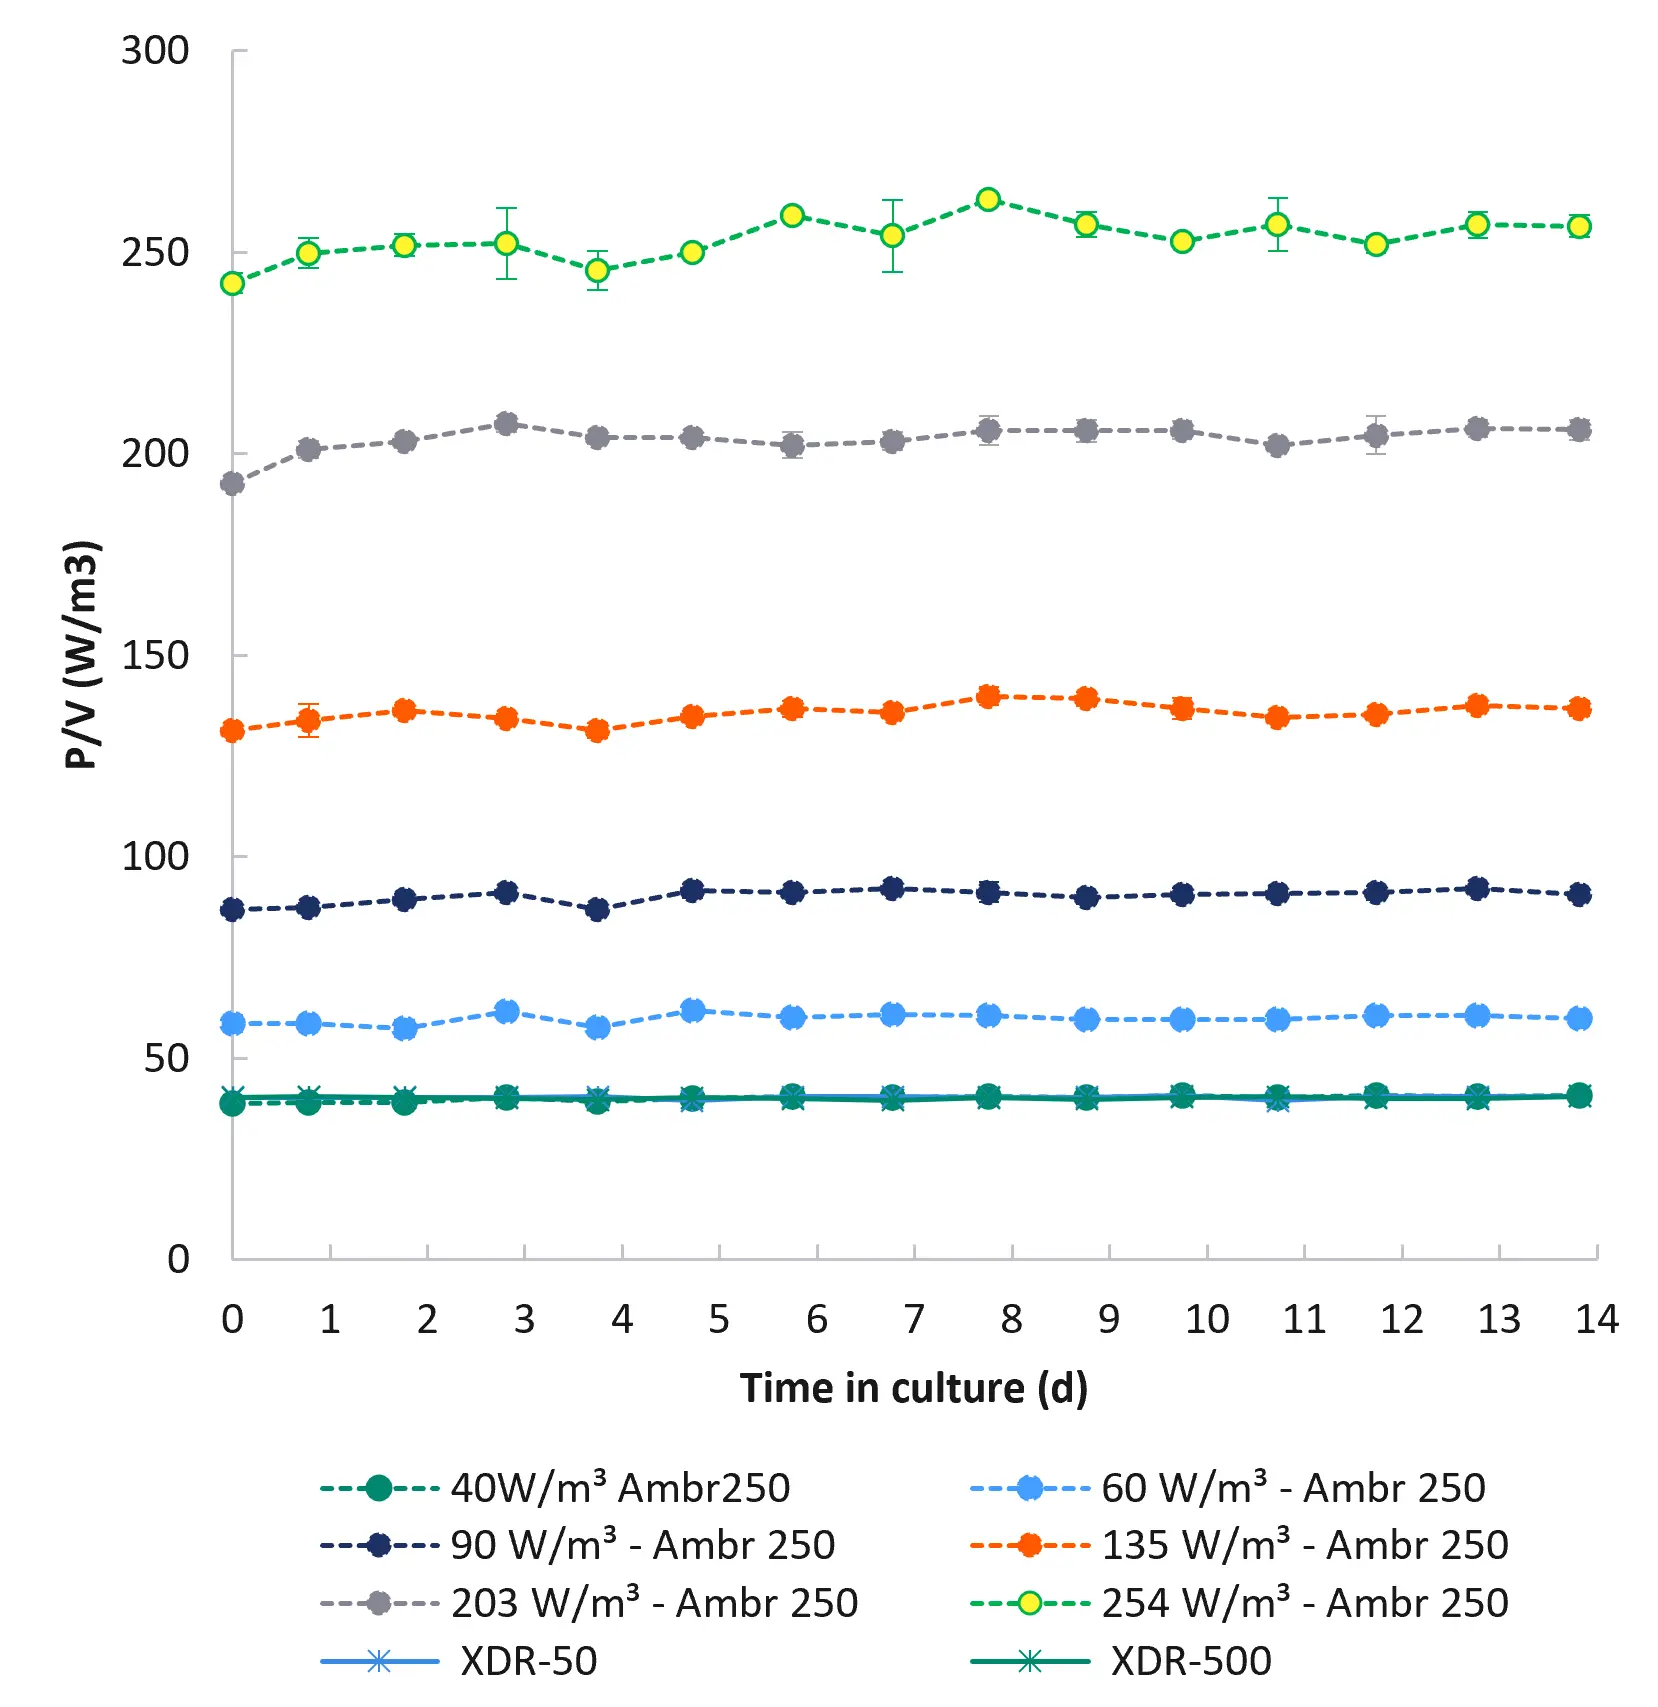
The oxygen flow rate required to maintain DO around setpoint in Ambr 250 vessels decreased with increasing stirring rate. This resulted in almost ten times higher total vvm at the lowest stirring rate compared to the highest (Fig 4C). Comparable vvm profiles across Ambr 250, XDR-50, and XDR-500 systems were achieved by maintaining constant tip speed between Ambr 250 and XDR-50, and by matching power input per unit volume (P/V) when scaling from XDR-50 to XDR-500 (Fig 4). In XDR bioreactors, a P/V of 40 W/m3 was applied, corresponding to a tip speed of approximately 1 m/s at 50 L scale, which aligns with the tip speed of Ambr 250 vessels operated at 203 W/m3. The Ambr 250 vessels in this study relied exclusively on macro sparging for gas delivery, whereas XDR bioreactors utilized a micro sparger for DO control and a macro sparger for pCO2 regulation. For Ambr 250 vessels equipped with a micro sparger configuration, an alternative scaling strategy may be required.
A)
B)
C)
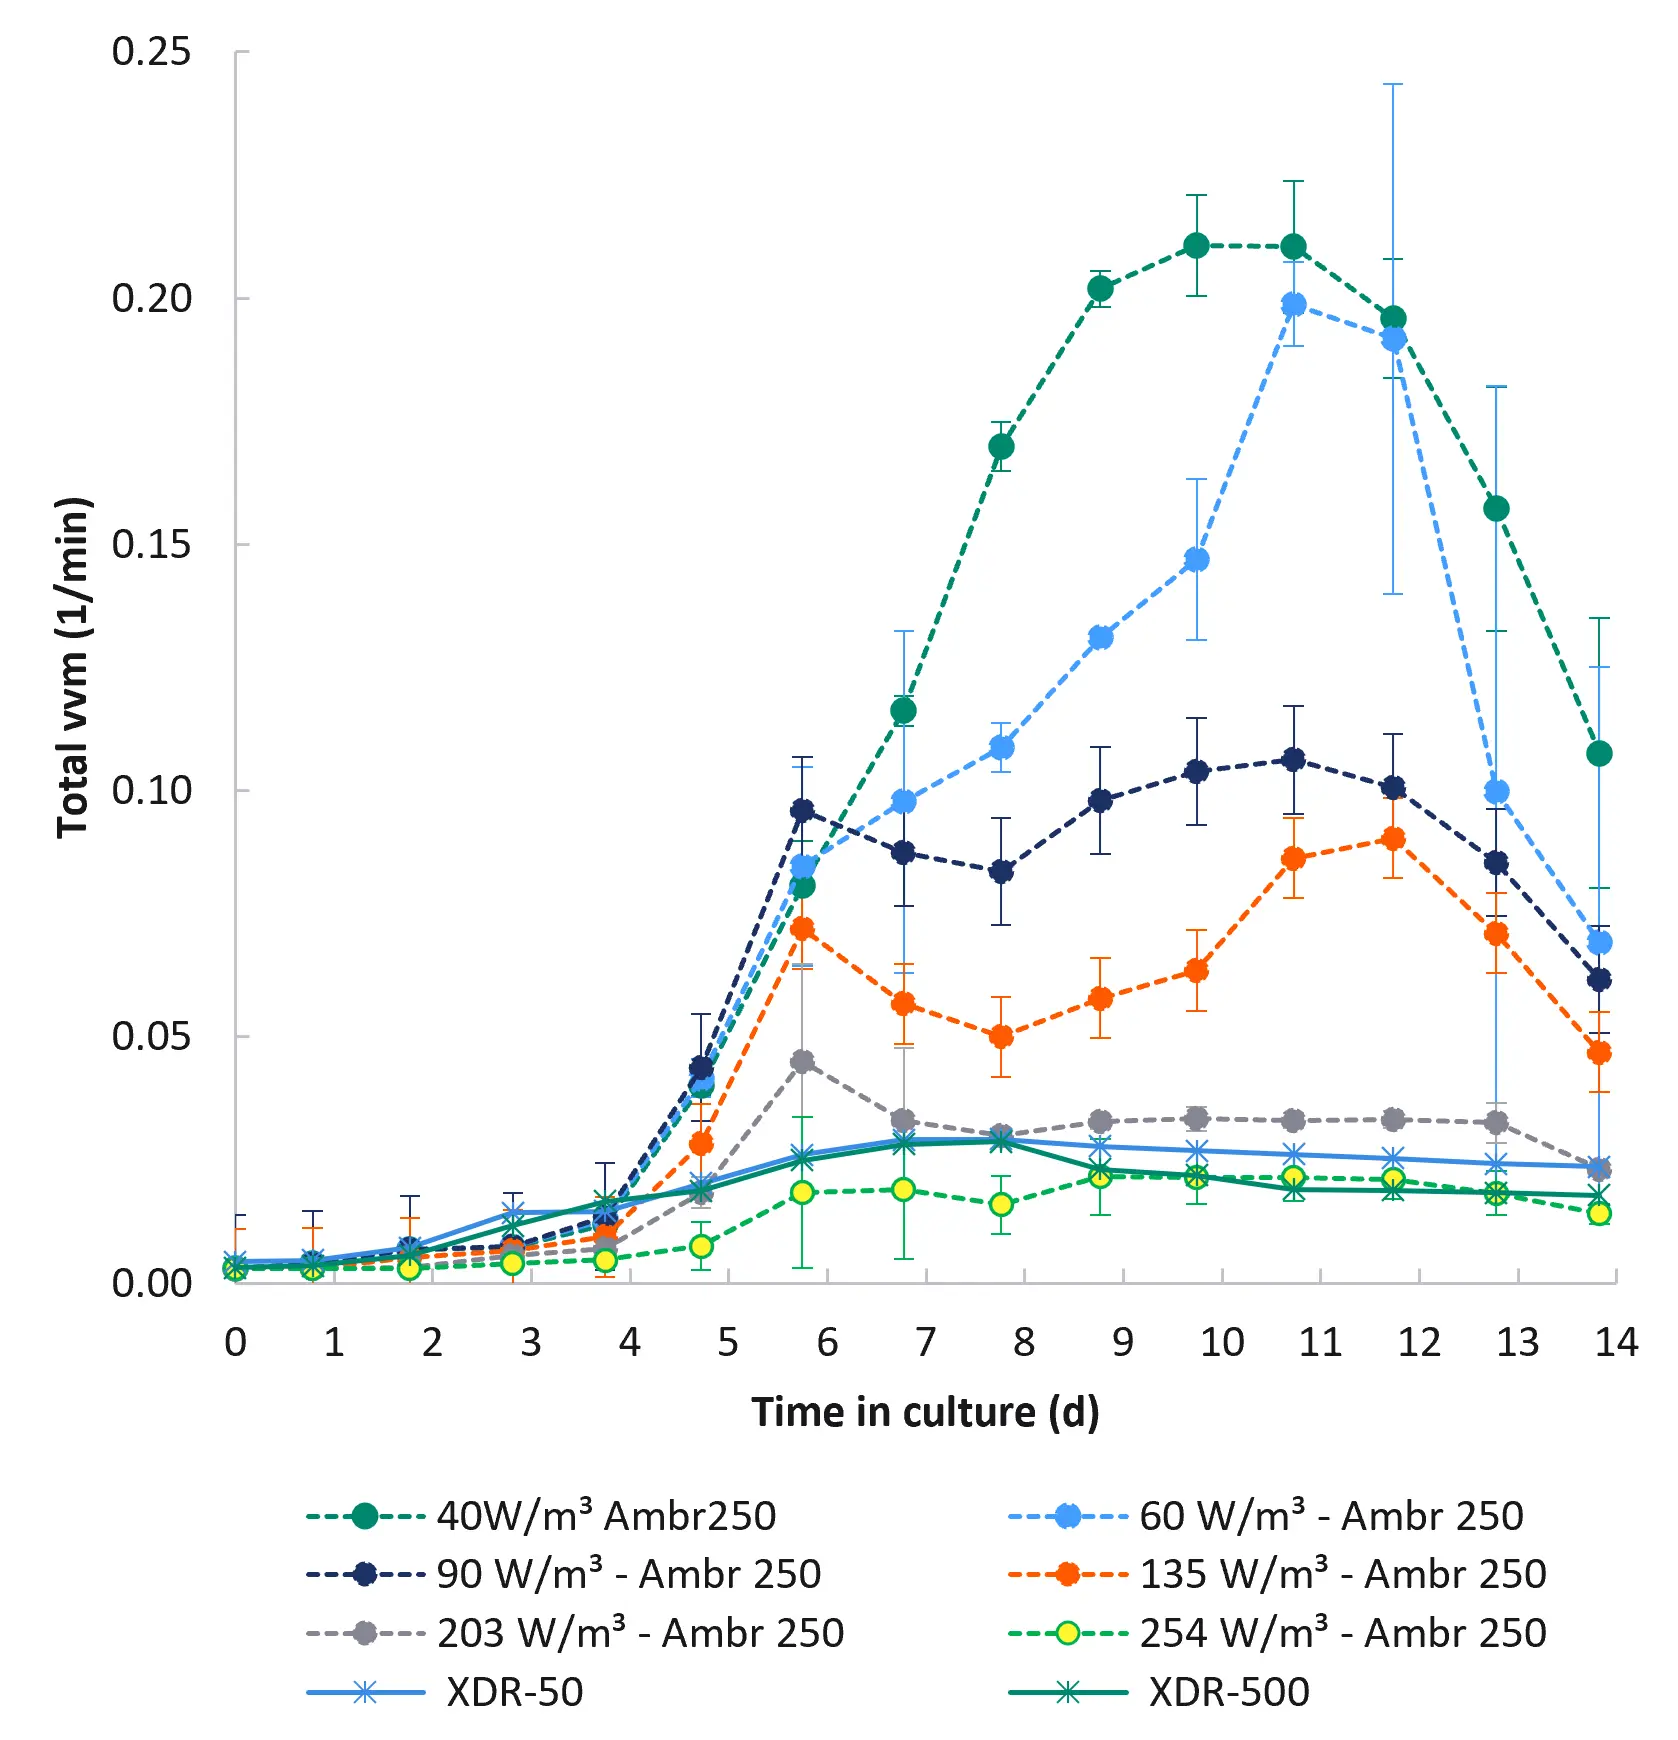
Fig 4. Agitation and gas flow scaling parameters for Ambr 250, XDR-50 and XDR-500 cell cultures. A) Tip speed, B) Power input per unit volume (P/V), C) Total air and oxygen vessel volume per minute (vvm), calculated as an average from the total volume added per day. Red arrows indicate the targets for scaling between Ambr 250 and XDR-50, that is, matching tip speed and vvm, and for scaling between XDRs (matching P/V and vvm). Ambr data are averages of duplicates. Error bars represent one standard deviation.
Discussion
In this study, we used a fed-batch bioreactor process for mAb8, originally established in XDR-50 and XDR-500 bioreactors with dual sparger configurations, to successfully scale down to Ambr 250 vessels equipped with a single macro sparger. Ambr 250 was operated across six agitation settings, spanning P/V values from 40 W/m3 to 254 W/m3. Cell culture scaling was successful with consistent cell growth, titer, and product quality achieved across all scales and agitation rates.
Agitation rate, however, significantly influenced gas flow requirements for maintaining DO at the 40% setpoint. Unlike Xcellerex™ XDR bioreactors, which can utilize separate spargers for DO control (20 µm sparger in this study) and CO2 stripping (macro sparger), Ambr 250 relies on a single sparger for both functions. Consequently, changes in agitation not only impact DO regulation but can also affect pCO2 profiles, as total air and oxygen flow (vvm) varies with stirring rate (4).
We demonstrated that comparable vvm profiles between 250 mL and 50 L scales can be achieved by maintaining constant tip speed and minimizing air usage for DO control at higher cell densities. While differences in total gas flow did not affect performance or product quality in this specific process, these factors can be critical for other processes—particularly those where continuous CO2 sparging is not extensively required for pH control. In such cases, variations in total vvm of air and oxygen is expected to have a bigger impact on pCO2 levels. Matching tip speed and total vvm therefore provides a more robust bioreactor scale up strategy when transitioning from Ambr 250 vessels with macro sparger configuration, to Xcellerex™ XDR-50 bioreactors with dual spargers, compared to maintaining P/V. Our findings here align with a previous study, which reported similar pCO2 profiles and product quality when total vvm was comparable between 250 mL and 500 L scales (4). For scale-up within the XDR bioreactor series, robust scalability can be achieved by matching P/V and total vvm, as demonstrated here for XDR-50 and XDR-500.
Conclusions
Our study highlights two practical strategies for manufacturing biologics, achieving consistent bioreactor performance and cell culture across scales.
- Maintain similar tip speeds for scale-up from 250 mL to 50 L scale
Aligning tip speeds between Ambr 250 (macro sparger) and XDR-50 (dual spargers) enables comparable total vvm of air and oxygen, supporting similar culture performance across scales. - Match P/V and total vvm for cell culture scale up with our Xcellerex™ XDR bioreactor series
Successful scalability within the XDR bioreactor platform can be achieved by harmonizing power input per unit volume and total gas flow, ensuring robust process transfer from pilot to production scale.
References
- Manahan, M. et al. Scale-down model qualification of ambr® 250 high-throughput mini-bioreactor system for two commercial-scale mAb processes. Biotechnol. Prog. 35, (2019).
- Tajsoleiman, T. Automating experimentation in miniaturized reactors. Tech. Univ. Denmark (2018).
- Tran, W.; Bowers, J.; Seamans, T. C.; Öhrvik, H.; Castan, A. Right the first time: bioreactor scale and design translation. BioPharm Int. 37, 26-30, 33 (2024).
- Zhang, X., Moroney, J., Hoshan, L., Jiang, R. & Xu, S. Systematic evaluation of high-throughput scale-down models for single-use bioreactors (SUB) using volumetric gas flow rate as the criterion. Biochem. Eng. J. 151, 107307 (2019).
CY59252