Introduction
A pre-clinical lab is often faced with the need to constantly evaluate possible ways of increasing capacity and throughput to cope with the increasing number of new molecular entities and shortening timelines. The ability to run a lab-scale process in an automated and unmonitored way could save significant time and effort.
This study was done to show both proof of principle for an automation solution for a lab-scale protein purification set-up and that it would significantly decrease hands-on time, while assuring that product quality was retained.
Cytiva worked together with a late-stage research team who needed to decrease the hands-on time needed to purify multiple mAb samples each week for internal development work. The chosen approach was to implement a basic automation strategy that was quick and easy to set up and designed with existing, off-the-shelf components.
This study demonstrates that through implementation of an automated solution at a pre-clinical lab the hands-on time spent by the scientist on the downstream purification process could be decreased from more than a day to a few hours. The automated purification process comprises continuous capture on Protein A, conditioning of pH and conductivity, and a final ion exchange polishing step.
The continuous capture of a mAb feed was performed on an ÄKTA pcc chromatography system and each elution peak was automatically transferred to an ÄKTA pure system, where pH and conductivity were adjusted. The adjusted material was transferred into an ion exchange polishing column and the final products were collected as individual fractions on a second ÄKTA pure system.
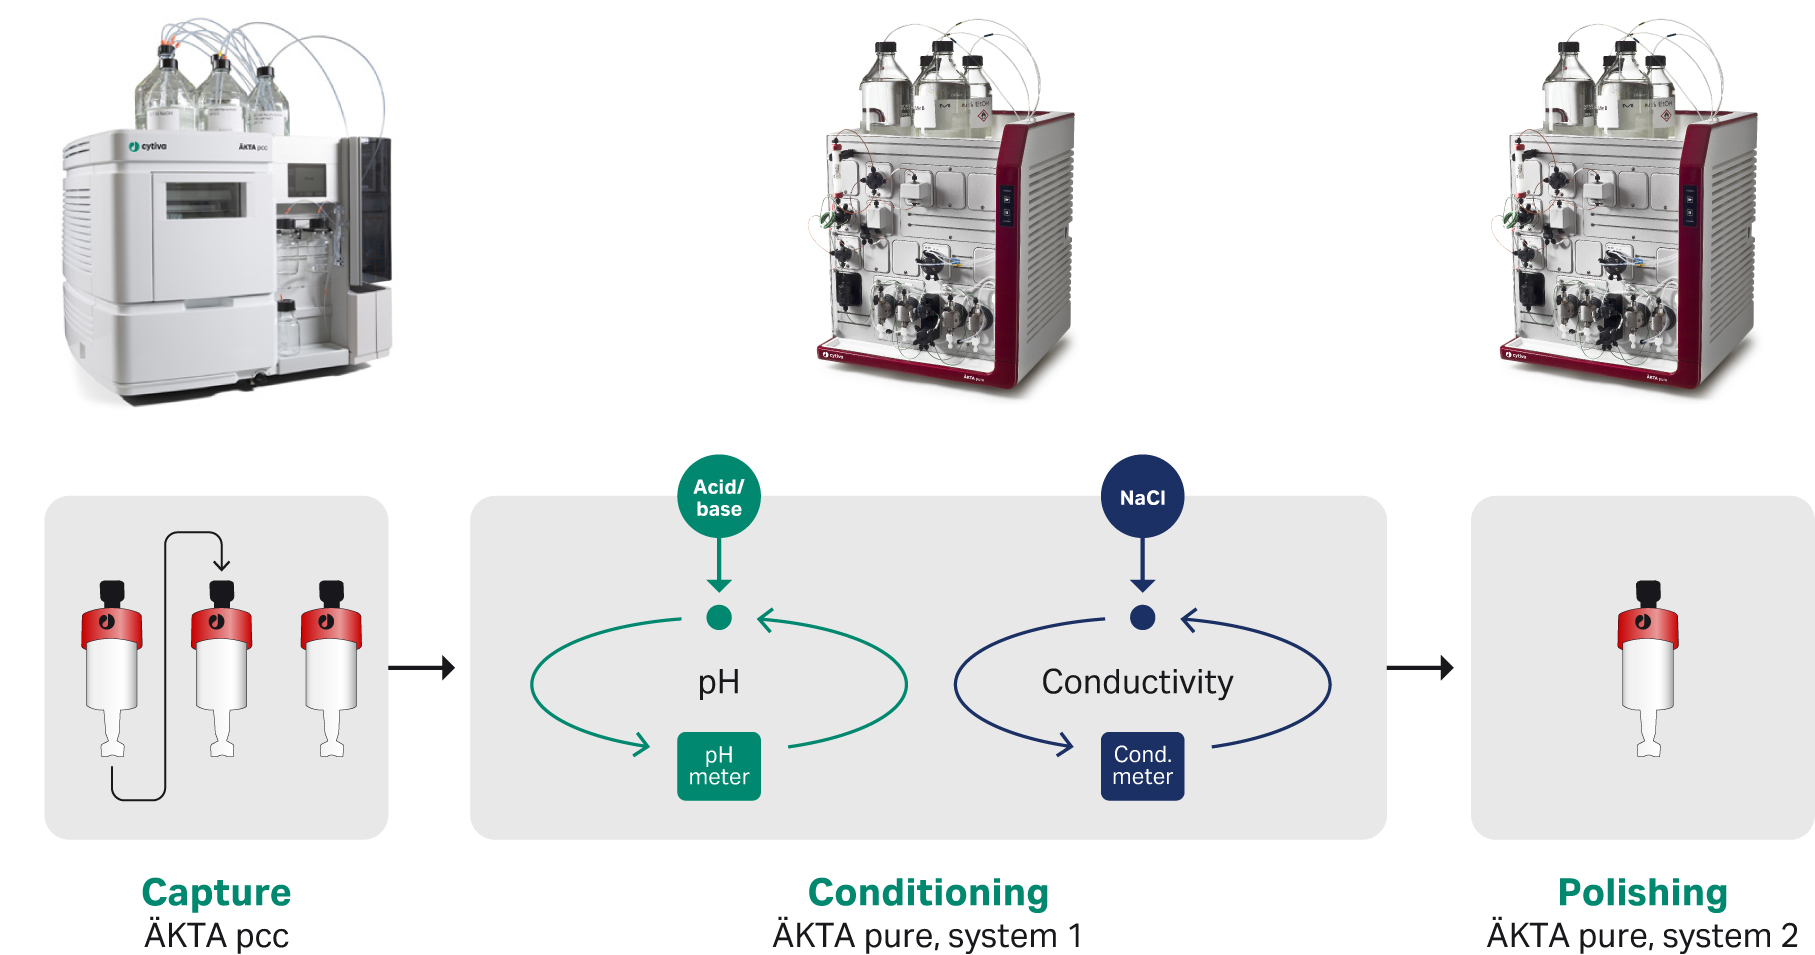
Fig 1. Schematic illustration of the product flow through the system. mAb material was captured in a continuous way and each elution peak from the MabSelect SuRe columns were adjusted to target pH and conductivity suitable for the polishing step.
Material and methods
The process was controlled by UNICORN control software and the signal handling between the chromatographic systems was managed by I/O boxes, briefly described in Figure 2. The whole process was monitored by the individual instruments and data could be examined and evaluated when needed throughout the process.
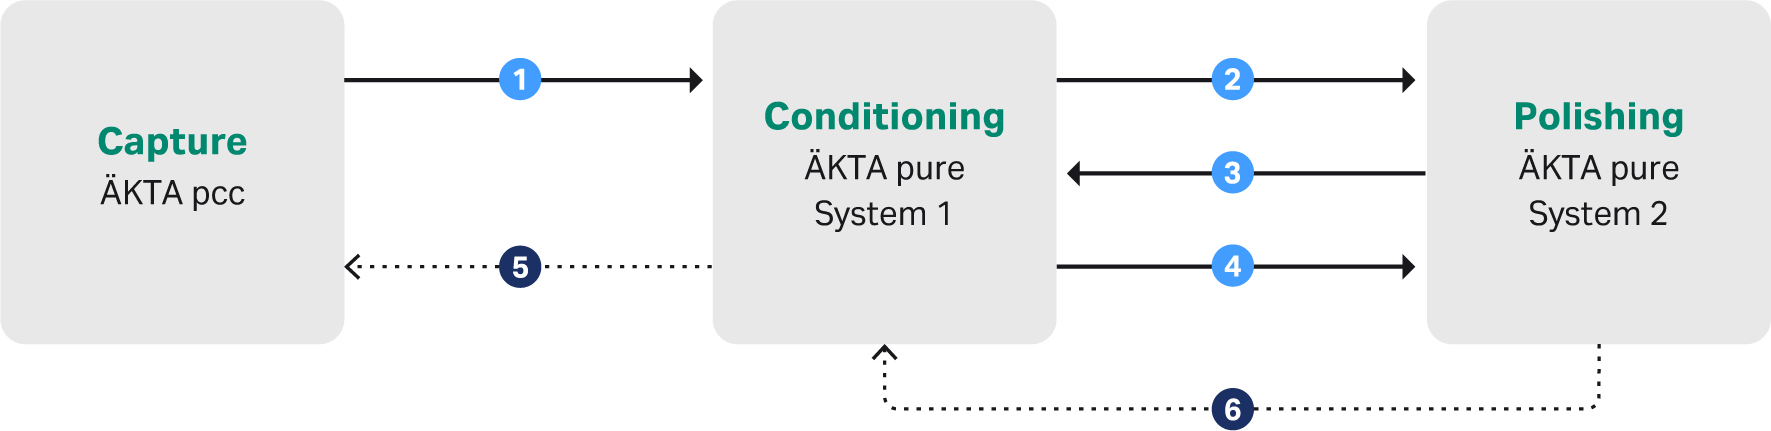
Fig 2. Brief description of the signaling used to achieve the automatic downstream process.
1. Once the capture step was finished on the ÄKTA pcc system it sent a ready signal to the first ÄKTA pure system. This activated the ÄKTA pure to be ready to receive the eluted peak and perform the conditioning step.
2. Once conditioning was started the first ÄKTA pure system sent a signal to the second ÄKTA pure to open a flow path that would enable the polishing system (second ÄKTA pure) to directly load the sample from the conditioning step.
3. Polishing system (second ÄKTA pure) confirms back to conditioning system (first ÄKTA pure) that the flow path is ready for direct inject.
4. Ready signal from conditioning system to polishing system that all sample have been injected onto column.
5 and 6. Security signals from Conditioning and Polishing to stop/pause the capture system in case of disruptions in the later steps.
Starting material
Several different cell cultures containing mAb (titer approximately 0.5 to 1.5 mg/mL) were used as the start material.
Capture
Capture was performed on an ÄKTA pcc, with three HiTrap (5 mL) MabSelect SuRe columns. The individual column peaks were transferred to the conditioning step by signaling via the I/O boxes and by using watch functions in the UNICORN methods. Signaling to the conditioning unit occurred when an elution peak was ready to be delivered. Functionality to perform chasing of the sample through the tubing running from the ÄKTA pcc to the conditioning ÄKTA pure unit was added to the standard UNICORN method.
Conditioning
Adjustment of pH and conductivity was performed in a modified ÄKTA pure system (Figure 3).
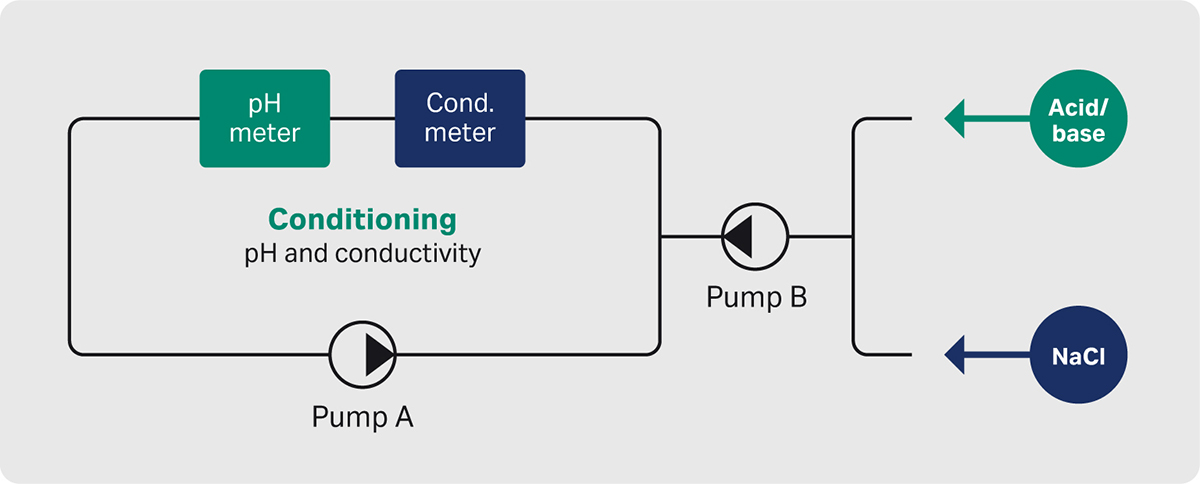
Fig 3. Schematic description of the conditioning hardware setup.
The conditioning ÄKTA pure system received elution peak material from the capture step and directed the UV containing peak to the conditioning vessel by the “peak fractionation” functionality. This minimized the dilution of the product and ensured that the right material was used for further processing.
The basic principle for sample conditioning was to add the titrant (first Tris and then sodium chloride) into a circulating flow path that includes detectors for pH and conductivity. The sample was circulated during the adjustments and the next step was initiated when the conditions were stable and fulfilled the pre-determined criteria. The pH titration was performed in one-way mode, meaning that only base was added to increase the pH to the set value. The adjustment of conductivity was done in the same way with sodium chloride.
The additions were managed by control loops to get as fast and accurate adjustments as possible without overshooting the target value. This means adding larger amounts of titrant in the beginning to get close to the setpoint value and then continue with smaller additions to fine tune the adjustment and reach the pre-determined target set point.
Adjustment in a one-way fashion was motivated by the need for keeping down the final volume of the conditioned material and to keep the step fast enough to align with the connected process. One risk with the one-way titration approach is overshooting of target set point as there generally is a compromise between speed and precision.
Polishing
Polishing was performed on a second ÄKTA pure chromatography system with a UNICORN method modified to support communication and sample transfer. The polishing was executed with an ion exchange column in flow through mode and the resulting peaks were fractionated individually. The column was directly injected from the conditioning ÄKTA pure system and the ion exchange chromatography was initiated by a handshake signaling between the two units (Fig 2) using I/O box communication.
Controlled shut down
A shutdown functionality has been introduced to the set-up to assure that a controlled shutdown can be performed if there are any disruptions to the second or third step in the process.
If any of the ÄKTA pure systems were experiencing any disruptions the capture step on the ÄKTA pcc would be stopped and the system closed down and cleaned (CIP). This is to avoid wasting any start material and to prevent contamination of the further downstream purification steps.
This is achieved by introducing a status reporting functionality that tells the ÄKTA pcc system if the conditioning instrument (first ÄKTA pure) is ready to receive the peak that is scheduled to be eluted. This status check is performed before every elution starts and, in a situation, where the conditioning ÄKTA pure system is not ready to receive the elution peak no additional elution will happen and the close down procedure will be initiated.
To resume the process after such a shutdown, the ÄKTA pcc system can simply be restarted once the further downstream ÄKTA pure units have been restored and are ready to receive material.
Results
The automated mAb purification processes require approximately 1.5 hours of preparatory work to start the purification run. The resulting material could be collected for further use the following day. The automated method allowed for less time spent manipulating the sample during purification. The continuous chromatography set-up for the capture step also gave resin and buffer savings compared to multiple runs in traditional batch mode.
The performance of the purification process at steady state is shown in the following Figures where consistency and repeatability are demonstrated. The product quality is maintained compared to the manual step-by-step process as demonstrated below.
In Figure 4 you can see a typical chromatogram from the continuous capture step in the process showing that the set-up gives consistent results and that each elution gives comparable peaks. This is a good starting point for automating the remainder of the downstream process. The material eluted from the capture step was transferred to the conditioning system, and by using peak picking functionality the mAb-containing material was transferred into a titration loop. The non-mAb containing material was directed to waste by the conditioning system.
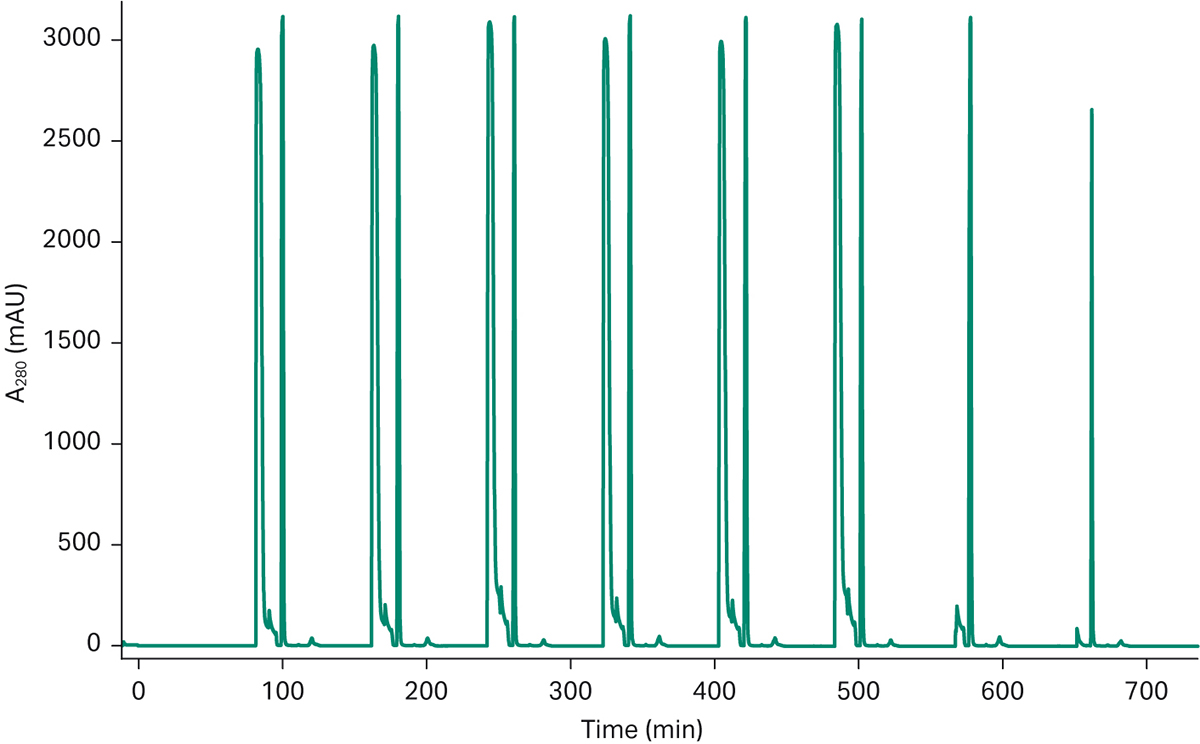
Fig 4a. Chromatogram from a 3C PCC run of a mAb feed on ÄKTA pcc. The chromatogram shows the consistent elution pattern of a 6-loop mAb capture run. The two last elution peaks come from the close down phase in the chromatography run and is not in steady state mode.
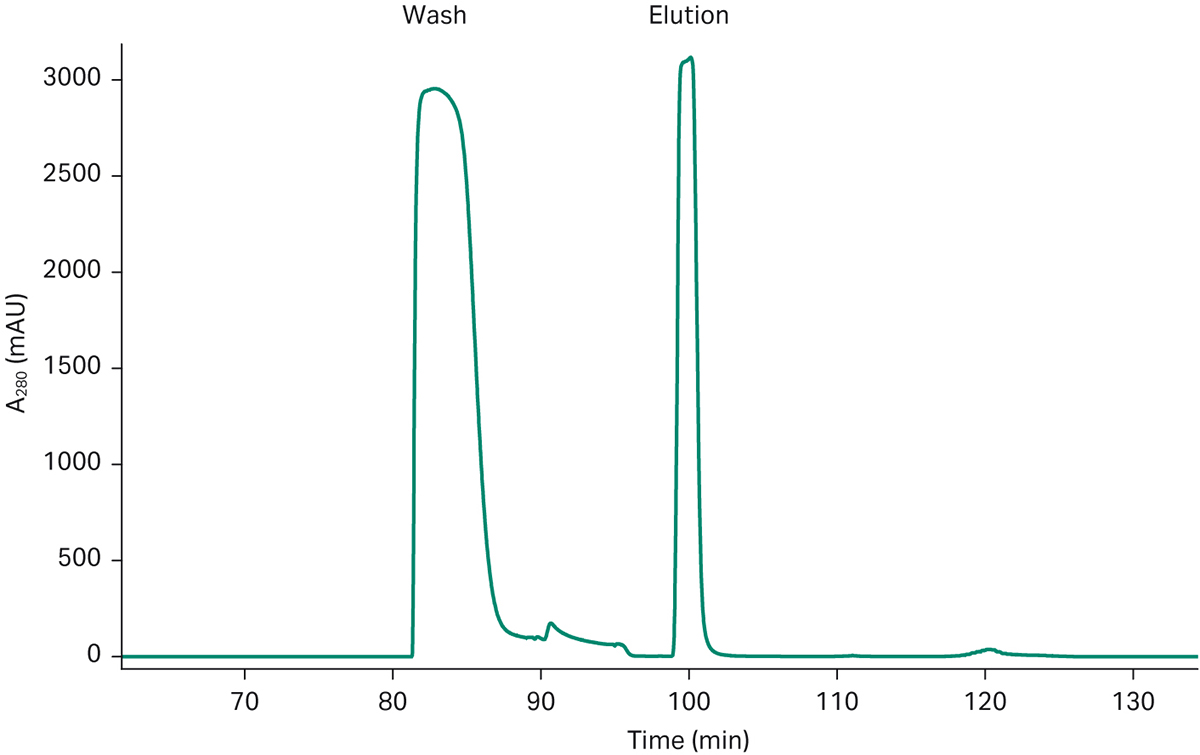
Fig 4b. Detail of one PCC loop showing wash and elution/product peak which is transferred to the polishing step.
The chromatograms in Figure 5 show that the set-up is well suited to change conditions to different target values for pH and conductivity. The target set points were reached with good precision which gives the capability to screen different conditions for the polishing step using this set-up and control mechanism.
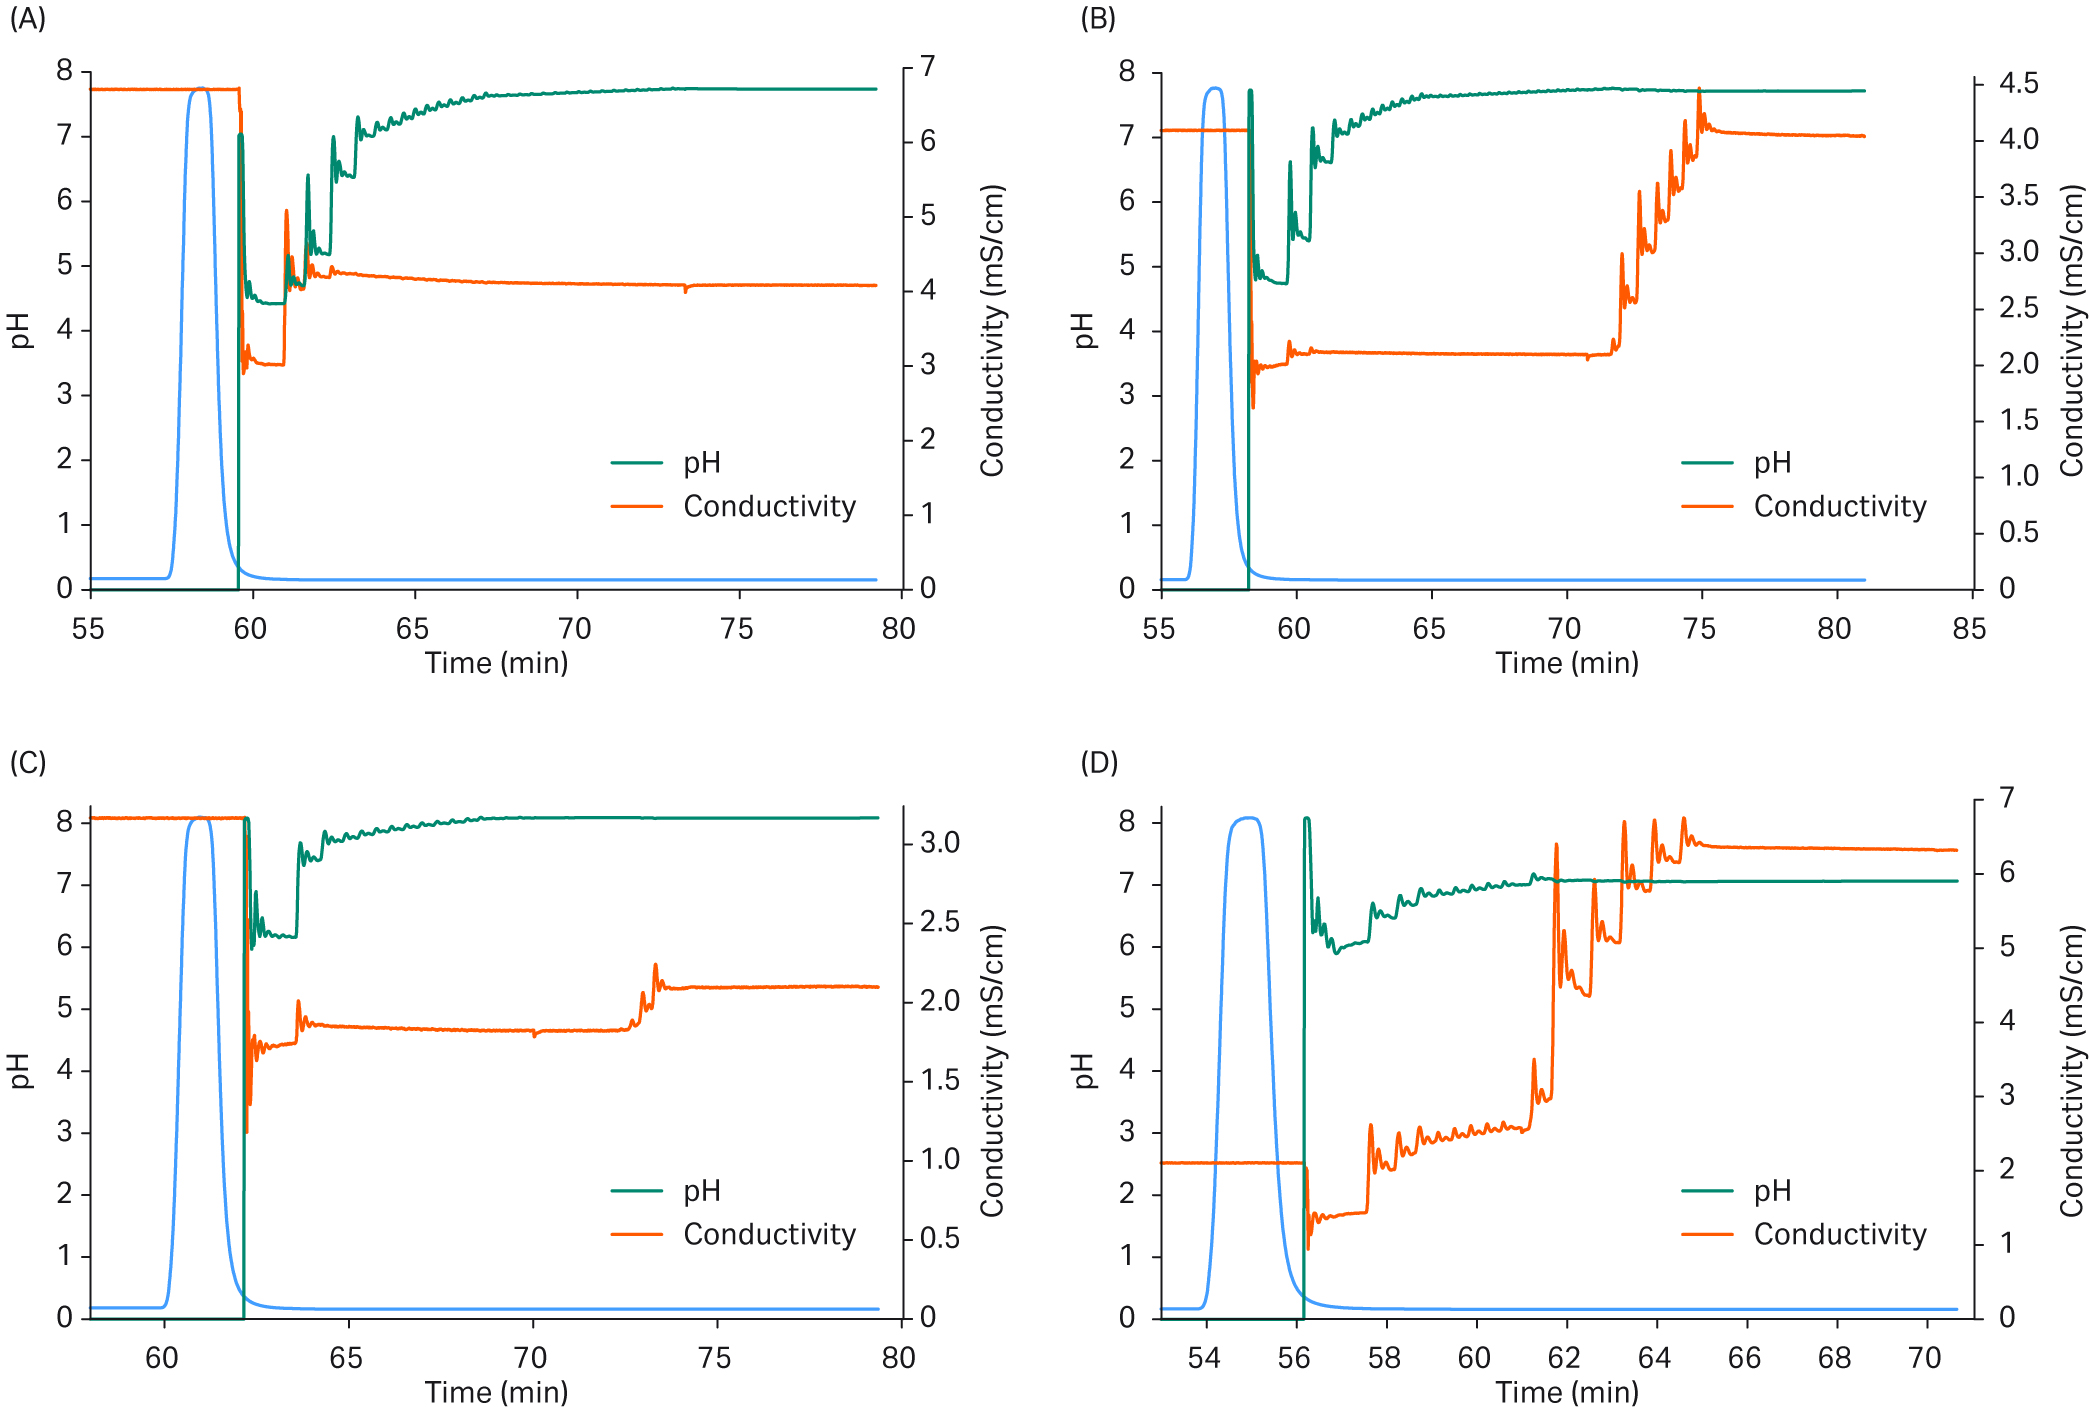
Fig 5. Results from different pH and conductivity adjustments.
The blue curve shows the mAb-containing material sent from the capture system and peak fractionated by the conditioning system and further processed. The green line shows the adjustment of pH, and the orange line shows the adjustment of conductivity. (a) Conditioning to set point pH 7.73 and conductivity 4.0 mS/cm. End point pH 7.70, conductivity 4.1 mS/cm. (b) Conditioning to set point pH 7.73 and conductivity 4.0 mS/cm. End point pH 7.72, conductivity 4.0 mS/cm. (c) Conditioning to set point pH 8.1 and conductivity 1.98 mS/cm. End point pH 8.1, conductivity 2.16 mS/cm. (d) Conditioning to set point pH 7.0 and conductivity 6.40 mS/cm. End point pH 7.1, conductivity 6.35 mS/cm.
In Figure 6 you can also see the reproducibility of the chosen set-up for the conditioning step. The control functionality implemented also assures that target set-points will be reached even with variations in the starting conditions. This can be seen as slight time differences in the chromatograms where the dynamic, in-line adaptation gives the same end results.
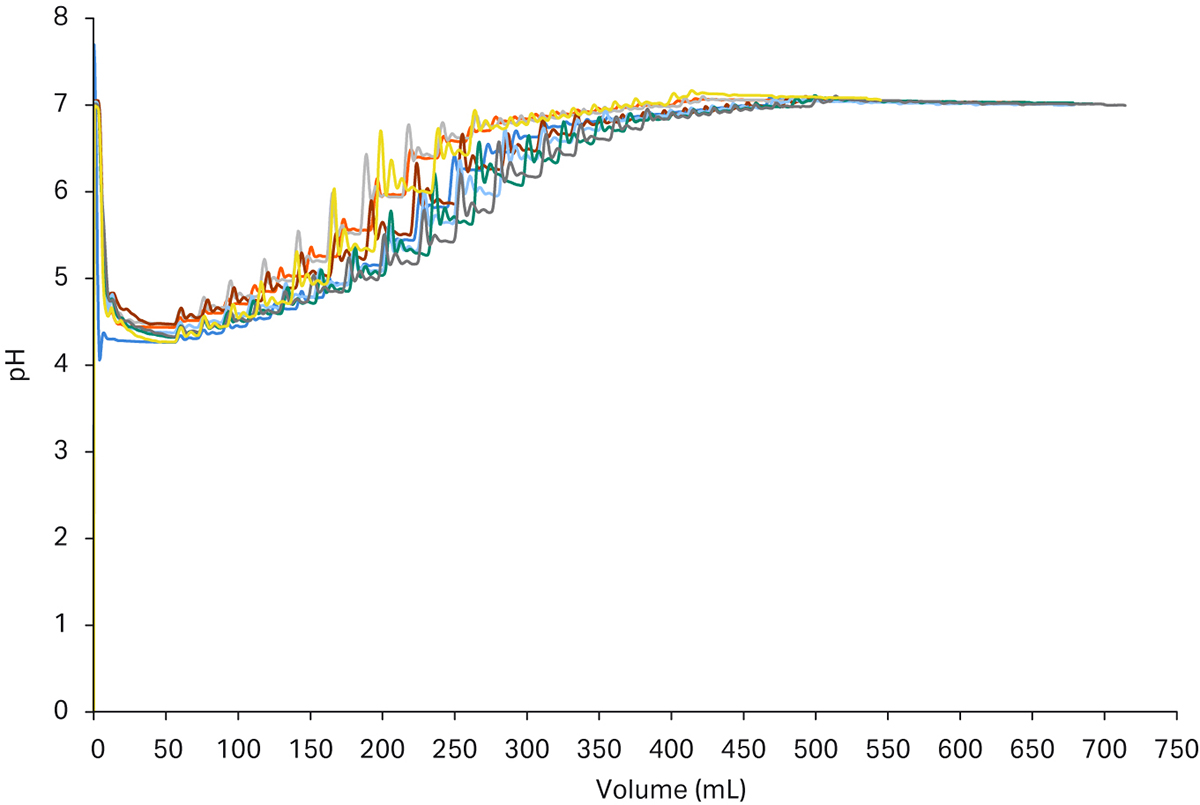
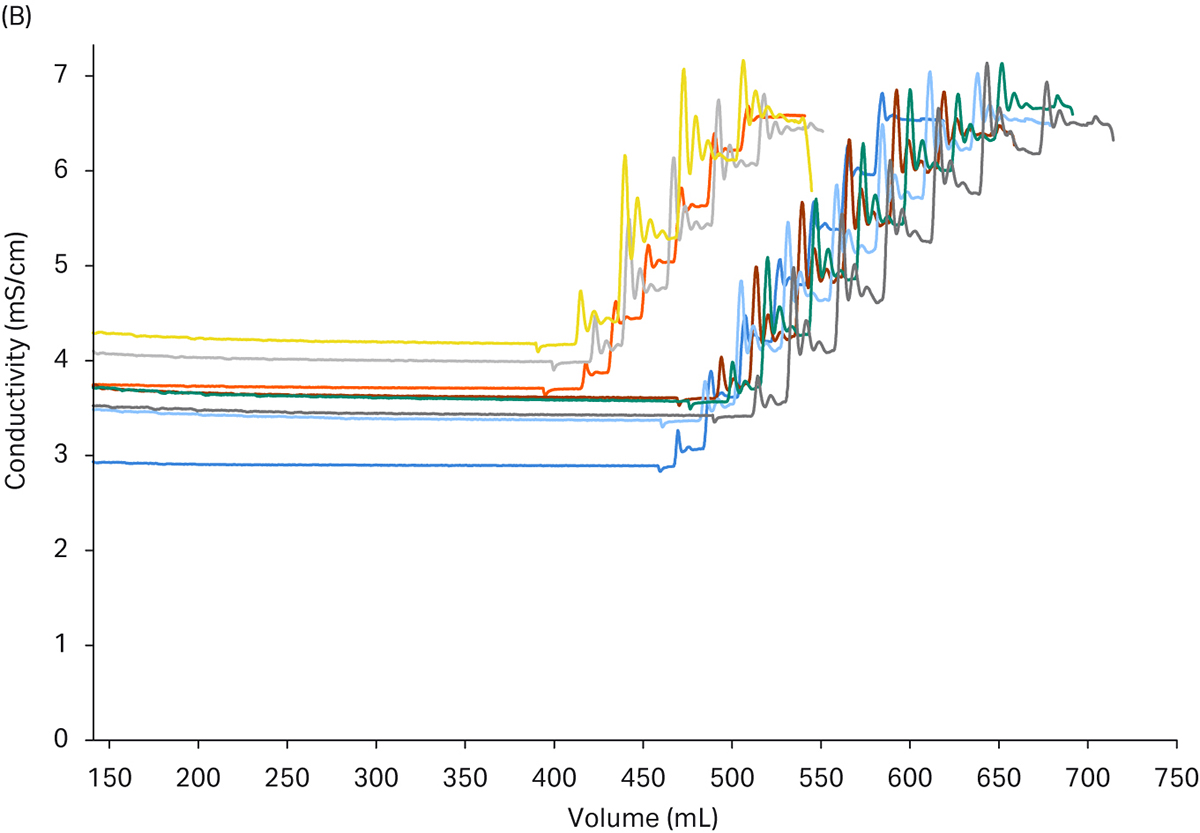
Fig 6. Chromatograms from the conditioning step of a 6-loop purification run. (a) shows the pH adjustment of the peaks from the capture step and the results are almost identical and the set point is reached with good precision. (b) shows the adjustment of conductivity. In some cases, the adjustment was a bit faster due to proximity to set point in the first titrant additions. The second class of additions took a bit longer time to fine tune but as can be seen the final value was reached with good precision.
The last part in this downstream process, after the continuous capture and conditioning steps, is a polishing step. Figure 7 shows the chromatograms from six separate polishing runs overlaid to show reproducibility between runs.
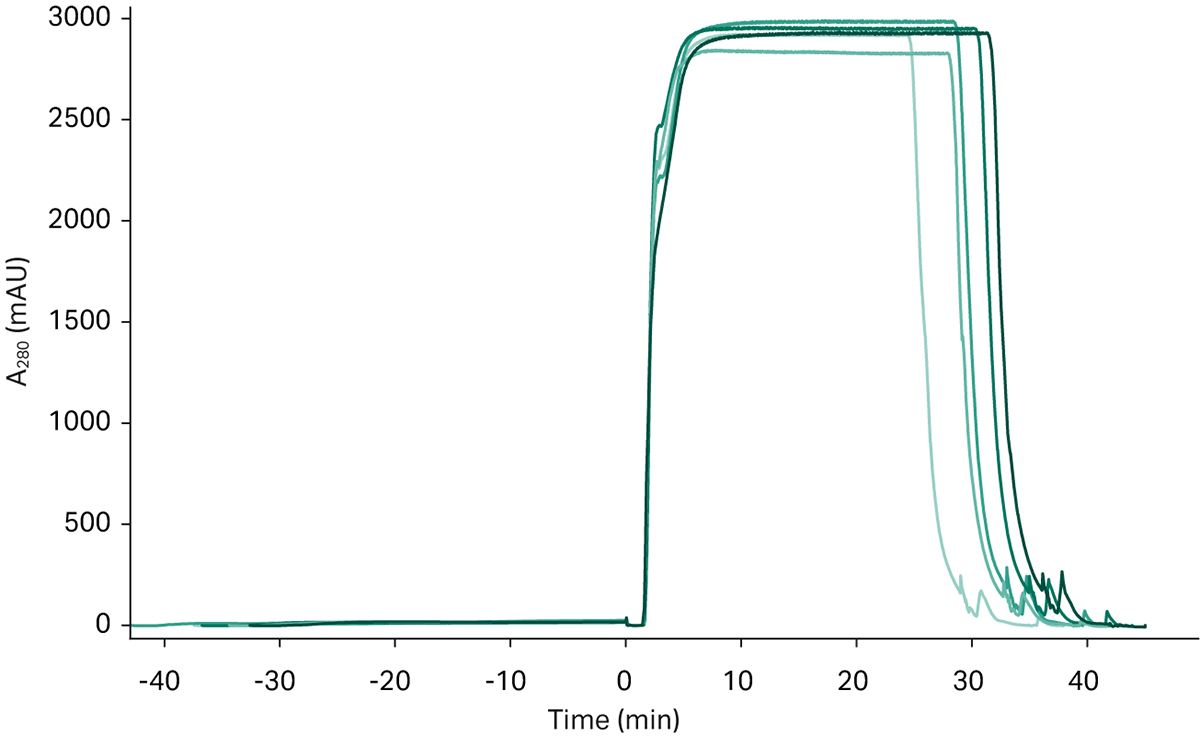
Fig 7. UV chromatograms from the polishing step, showing an overlay of six different chromatograms.
The analytical results shown in Tables 1 and 2 demonstrate a total yield of 92% for the complete automated purification process and no aggregates or fragments were detectable in the final product. All product quality attributes fulfilled the pre-determined specifications and were comparable to results obtained in the more manual set-up.
Table 1. Analytical data from the automated purification process.
| Automated process | |||||||
| Fraction | mg loaded | mg/mL | mL | mg | Recovery | HCP (ng/mg) | ProA leach (ng/mg) |
| Conditioned media load | 1110 | 1.5 | 740 | 1110 | 100% | - | - |
| Protein A | 1110 | - | - | - | - | 158 | 1.4 |
| IEX pool | 1110 | 7.9 | 129 | 1016 | 92% | 16 | 0.3 |
| IEX strip | 1110 | 0.17 | 42 | 7 | 1% | - | - |
Table 2. Analytical data from the batch purification process.
| Batch process | |||||||
| Fraction | mg loaded | mg/mL | mL | mg | Recovery | HCP (ng/mg) | ProA leach (ng/mg) |
| Conditioned media load | 1110 | 1.5 | 740 | 1110 | 100% | - | - |
| Protein A | 1110 | 7.7 | 142 | 1093 | 99% | 129 | 1.9 |
| IEX pool | 901 | 5.6 | 146 | 818 | 91% | 27 | 0.3 |
| IEX strip | 901 | 0.4 | 50 | 22.1 | 2% | - | - |
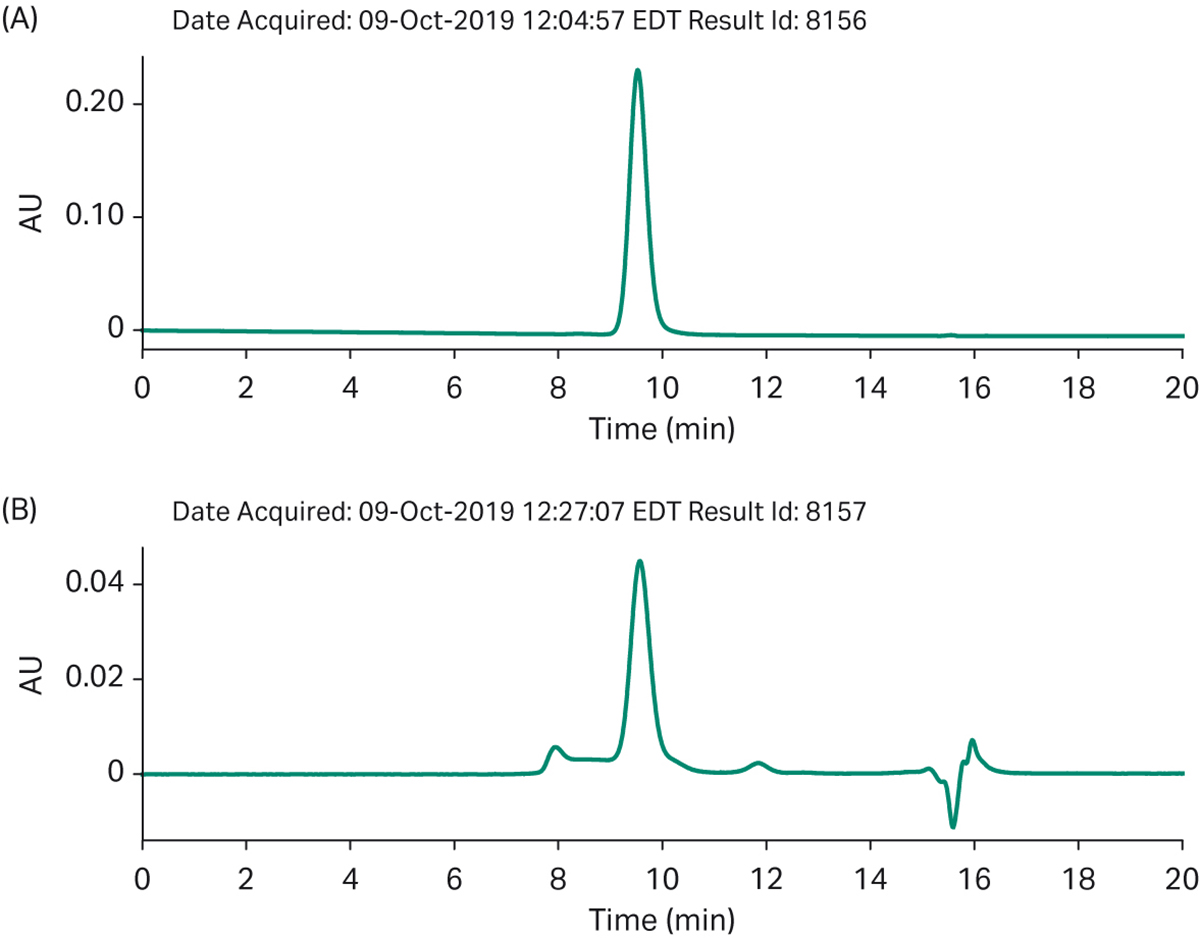
Fig 8. Automated process a) SEC analysis of purified final product b) impurities bound to the polishing column.
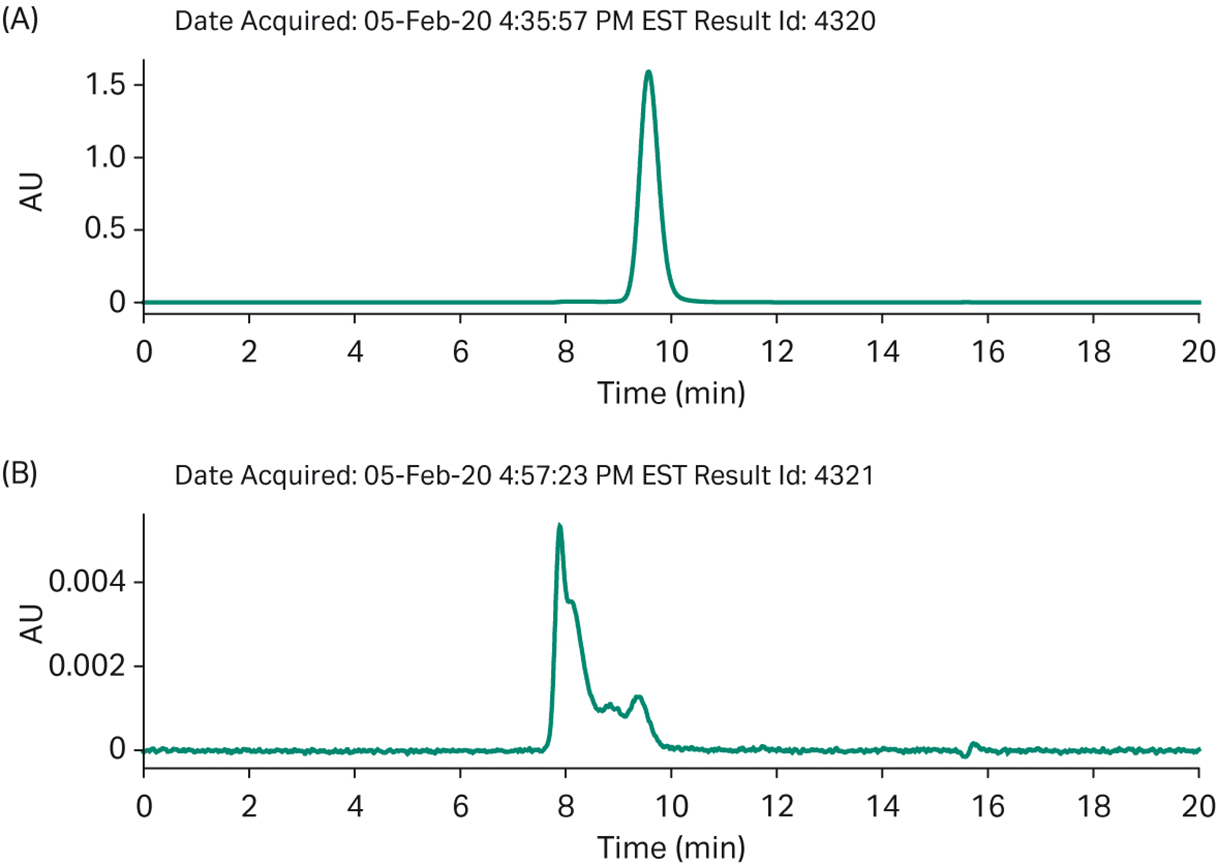
Fig 9. Batch process analytics a) SEC of final product b) impurities bound to the polishing column.
Conclusions
This study shows that this automation set-up works in a lab environment and is advantageous both considering output and efficiency. Fine tuning and further improvements can be implemented depending on the purification needs.
The major savings with a continuous, automated process is the decreased need for hands on time. A scientist will need 1.5 hours for preparation work to set up the process and it can then be run automatically overnight. The product quality and yields were retained compared to the more manual set-up.
One additional benefit with this procedure is that a process can be studied and optimized by changing the process parameters for each individual capture run in an automated fashion. The final products can be analyzed, and the impact of different processing conditions can be evaluated. This can speed up process development without using more valuable manual interactions by the scientist. Yet another benefit from increased automation levels is the minimized risk of manual errors.
While developing this automation set-up a few key points were essential to the successful control strategy implementation:
- The integration efforts were started at the lowest level connecting two (2) unit operations and making sure that set-up was robust before adding additional steps
- No additional automation layer was implemented to keep the set-up simple, instead UNICORN programming and I/O signals between the systems were used. This helped keep development efforts and cost at a minimum.
- The initial set-up was developed and tested at Cytiva before handing over to our collaboration partner for additional testing
- Due to frequent discussions and face-to-face meetings any feedback, trouble shooting, and adjustments to the set-up could be done quickly
- Two of the major challenges for this work were:
- Assuring the conditioning step could be performed quickly enough to match the other steps in the process. This was managed through utilizing the quick response times and accurate sensors and components available on the ÄKTA platform.
- The dimensioning of the different unit operations to achieve a well-balanced process.
Acknowledgement
This automated process was developed in close collaboration with Pfizer, Andover, MA, USA. We thank Aaron D’Antona, Ryan Jackobek, Darren Ferguson, Sara Wagman, and Lily Zhu for kindly sharing data and for valuable discussion.