Protein A affinity chromatography is the major purification technique for capture of antibodies or Fc-fusion proteins and enables a platform approach to downstream processing. Recent years have seen several modern protein A resins with high binding capacity, which also claim alkali resistance up to 0.5 M NaOH and more for cost-effective cleaning. But are all these protein A resins equally alkali resistant and how does that impact resin lifetime and purification performance?
We performed a resin lifetime study over 150 cycles, using clarified cell harvest in every cycle, to evaluate the alkaline stability of three protein A-based resins — MabSelect™ PrismA (Cytiva), Praesto™ Jetted A50 (Purolite Corp.), and Amsphere™ A3 (JSR Corp.).
Our findings are:
- Remaining dynamic binding capacity (DBC) of mAb with MabSelect™ PrismA is ~ 90% over 150 cycles with 0.5 M NaOH cleaning in place after each cycle while it is only ~ 60% for Amsphere™ A3 resin. Furthermore, the remaining DBC is ~ 40% for Praesto™ Jetted A50 after only 120 cycles.
- mAb yield is above 80% over the cycles for MabSelect™ PrismA (loaded to 80% of original DBC) while yield for Praesto™ Jetted and Amsphere™ A3 drop relatively quickly below this level at 60 and 100 cycles, respectively.
- Protein A leakage, aggregates, and HCP levels in elution pools are low and consistent for all three resins. Impurity levels were measured until yield dropped below 80% for the respective resins.
Introduction
Over the past 40 years, development of protein A chromatography resins has allowed annual productivity gains as well as capacity gains of 4.3% and 5.5%, respectively. Binding capacity of protein A resins have increased from 30 g/L to a remarkable 70 g/L in the last 15 years alone.
One of the main remaining pain points experienced for protein A resins is the relatively low alkaline stability of the protein ligand. High nutrient load present in the cell culture harvest, combined with a low alkaline resistance of the protein A resin, result in an elevated risk of resin fouling and bioburden issues. Recent years have seen several modern protein A resins with high binding capacity, which also claim alkali resistance of up to 0.5 M NaOH and more.
The question is, however, are all these alkaline resistant protein A resins equally resistant? And how does that affect the process economy in therapeutic mAb purification processes?
Protein A ligand engineering
Protein A is a cell surface protein of Staphylococcus aureus made up of five IgG binding domains to a molecular weight (Mr) of 42 000. Different engineering approaches have been made by different vendors. In development of the MabSelect™ PrismA ligand, multimerization of the B-domain was performed (Fig 1). The selected domain has been further alkaline‑stabilized by site‑directed mutagenesis, in which sensitive amino acids have been exchanged for more stable ones.
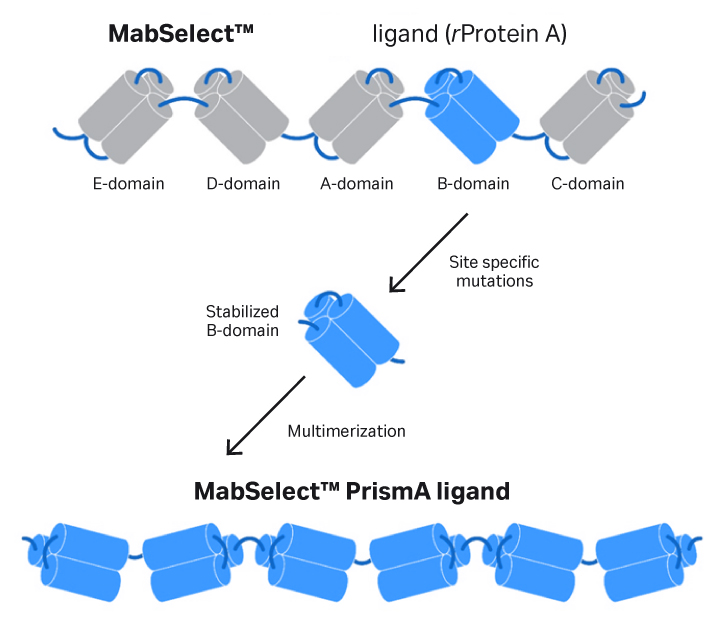
Fig 1. Development of MabSelect™ PrismA ligand. The ligand is a recombinant protein derived from the B‑domain of protein A. Although based on the same domain as MabSelect SuRe™ resins, the selected domain has been further alkaline‑stabilized by site‑directed mutagenesis, in which sensitive amino acids have been exchanged for more stable ones.
Protein A resin benchmarking in a lifetime study
In this benchmarking study, we have studied three modern protein A resins — all claiming to be alkaline resistant at 0.5 M NaOH. A concentration of 0.5 M NaOH provides more efficient cleaning and improved bioburden control compared to CIP with lower NaOH concentration. With this in mind, we tested the claims of alkaline stability of three resins on the market today — Cytiva’s MabSelect™ PrismA, Praesto™ A50 Jetted (Purolite), and Amsphere™ A3 (JSR).
After packing in Tricorn™ columns, we subjected each resin to an extensive resin lifetime performance study where clarified cell harvest was cycled up to 150 times. Dynamic binding capacity (DBC) and purification performance were measured at regular intervals (every 10th cycle) and all resins were subjected to CIP with 0.5 M NaOH for 15 min after each cycle.
The basic characteristics of the three resins are shown in Table 1.
Table 1. Basic characteristics of the resins tested in the study
| Characteristics |
MabSelect™ PrismA Cytiva |
Praesto™ Jetted A50 Purolite |
Amsphere™ A3 JSR |
| Particle size (µm) | 60 | 50 | 50 |
| Claimed flow velocity (cm/h) | 300* | 300† | 1200‡ |
| Technology | High-flow agarose | Highly cross-linked agarose and jetted beads | Methacrylic polymer |
| Claimed capacity | 80 g/L at 6 min residence time (RT) | 80 g/L at 10 min residence time 50 g/L at 3 min residence time |
54 g/L at 4 min residence time |
| Claimed alkaline stability | 0.5 to 1.0 M NaOH | Up to 0.5 M NaOH | 0.1 to 0.5 M NaOH |
* Packed in AxiChrom™ 300 column with 30 cm i.d. at 20 cm bed height, using buffers with the same viscosity as water at 20°C, 1 bar (0.1 MPa, 14.5 psi) back pressure.
† Based on stated 300 cm/h in 2.6 cm i.d at 20 cm bed height at a back pressure of 3 bar (0.3 MPa, 43.5 psi).
‡ Resin maximum operating flow velocity. Web page states this varies with column dimension, which needs to be accounted for in column and system pressure limits.
Praesto™ Jetted A50 values obtained from purolite.com/ls-product/jetted-a50 accessed on 14 Dec 2020.”
Amsphere™ A3 values obtained from jsrmicro.be/sites/default/files/attachments/amsphere_a3_operational_conditions.pdf accessed on 14 Dec 2020.
See the bottom of the page for detailed Materials and methods. All studies described in this article were performed at Cytiva, Uppsala in 2020. All data is held at Cytiva, Uppsala.
Results
Dynamic binding capacity and yield of mAb
Tricorn™ 5/100 columns were packed with the resins according to the vendor´s instructions. The initial binding capacity at 10% breakthrough (Qb10) of purified mAb for each of the resins was evaluated with a 6 min residence time on the column.
The results in Table 2 show that the highest DBC for mAb was with MabSelect™ PrismA while initial DBC for Praesto™ Jetted A50 and especially Amsphere™ A3 were lower.
Table 2. Initial DBC at 10% breakthrough and mAb load in the lifetime studies
| Resins |
Initial Qb10 (mg mAb/mL resin) |
Load (mg mAb/mL resin) |
| MabSelect™ PrismA | 65.4 | 52.3 |
| Praesto™ Jetted A50 | 59.3 | 47.4 |
| Amsphere™ A3 | 51.3 | 41.0 |
Based on the initial DBC evaluation, we loaded mAb from harvested cell culture fluid (HCCF) to 80% of Qb10. The lifetime studies were performed for 150 cycles including 0.5 M NaOH CIP in each cycle. In the case of Praesto™ Jetted A50, however, we stopped at 120 cycles because we observed large reductions in both DBC and yield (Fig 2 and 3).
After 150 cycles, MabSelect™ PrismA maintained ~ 90% of initial DBC whereas Amsphere™ A3 drops to only 60%. For Praesto™ Jetted A50, we observed poor results where DBC dropped to below 40% after only 120 cycles.
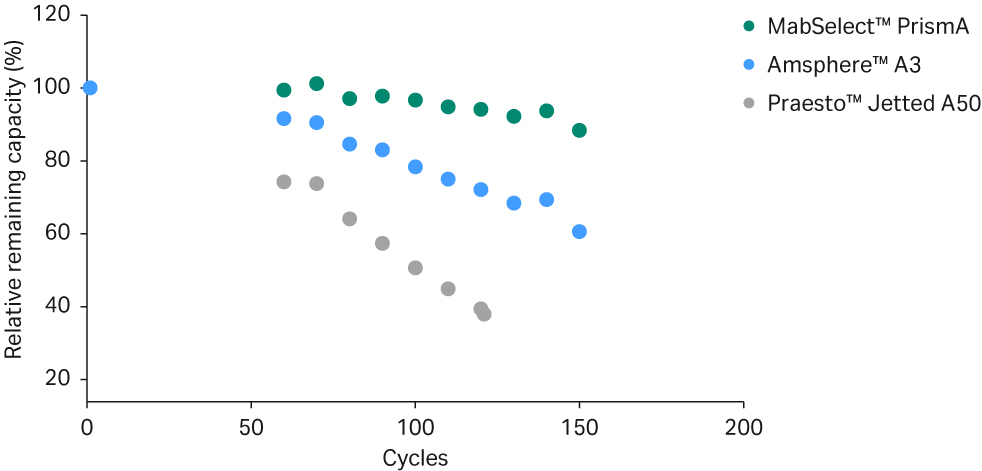
Fig 2. Relative remaining DBC of mAb for Cytiva’s MabSelect™ PrismA compared with Praesto™ Jetted A50 and Amsphere™ A3 up to 150 cycles.
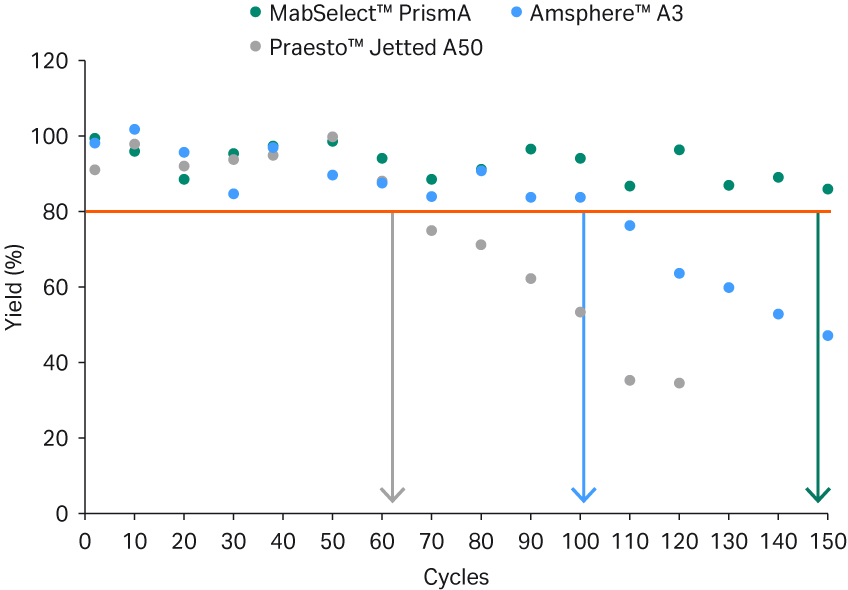
Fig 3. mAb yield on the three columns in the lifetime study up to 150 cycles. The mAb load in HCCF was set to 80% of Qb10, based on a Qb10 determination with pure mAb at the beginning of the study.
For MabSelect™ PrismA, the yield is above 80% throughout the whole lifetime study (Fig 3). This is not the case for the yield of mAb loaded onto Praesto™ Jetted A50, which is below 80% after only 60 cycles and Amsphere™ A3, which drops to below 80% yield after 100 cycles.
MabSelect™ PrismA also showed robust alkaline stability in terms of no observed breakthrough of mAb until cycle 150 in the HCCF loading phase (Fig 4A). Further evidence of the reduced capacity of the other two resins is observed by breakthrough of mAb in sample loading after only 60 cycles for Praesto™ Jetted A50 and Amsphere™ A3, respectively (Fig 4B and C).
Column: Tricorn™ 5/100 (CV 2 mL)
Load: mAb in HCCF at 80% of Qb10 of the mAb, RT 6 min
Elution buffer: 50 mM sodium acetate, pH 3.5
CIP: 0.5 M NaOH for 15 min after each cycle
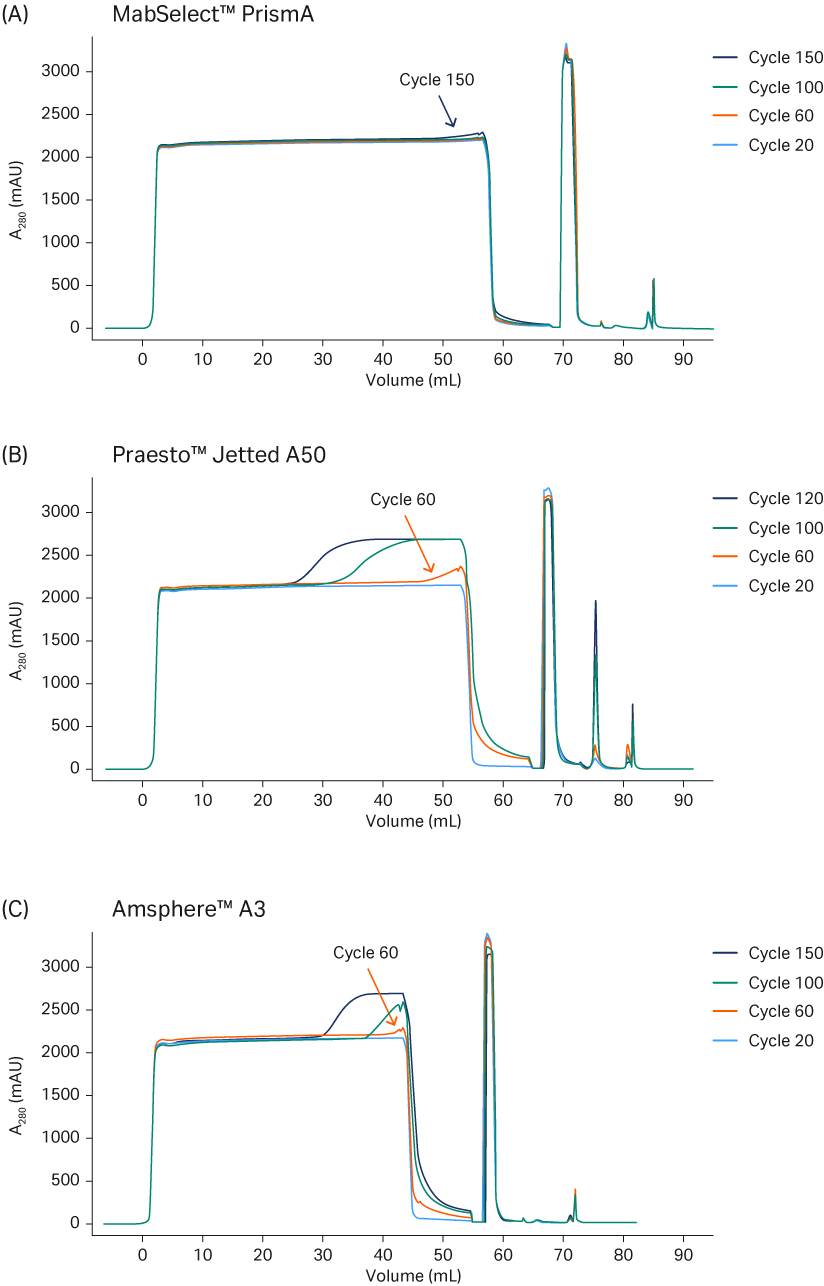
Fig 4. Overlay breakthrough curves from the lifetime study showing the effect of 0.5 M NaOH CIP on mAb breakthrough in the HCCF loading phase for (A) MabSelect™ PrismA, (B) Praesto™ Jetted A50, and (C) Amsphere™ A3 protein A resins.
As seen in Figure 4B, we observe breakthrough (deviation from the plateau) of mAb in the flowthrough on Praesto™ Jetted A50 as early as cycle 60, after which the breakthrough comes earlier for every cycle. Furthermore, the wash-out curve changes shape with increasing cycles, the elution peak decreases, and the strip and CIP peaks increase.
Analysis of impurities from the lifetime study
We collected eluates from the lifetime study and analyzed for impurities such as HCP (Fig 5), aggregates (Fig 6), and protein A leakage (Fig 7).
HCP levels were measured in elution pools until yield dropped below 80% for each resin. HCP in the elution pool from MabSelect™ PrismA is low. HCP content on the Amsphere™ A3 column is similar while a slightly lower level is observed with Praesto™ Jetted A50.
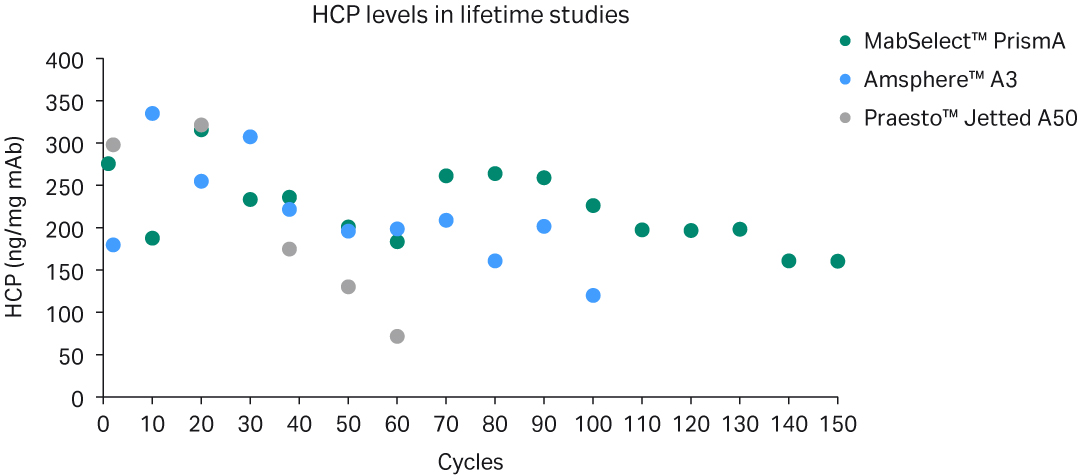
Fig 5. HCP content in elution pools from the three resins in the lifetime study. Up to 150 cycles with 0.5 M NaOH CIP in each cycle were performed. Measurements were made until yield had dropped to 80%. HCP was quantitated using CHO HCP E3G kit from Gyros™ Protein Technologies.
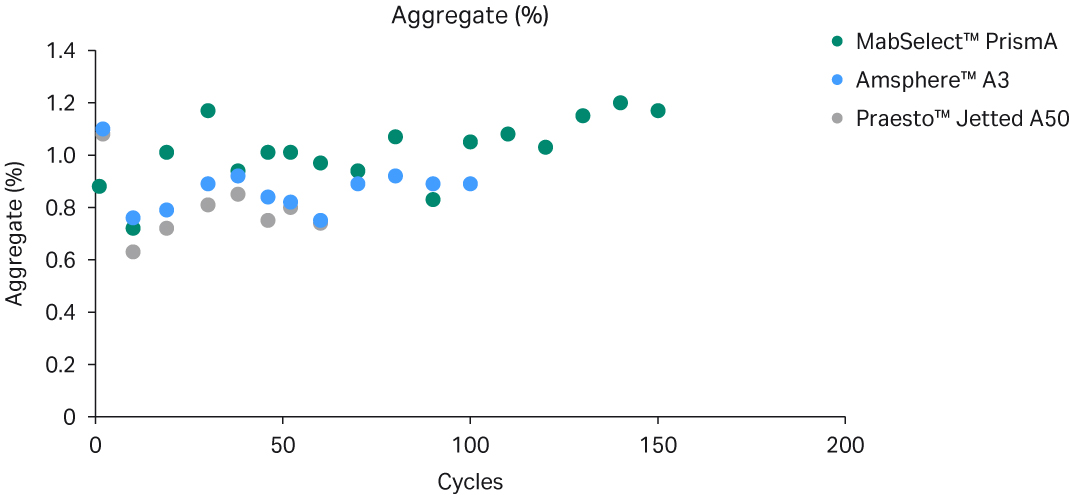
Fig 6. Aggregates in elution pools from the three resins in the lifetime study. Up to 150 cycles with 0.5 M NaOH CIP in each cycle were performed. Measurements were made until yield had dropped to 80%. Aggregates were quantitated using Superdex™ 200 Increase column.
Aggregate levels are relatively consistent for all three resins as seen in Figure 6.
MabSelect™ PrismA has a consistent level of protein A leakage (< 25 ppm), with slightly lower levels for both Praesto™ Jetted A50 and Amsphere™ A3 although comparison is difficult due to the different analysis methods used. In the first run of the lifetime study, we determined protein A leakage to about 35 ppm for all resins. A higher value is expected in the first run based on earlier findings (Fig 7).
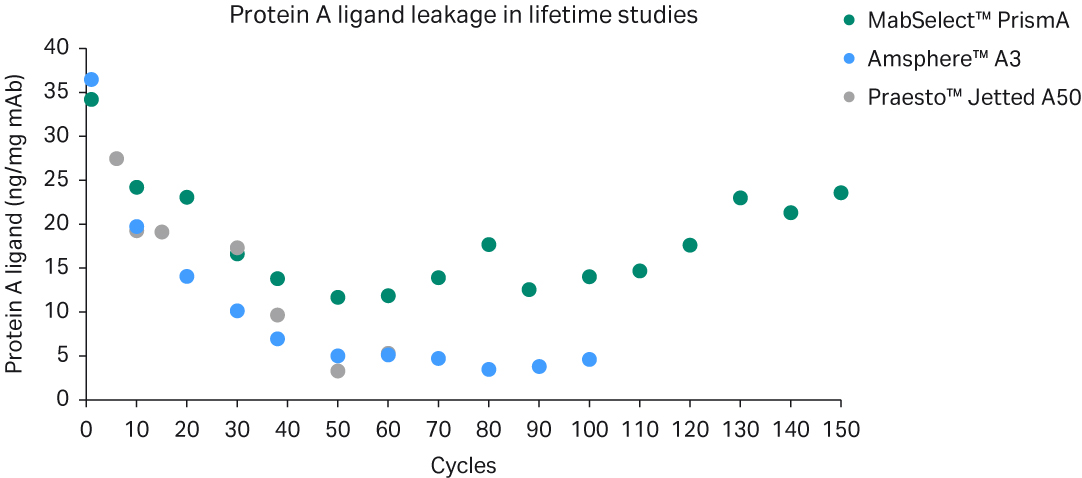
Fig 7. Protein A ligand leakage in elution pools from the three resins in the lifetime study. Up to 150 cycles with 0.5 M NaOH CIP after each cycle were performed. Measurements were made until yield had dropped to 80%. Ligand leakage was quantitated using ELISA kit from Repligen™ with MabSelect™ PrismA standard for MabSelect™ PrismA, NGL standard for Praesto™ Jetted A50, and rProtein A standard for Amsphere™ A3.
Conclusions
- Alkaline stability and lifetime at 0.5 M NaOH up to 150 cycles is highest for MabSelect™ PrismA compared with either Praesto™ Jetted A50 or Amsphere™ A3
- MabSelect™ PrismA has approximately twice as long lifetime compared to Praesto™ Jetted A50 when using 0.5 M NaOH for CIP
- Consistent purification performance was observed up to 150 cycles for MabSelect™ PrismA
- Improved bioburden control and longer resin lifetime of MabSelect™ PrismA should translate to good process economy
- CIP with 0.5 M NaOH results in more efficient cleaning and improved bioburden control compared to CIP with lower NaOH concentration
Materials and methods
Column packing
Tricorn™ 5/100 columns were packed with each of these resins according to the vendor’s instructions. The packing quality was tested with an ÄKTA™ chromatography system using a flow rate of 0.2 mL/min for 2 column volumes (CV). 20% ethanol was used as eluent while the sample was 2% acetone in 20% ethanol. We calculated plate number and asymmetry factor from the acetone peak.
Samples
We used mAb in harvested cell culture fluid (HCCF) for cycling in the lifetime benchmarking study and purified mAb for evaluation of DBC.
Resin lifetime study
We performed the resin lifetime study using mAb in harvested cell culture fluid (HCCF) over 150 cycles. The running conditions used are shown in Table 3. The mAb load in HCCF was set to 80% of DBC at breakthrough (Qb10) for the lifetime study for each resin. An acidic strip was applied every cycle. Cleaning-in-place (CIP) was performed for 15 min after each cycle.
During the lifetime study, eluates were collected and analyzed for yield and impurities such as HCP, aggregates, and protein A leakage. We tested DBC at the start of the study, and then every 10th cycle from cycle 60 using purified mAb.
The process conditions we used in the resin lifetime study are shown in Table 3.
Table 3. Process conditions used for the protein A purification step for each resin in the lifetime study
| Phase |
Buffer |
Volume (CV) |
Residence time (min) |
| Equilibration | 20 mM sodium phosphate, 150 mM NaCl, pH 7.4 | 3 | 4 |
| Load | 80% of the Qb10 value for each resin | – | 6 |
| Wash 1 | 20 mM sodium phosphate, 500 mM NaCl, pH 7.0 | 5 | 6 |
| Wash 2 | 50 mM sodium acetate, pH 6.0 | 1 | 4 |
| Elution | 50 mM sodium acetate, pH 3.5 | 3 | 12 |
| Strip | 100 mM acetic acid, pH 2.9 | 3 | 4 |
| CIP | 0.5 M NaOH | 3 | 5 |
| Re-equilibration | 20 mM sodium phosphate, 150 mM NaCl, pH 7.4 | 3 | 4 |
Analyses
Starting at cycle 60, we evaluated the DBC by frontal analysis using purified mAb from the lifetime study. Purified mAb was diluted in equilibration buffer to approximately 2 mg/mL. To obtain a maximum UV absorbance at 280 nm, we by-passed the column with the mAb solution before the DBC run. A flow rate corresponding to a residence time of 6 min was used during the sample load in the frontal analysis. Qb10, was determined from the breakthrough curve using a standardized spreadsheet.
The conditions used for the DBC evaluation are shown in Table 4.
Table 4. Conditions used for DBC measurements for the mAb used in this study
| Phase |
Buffer |
Volume (CV) |
Residence time (min) |
| Equilibration | 20 mM sodium phosphate, 150 mM NaCl, pH 7.4 | 3 | 4 |
| mAb load | 2 mg/mL mAb In 20 mM sodium phosphate, 150 mM NaCl, pH 7.4 |
85% of max. absorbance | 6 |
| Wash | 20 mM sodium phosphate, 150 mM NaCl, pH 7.4 |
5 | 6 |
| Elution | 50 mM sodium acetate, pH 3.5 | 3 | 12 |
| CIP | 0.5 M NaOH | 3 | 5 |
| Re-equilibration | 20 mM sodium phosphate, 150 mM NaCl, pH 7.4 |
3 | 4 |
To determine mAb yield during the lifetime study, we analyzed the absorbance at 280 nm of selected eluates for mAb concentration. Yield was determined by dividing the amount of mAb in the eluate with the amount of mAb loaded on the column.
We analyzed HCP from elution pools every 10th cycle using the CHO HCP E3G Kit (Gyros™ Protein Technologies).
Aggregate concentration was determined by size exclusion chromatography (SEC) using a Superdex™ 200 Increase 10/300 column. The mobile phase was phosphate buffered saline (PBS) and the flow rate was 1 mL/min for 30 min and 20 µL of each sample was applied to the column.
Analysis of ligand leakage was performed using a protein A ELISA kit (Repligen™ Corp.) according to the manufacturer’s recommendations. MabSelect™ PrismA ligand was the standard for the MabSelect™ PrismA column, NGL-Impact A™ (Repligen™ Corp.) ligand standard for Praesto™ Jetted A50 ligand, and rProtein A standard for Amsphere™ A3 resin.
TR2961327
CY19685