Cleaning in place (CIP) of chromatography resins is important for the integrity and safety of the final biopharmaceutical product. Efficient and resin-compatible cleaning procedures also increase the column lifetime and contribute to cost-effective processes. Alkaline-stable protein A resins like MabSelect PrismA™ resin are available to use, but what CIP conditions are needed for sufficient cleaning of the resin?
Here, we show a lifetime study verified on four columns packed with MabSelect PrismA™ chromatography resin. The study follows on from a high-throughput study of sodium hydroxide cleaning efficiency for protein A resins. We conducted this follow-up study for approximately 150 purification cycles using CHO cell culture containing mAb and different CIP conditions.
The results of the study show that:
- 0.1 M NaOH is not sufficient for CIP in repeated cycling. CIP with a NaOH concentration below the recommended may result in a decrease in binding capacity due to fouling of your resin, not due to loss of ligand.
- 0.5 M NaOH in every cycle is recommended for effective CIP of MabSelect PrismA™ resin. The elution profile (peak width) over the cycles is consistent when using 0.5 M NaOH or higher concentration in every cycle.
- A good correlation is achieved between CIP studies in the high-throughput format and columns.
Introduction
Efficient resin cleaning protocols contribute to cost-effective processes. By preventing a gradual build-up of contaminants, you can increase the lifetime of your resin. The decision to reuse or dispose of the resin is driven by process economy and depends on factors including the unit operation scale, cost of resin, and resin compatibility with cleaning agents.
In an earlier study, A high-throughput study of sodium hydroxide cleaning efficiency for protein A resin, we looked at cleaning efficiency for protein A resin in PreDictor™ plates with sodium hydroxide concentrations up to 1.0 M, three contact times, and the effect on an acidic strip. In this study, we have selected a few conditions and we look at the correlation between chromatography column and high-throughput approaches.
Materials and methods
Column packing
Four Tricorn™ 5/50 columns were packed with MabSelect PrismA™ resin according to the product instructions. The packing quality was tested using an ÄKTA™ chromatography system flow rate of 0.1 mL/min for 1 column volume (CV). As eluent, we used 0.4 M NaCl (dissolved in ultrapure water) while the sample was 0.8 M NaCl (dissolved in ultrapure water). We calculated the plate number and asymmetry factor from the NaCl peak.
Sample preparation
We used mAb in clarified cell culture harvest (CCH) at a concentration of 2.5 g/L for cycling in the lifetime study and purified 2 g/L of mAb for evaluation of dynamic binding capacity (DBC). Before the cycling, we filtered the clarified CCH using a 0.2 µm filter.
Experimental setup
The MabSelect PrismA™ columns were connected to an ÄKTA pure™ 25 chromatography system. We tested DBC in the beginning and the end of the study, and a few times using purified mAb during the study to monitor the remaining binding capacity. The conditions used for the determination of DBC are shown in Table 1.
Table 1. Conditions used in DBC determination of MabSelect PrismA™ resin
| Phase | Buffer | Volume (CV) | Residence time (min) | Flow direction |
| Equilibration | 20 mM sodium phosphate, 150 mM NaCl, pH 7.4 | 3 | 6 | down |
| Sample load | Up to 20% of max. absorbance | – | 6 | down |
| Wash | 20 mM sodium phosphate, 150 mM NaCl, pH 7.4 | 5 | 6 | down |
| Elution | 50 mM sodium acetate, pH 3.5 | 3 | 6 | down |
| CIP | 0.1 M NaOH | 3 | 5 | up |
| Re-equilibration | 20 mM sodium phosphate, 150 mM NaCl, pH 7.4 | 5 | 5 | up |
Approximately 150 cycles with clarified mAb harvest were performed and every cycle includes the phases shown in Figure 1.

Fig 1. Phases in the chromatography capture step.
The running conditions are shown in Table 2. The mAb load of CCH was 80% of the DBC at 10% breakthrough (QB10%) with a residence time of 6 min for all four columns. An acidic strip was included in every cycle. Cleaning-in-place (CIP) was performed in upflow, with the frequency shown in Table 3. The same load was used for all cycles in the study.
Table 2. Process conditions used in the MabSelect PrismA™ purification step
| Phase | Buffer | Volume (CV) | Residence time (min) | Flow direction |
| Equilibration | 20 mM sodium phosphate, 500 mM NaCl, pH 7.0 | 3 | 6 | down |
| Sample load | 80% of QB10% value for MabSelect PrismA™ | – | 6 | down |
| Wash 1 | 20 mM sodium phosphate, 500 mM NaCl, pH 7.0 | 5 | 6 | down |
| Wash 2 | 50 mM sodium acetate, pH 6.0 | 1 | 6 | down |
| Elution | 50 mM sodium acetate, pH 3.5 | 3 | 6 | down |
| Strip | 100 mM acetic acid, pH 2.9 | 2 | 6 | down |
| Cleaning in place (CIP) | See Table 3 | 3 | 5 | up |
| Re-equilibration | 20 mM sodium phosphate, 500 mM NaCl, pH 7.0 | 5 | 5 | up |
Table 3. CIP conditions for MabSelect PrismA™ resin
| CIP parameters | Column 1 | Column 2 | Column 3 | Column 4 |
| NaOH concentration (M) | 0.1 | 0.5 | 0.5 | 1.0 |
| 15 min contact time | Every cycle | Every fifth cycle | Every cycle | Every cycle |
During the lifetime study, we monitored elution volumes and collected the eluates which we analyzed for yield and impurities such as host cell protein (HCP), aggregates, and protein A leakage. We analyzed concentration in the product pool using a commercially available CHO HCP E3G kit (Gyros Protein Technologies). Leakage of ligand was determined using an in-house MabSelect PrismA™ ligand as standard.
After the finished study, we dismantled the columns, and a small ladle was used to take 60 µg samples from the top and bottom of all four columns to analyze for protein foulants (by chip electrophoresis). This analysis is described in the web article A high-throughput study of sodium hydroxide cleaning efficiency for protein A resin.
The columns were emptied, and 0.5 mL of resin was cubed and analyzed for remaining ligand density using amino acid analysis.
Results and discussion
Remaining binding capacity and ligand density
Based on the initial DBC evaluation, we loaded mAb from CCH to 80% of QB10%. We planned to perform the lifetime study over 150 cycles. However, in the case of MabSelect PrismA™ resin cleaned with 0.1 M NaOH, we stopped the study at cycle 146 due to a head space in the column, which appeared before cycle 100, and increased gradually. The loss of binding capacity is more than 40% over the 146 cycles, which is probably caused by fouling of the resin as the amino acid analysis shows only a small loss of ligand.
After 150 cycles, MabSelect PrismA™ resin maintained ~ 90% of initial DBC when we cleaned with 0.5 M NaOH, regardless of interval. MabSelect PrismA™ resin cleaned with 1.0 M NaOH in every cycle maintained ~ 80% of initial DBC. The loss of capacity when cleaning with 1.0 M NaOH is due to the loss of ligand (Fig 2).
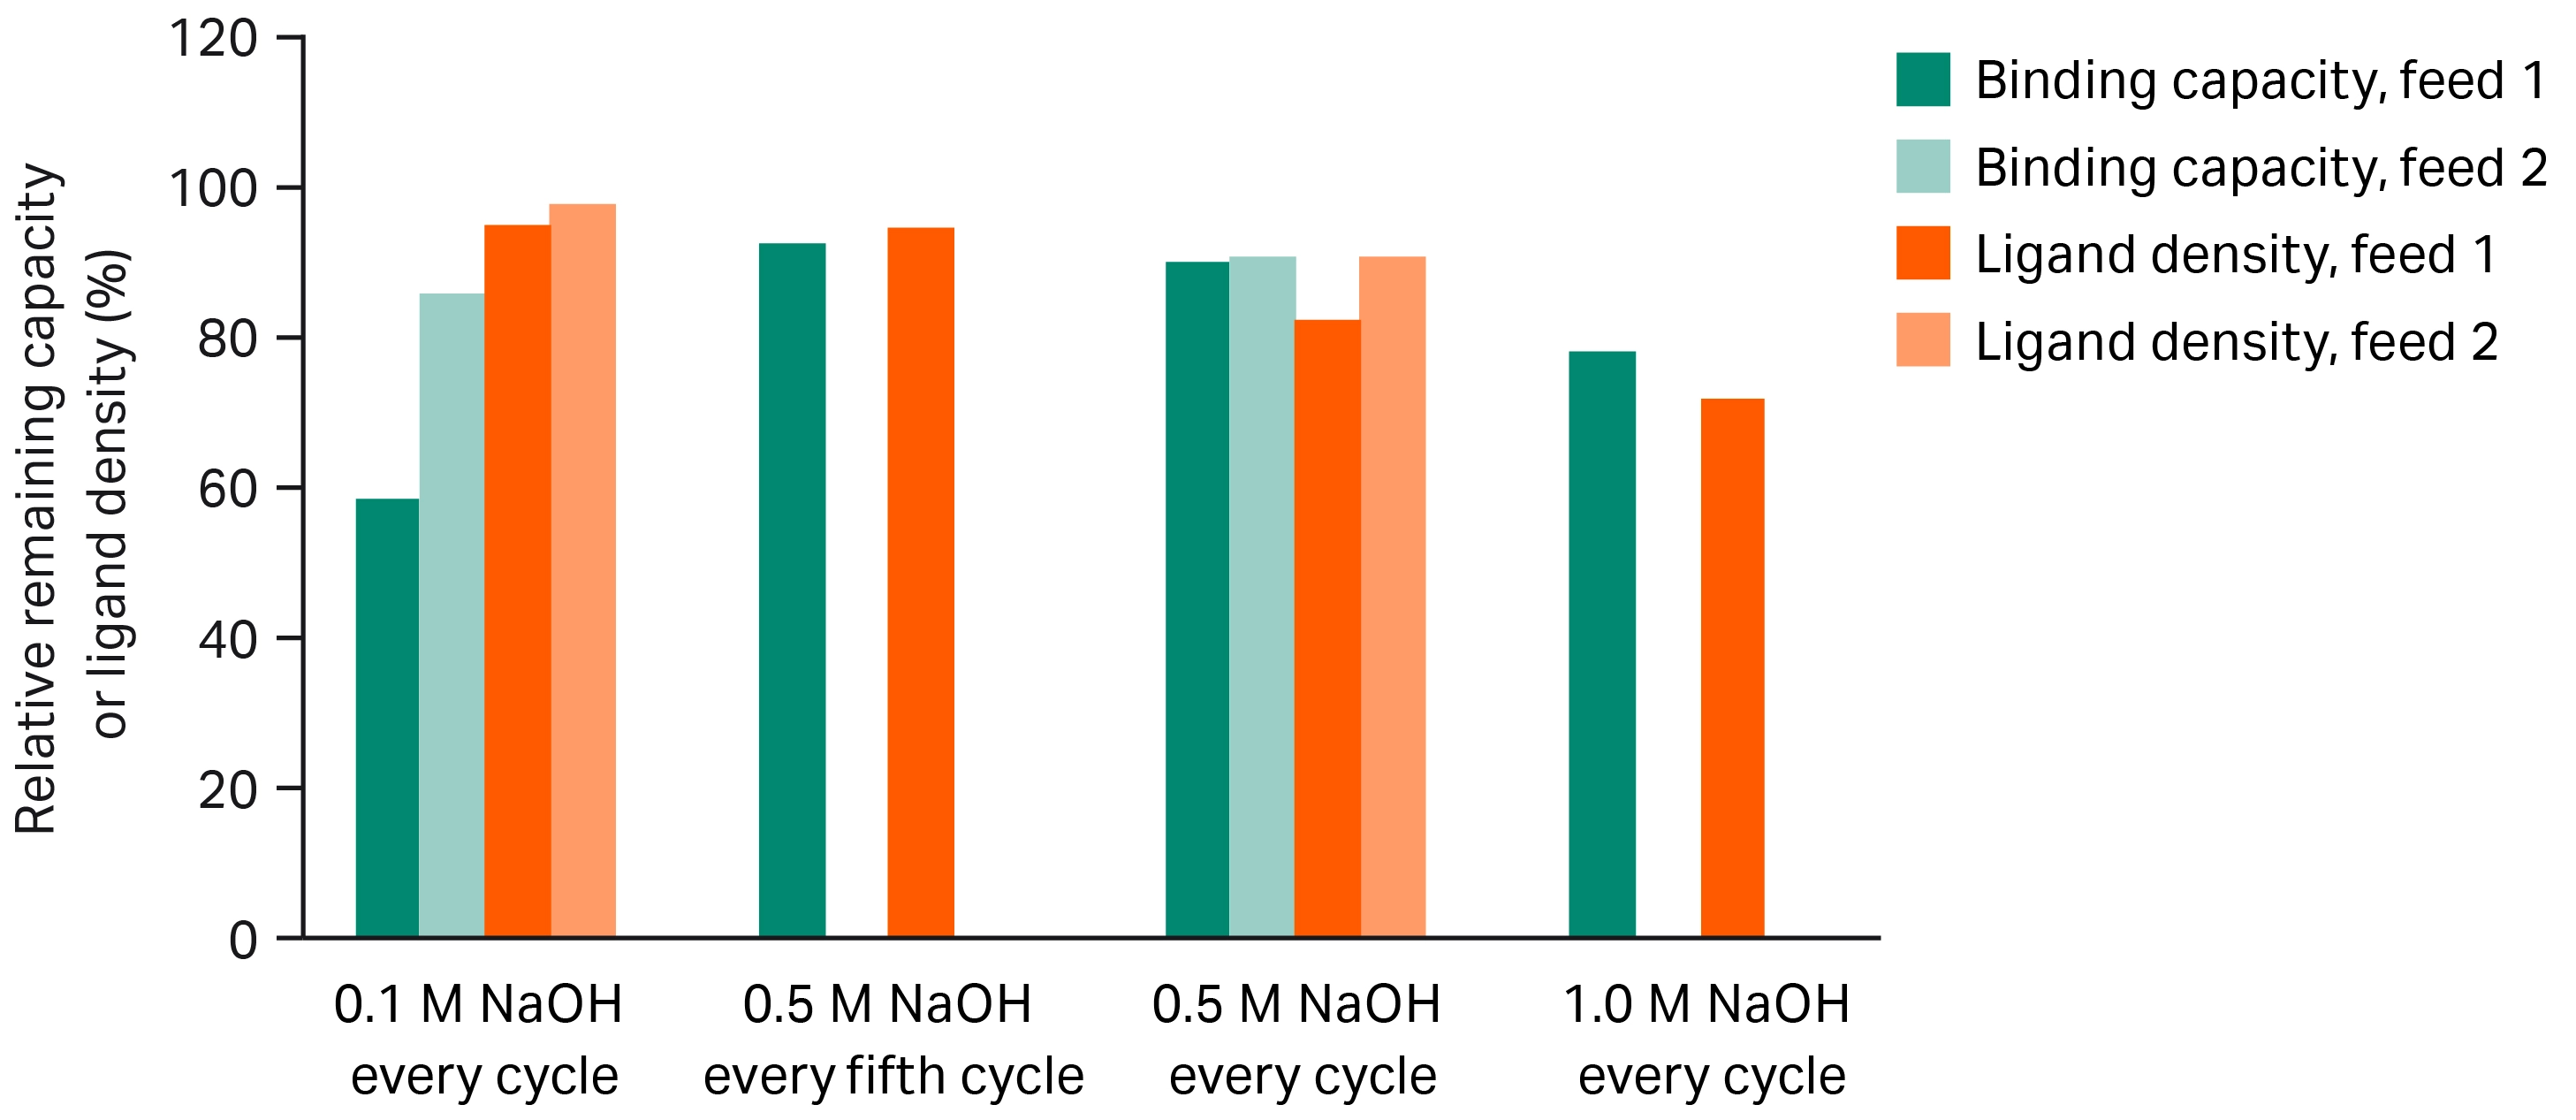
Fig 2. Relative remaining DBC of mAb and ligand density for four Tricorn™ 5/50 columns packed with MabSelect PrismA™ resin, cleaned with four different cleaning conditions and protocols up to 150 cycles.
We also performed a lifetime study with mAb from another CCH, following the same procedure as described above. Here, we performed CIP with 0.1 M and 0.5 M NaOH, respectively. During the new study (Fig 2), we observed different behavior (compared to the first CCH investigated) of the column cleaned with 0.1 M NaOH. A very small headspace and a lower loss of capacity is observed compared to the first study. Using 0.5 M NaOH the results are reproducible, However, the ligand loss for both CIP conditions is on a similar level to the first study. These differences could be feed-dependent and indicate that using a lower NaOH concentration than recommended is not sufficient in some cases.
Elution volumes
We collected and compared the eluates over the cycles, Figure 3. Variation in elution volume is negligible for columns treated with 0.5 M and 1.0 M NaOH in every cycle. A gradual increase of eluate volume is seen in the case of using 0.5 M NaOH every fifth cycle, in cycles excluding CIP, which then decreases again after the cycle with CIP.
For the column we treated with 0.1 M NaOH, the elution pool increased over time by more than 50%.
We compared elution volumes for the Tricorn™ columns packed with MabSelect PrismA™ resin loaded with mAb from two different CCH and cleaned with 0.1 M and 0.5 M NaOH. In this case, we see no differences between elution volumes over the lifetime for column cleaned with 0.5 M NaOH while elution volumes for different CHH and 0.1 M NaOH differ significantly.

Fig 3. Effect of different NaOH concentrations and protocols on elution pools shown for first and last cycle.
Effect on purity using different CIP conditions
We analyzed eluates from the lifetime study for impurities such as aggregates, protein A leakage, and HCP levels—all are relatively low and consistent.
Amount of protein remaining on the resin after CIP
We used chip electrophoresis for high-throughput analysis of residual protein impurities left on the resin after cleaning with different CIP conditions. The results from both PreDictor™ plates (previous study) and columns show that the main protein foulant is the mAb. It is represented by light (approx. relative molecular mass of Mr 30 000) and heavy (approx. Mr 60 000) chains in the gel image from the column study (Fig 4). The most intense bands represent the conditions where cleaning is less efficient.
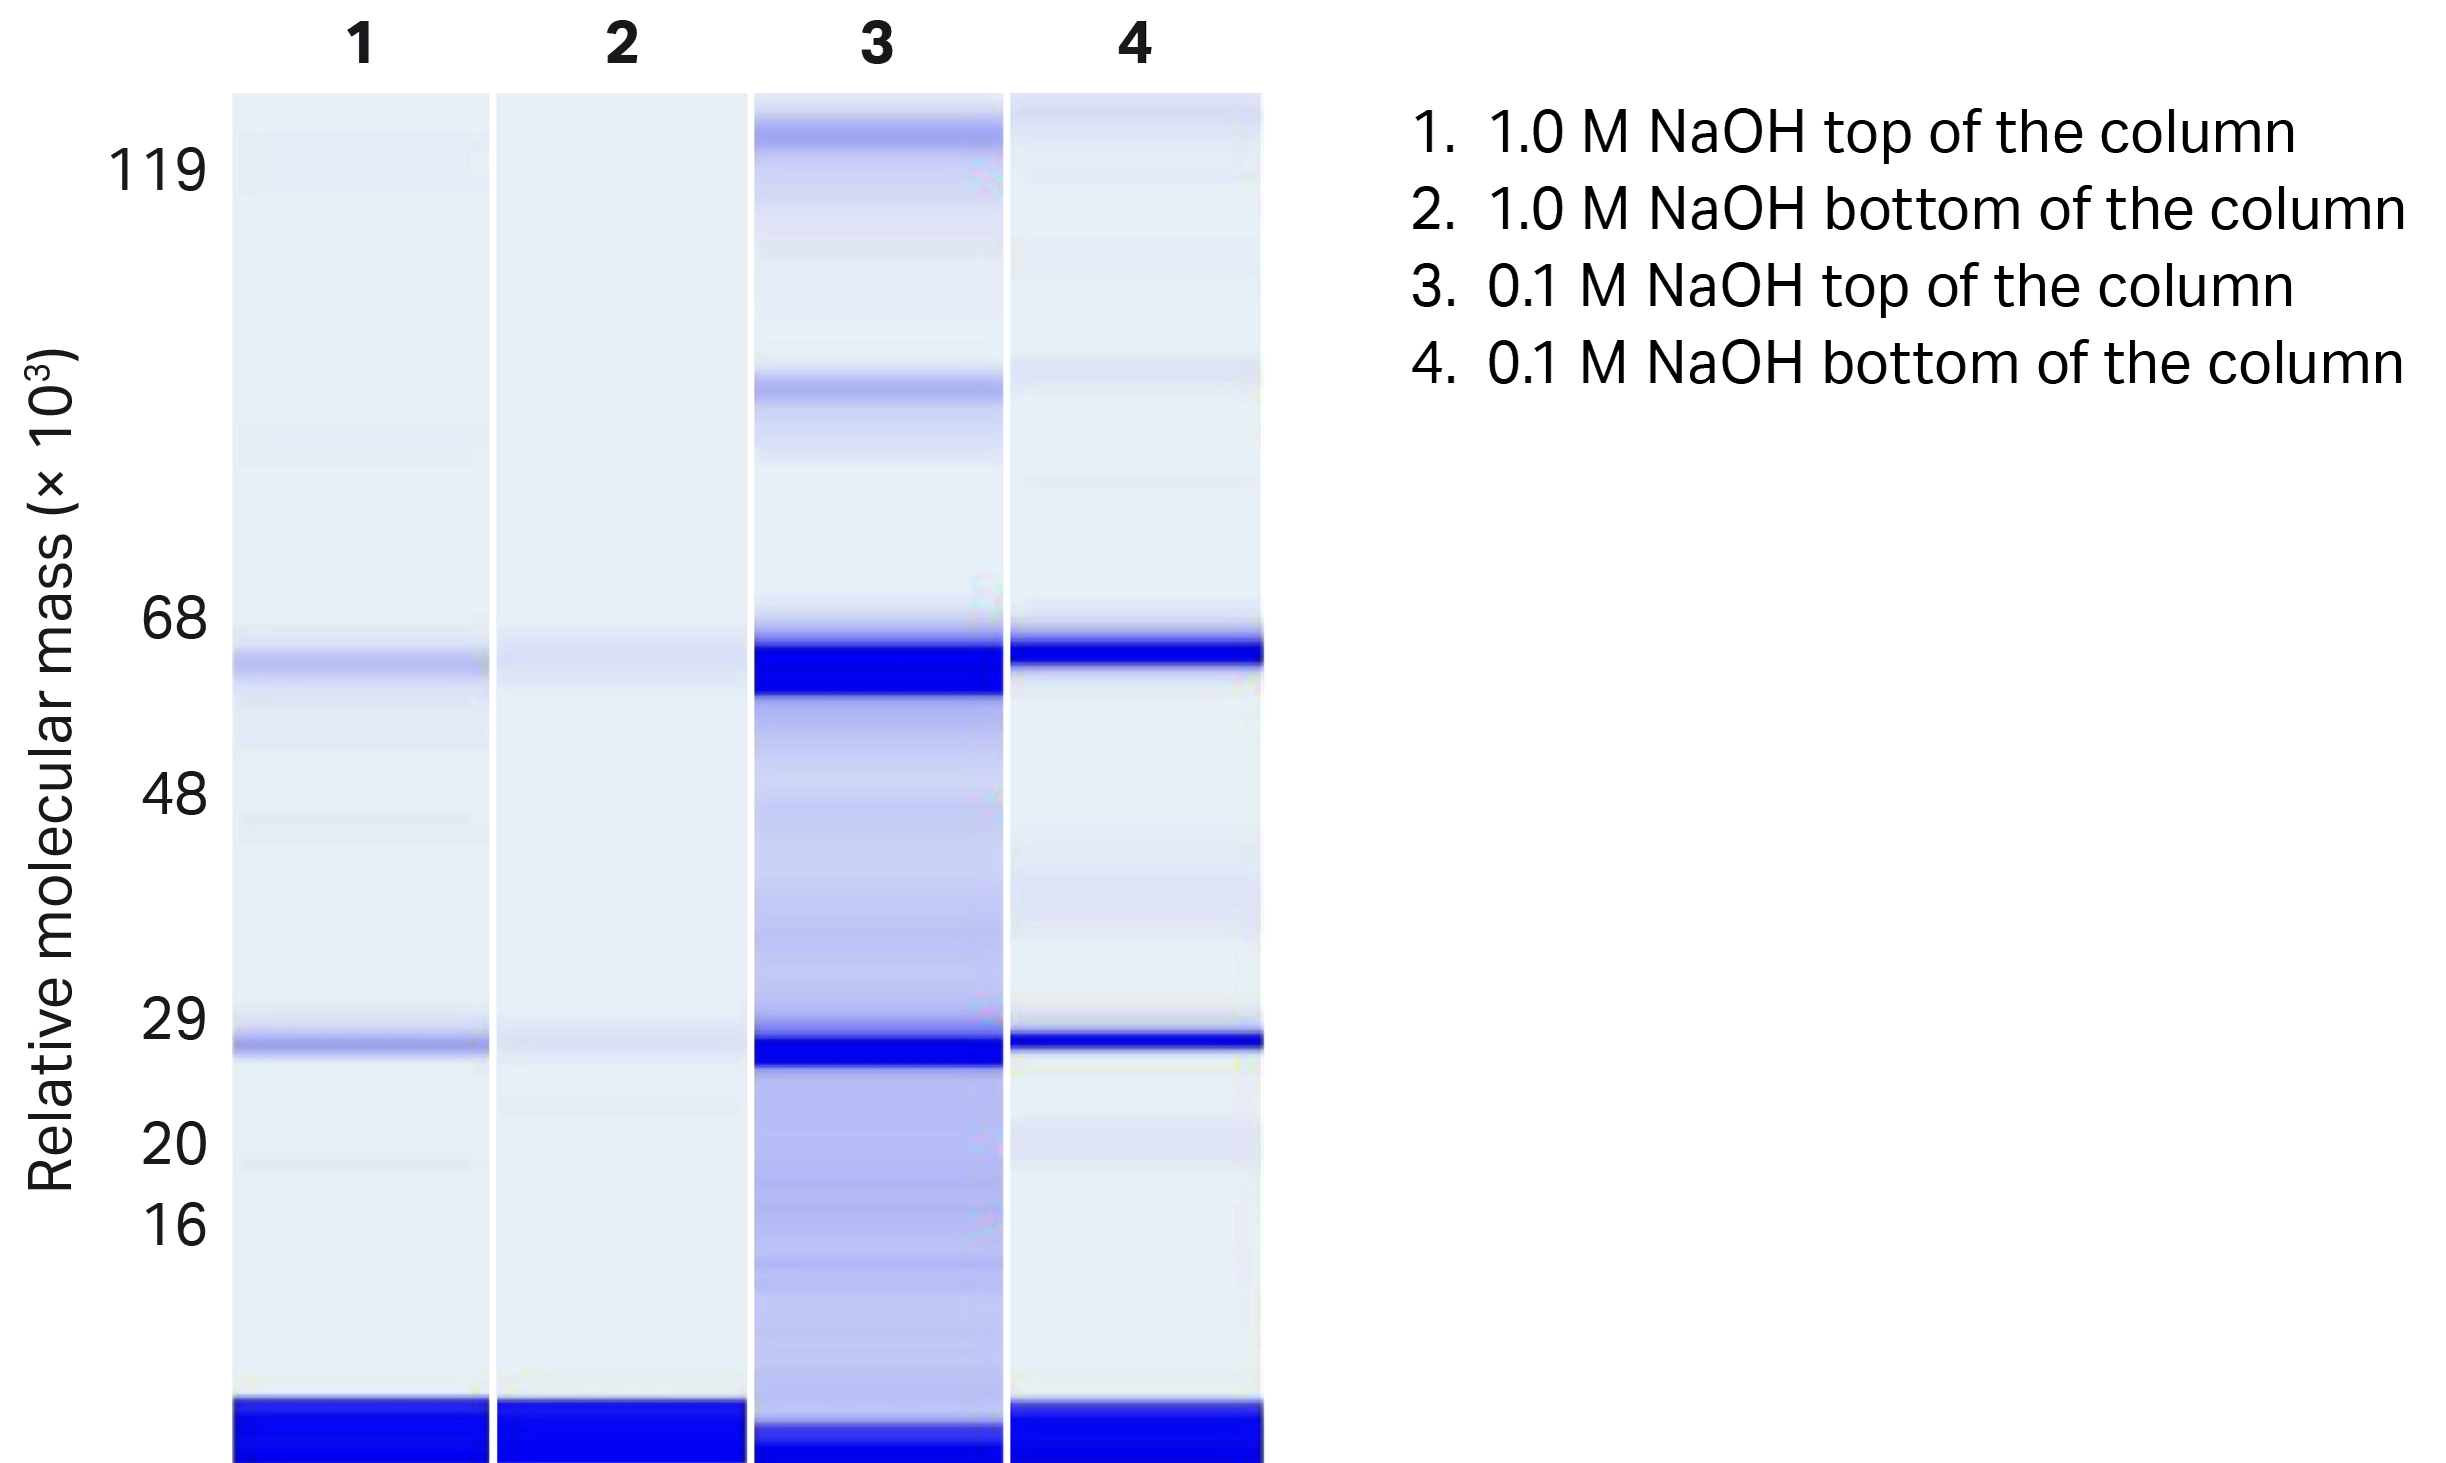
Fig 4. Chip electrophoresis gel image representing the mAb residuals left on MabSelect PrismA™ resin after cleaning with the lowest (0.1 M) and highest (1.0 M) studied NaOH concentration. Light chains are shown at Mr 25 000 to 30 000 and heavy chains at Mr 60 000 to 70 000 in the figure.
The results from chip electrophoresis show the same trend as results from the lifetime study. The column treated with the lowest NaOH concentration in CIP is most fouled. The amount of remaining protein on resin in both the top and bottom of the column decreases with increasing CIP concentration (Fig 5). Also, as expected, resin at the top of the column is more fouled than at the bottom.

Fig 5. Effect of different CIP conditions and protocols. The top and bottom of the columns were analyzed for remaining mAb after the last cleaning cycle.
Robust cleaning of MabSelect PrismA™ resin over 150 cycles using 0.5 M NaOH for CIP in every cycle
MabSelect PrismA™ resin cleaned with 0.5 M NaOH in every cycle, and with a contact time of 15 min, shows robust alkaline stability in terms of high remaining binding capacity. We do not observe breakthrough of mAb in the CCH loading phase over cycles, no matter which CCH is used (Fig 6). Also, the yield is higher than 95% over the lifetime study and negligible differences are seen in elution, strip, and CIP peaks. Improved bioburden control and longer resin lifetime of MabSelect PrismA™ resin should translate to good process economy. Therefore, the 0.5 M NaOH concentration is recommended for efficient MabSelect PrismA™ resin cleaning.

Fig 6. Overlay of the first and last load of CCH in the lifetime study with 0.5 M NaOH for CIP.
Conclusions
Here, we show a lifetime study verified on four MabSelect PrismA™ resin columns. Our main findings are:
- Use of 0.1 M NaOH is not sufficient for CIP in repeated cycling. CIP with a NaOH concentration below the recommended may result in a decrease in binding capacity due to fouling of your resin, not due to loss of ligand.
- Use of 0.5 M NaOH in every cycle is recommended for effective CIP of MabSelect PrismA™ resin. The elution profile (peak width) over the cycles is consistent when using 0.5 M NaOH or higher concentration in every cycle.
- Good correlation between CIP studies in the high-throughput format and columns.
RELATED DOCUMENTS
- Application note: A high-throughput study of sodium hydroxide efficiency for protein A resin
- Application note: Alkaline stability of protein A affinity resin
- How to use MabSelect PrismA™ for antibody purification
- Product information: MabSelect PrismA™ resin
Disclaimer
The results and conclusions presented in this application note are valid for this specific study only. Other study conditions could have significant impact on the outcome. The information contained herein is not representative of any specific claims or any relevant environment, health, and safety laws and regulations, including use authorization, product registration or application licensing, or similar legal requirements.
TR30023331, TR30061177, CY45963