Overview
Cytiva currently has three manufacturing sites for cell culture medium production. These sites are located in Logan, Utah (USA), Pasching, Austria, and Tuas, Singapore. As part of a strategy to increase cell culture media production capacity, dry powder manufacturing was upgraded at the Pasching site. The Pasching site was upgraded to a pin mill similar to the Logan and Tuas sites. See Table 1 for pin mill manufacturers. This study was conducted to compare the pin mills and overall dry powdered medium (DPM) manufacturing processes between sites.
Table 1. Powdered medium milling equipment at different manufacturing sites
| Site |
Centrifugal pin mill manufacturer |
Blender |
| Logan and Tuas | Sturtevant | Double cone |
| Pasching | Hosokawa | Conical screw |
Dry powdered medium milling process
Pin mills are impact mills that rely on the force caused by the continuous impact between the medium and grinding components to reduce the particle size of the starting raw chemicals. During the manufacturing process, individual raw chemicals are weighed per the specified formulation, grouped, and pre-blended prior to the milling process. This step controls particle size reduction of the formulation components. When milling is complete, the micronized powder undergoes a final blend to ensure homogeneity.
An overview of the process is shown in Figure 1.

Fig 1. Overview of the dry powder milling process at all three manufacturing sites.
Experimental design
Study plan
To demonstrate milling equivalency between the Logan and Pasching processes, an in-depth study compared the critical quality attributes (CQA) of complex, chemically defined DPM formulations manufactured at current good manufacturing practices (cGMP) scale. This study was designed to assess the overall impact each manufacturing process has on DPM functionality. It focused on CQAs that are likely to be influenced by raw chemicals, process, and scale.
Medium selection
It was not feasible to test every DPM formulation produced at the sites. Instead, critical manufacturing traits and worst-case scenarios were considered. Criteria for selection included formulation manufacturability, chemical composition, chemical interactions, medium classification, manufacturing scale, and blending mechanics (Table 2).
Two basal CHO media and two fed-batch supplements were selected as representative formulations. These proprietary animal-derived component-free and chemically defined formulations are from our off-the-shelf media library.
Table 2. Characteristics of selected cell culture media and supplements
| Medium |
Classification |
Manufacturability |
| Medium 1 | • Chemically defined • Complex base medium • Protein free • Does not contain growth factors |
• Order of addition • Chemical interactions • Contains surfactant (low melting point) • Trace levels |
| Medium 2 | • Chemically defined • Complex base medium • Contains growth factors |
• Order of addition • Chemical interactions |
| Supplement 1 | • Chemically defined • Complex feed supplement |
• High component concentrations • Chemical interactions • Heat generation • Contains surfactant (low melting point) |
| Supplement 2 | • Chemically defined • Feed supplement |
• Chemical interactions • Heat generation • Few components |
Raw material selection
Two approaches were taken. In the first approach, Medium 1 and both supplements were manufactured using the same raw material part numbers, but the chemicals were sourced locally. This approach represents a typical scenario encountered by bioprocess customers when ordering finished product from a specified manufacturing site. It reflects day-to-day operations.
In the second approach, Medium 2 manufactured at both sites shared the exact same raw material vendors and vendor lots. This allowed direct comparison of the pin mills and blenders used at the Logan and Pasching sites, eliminating potential influence by raw material variability.
Testing regimen
Critical quality attributes were compared by examining the physical, chemical, and biological characteristics of DPM manufactured at the sites. The physical and chemical characteristics are influenced mostly by the milling and blending processes. The biological characteristics reflect the robustness of the entire manufacturing process.
Sampling plan
Following existing manufacturing standard operating procedures (SOP) as a guide, representative samples from each batch were collected at the beginning, middle, and end of blender discharge. The batch sizes evaluated for each formulation are summarized in Table 3.
Table 3. Batch sizes of media and fed-batch supplements
| Product |
Manufacturing site |
Scale (kg) |
Lot ID |
| Medium 1 | Pasching |
105 |
P1 |
| 800 | P2 | ||
| Logan | 7 | L1 | |
| 130 | L2 | ||
| 800 | L3 | ||
| Supplement 1 | Pasching |
105 |
P3 |
| 800 | P4 | ||
| Logan | 10 | L4 | |
| 130 | L5 | ||
| 800 | L6 | ||
| Supplement 2 | Pasching |
105 |
P5 |
| 300 | P6 | ||
| Logan | 7 | L7 | |
| 150 | L8 | ||
| 800 | L9 | ||
| Medium 2 | Pasching | 250 | P7 |
| Logan | 250 | L10 |
Following collection and submission to the appropriate testing labs, samples were assayed in duplicate (Fig 2).

Fig 2.Sampling plan for powdered media and supplement formulations.
Analytical testing
Table 4 provides an overview of the analytical testing performed on each batch of medium and supplement. All batches used in the study were manufactured according to site-specific procedures and met QC release criteria.
Table 4. Analytical testing performed
| Characteristic |
Influencer |
Assessment |
Method/Reference |
| Physical | • Milling • Raw chemicals |
• Appearance/color • Particle size distribution (PSD) • Bulk density • Angle of repose • Filterability • Moisture (CoA) • Bioburden (CoA) |
• Spectrophotometer • Laser diffraction • SS Pharma washdown volumeter • ASTM C 144-00 • Sartorius Zero-T • Sartorius Mark 3 analyzer • USP 61 |
| Chemical | • Milling • Blending |
• Amino acids • Vitamin • Trace metals • pH (CoA) • Osmolality (CoA) |
• Amino acid analyzer • HPLC • ICP-MS • Potentiometric • Freeze point depression |
| Biological | • Milling • Blending • Raw chemicals |
• Cell growth • Protein production • Protein product quality – aggregates, charge variants, glycan |
• Straight batch, fed batch • IgG production • UPLC |
CoA is certificate of analysis; ICP-MS is inductively coupled plasma-mass spectrometry.
Comparison of critical quality attributes
Physical characteristics
A comparison of physical characteristics was made between multiple batches of DPM manufactured at the Logan and Pasching sites to identify any differences in the appearance, particle size, flowability, or filterability of the micronized powder.
The physical characteristics of powdered media could potentially affect several unit steps throughout a cGMP commercial process. These steps include incoming raw material inspection and workability of the media powder during the hydration and sterile filtration processes. As such, it is important to understand any physical differences between DPM manufactured at the different sites.
An overview of selected analyses is provided here, as well as a summary of the results for all 4 formulations. Data for Medium 1 are shown here; see the tabs at the bottom of the page for data on the other 3 formulations.
Appearance and color
Color comparison using spectrophotometry as well as visual inspection showed slight variations in color for some batches of the powder media. Slight variations were noted between Logan and Pasching batches when comparing each sample to a reference standard using a HunterLab spectrophotometer.
Variations in color are likely attributed to specific raw chemicals. Subsequent cell culture performance evaluations suggest that slight variation in color does not negatively affect biological performance of the media and supplements.
Moisture and bioburden
Moisture and bioburden results were obtained by reviewing the lot-specific in-process testing and QC release testing for each medium and supplement batch.
Moisture content generally has a direct impact on bulk density. However, it also provides an indication of environmental and process controls during the storage and manufacturing process. Bioburden data, used to determine microbial load of the finished product, can also be used as an indicator of the cleanliness of a manufacturing process (e.g., raw materials, equipment, environmental controls).
For all batches of every formulation tested at both sites, collected data were within allowable limits for both moisture and bioburden. Table 5 displays the results for Medium 1.
Table 5. Physical characteristics of Medium 1. Average of duplicate samples
| Manufacturing site |
Scale (kg) |
Lot ID |
Moisture (%) |
Bioburden (CFU/g) |
| Specification: < 5% | Specification: < 100 | |||
| Pasching | 105 |
P1 |
1.16 |
0 |
| 800 | P2 | 1.49 | 1 | |
| Logan | 7 | L1 | 0.52 | 0 |
| 130 | L2 | 0.38 | 0 | |
| 800 | L3 | 0.29 | 2 |
Particle size distribution
Particle size, bulk density, and flowability are important to the workability of the micronized powder. Because the particle size or shape of the pre-blended material cannot typically be modified, the milling process is critical in controlling particle size distribution (PSD). PSD, in turn, directly correlates to bulk density and flowability characteristics.
Data collected for each medium and feed formulation show slight variation between manufacturing sites for PSD and bulk density. However, as the chemical and biological data later confirm, this variability does not negatively affect cell culture performance and can likely be attributed to inherent differences between the specific pin mills used. PSD results for Medium 1 are displayed in Figure 3.

Fig 3. Medium 1. Particle size distribution. Average of duplicate samples.
Flowability, determined by calculating the angle of repose for the micronized powder, showed no substantial differences between media formulations manufactured at either site.
Filterability
No substantial differences between manufacturing sites were observed for 0.2 μm filtration throughput or flow decay (constant pressure). Figure 4 shows results for Medium 1.

Fig 4. Medium 1. Throughput versus time for samples subjected to 0.2 µm filtration. Filtration data represents 0.2 µm glass fiber (GF) pre-filtration, and 0.2 µm PVDF final filtration. Average of duplicate samples.
Chemical characteristics
Amino acids
Intra- and inter-batch homogeneity were determined by comparing relative standard deviation (RSD) results within and across multiple batches. Analytical data were compared to determine the deviation between the Pasching and Logan manufacturing sites. Representative samples from each batch were hydrated according to current protocols and sampled in duplicate.
Samples were assayed using HPLC. cGMP manufacturing batches were considered homogeneous and chemically equivalent if RSD values were within ± 10%.
All batches of media and supplements manufactured at either site met the specified target (RSD ± 10%) for the selected amino acids. Analytical data clearly demonstrate chemical equivalence and blend homogeneity between manufacturing sites.
Figure 5 shows Medium 1 results for intra- and inter-batch homogeneity of amino acids.


Fig 5. Medium 1 homogeneity of amino acids. (A) intra-batch, (B) inter-batch. Average of duplicate samples.
Lot-specific analytical data were also compared to the theoretical levels specified by each formulation to calculate percent recovery. This allows assessment of formulation accuracy and process robustness. To demonstrate a high level of confidence in the overall manufacturing process for each site, a recovery of 90%–110% of theoretical values for amino acids was targeted.
Recovery of all amino acids was within 90%–110% with little variability between manufacturing sites. As with the product homogeneity results, formulation accuracy data demonstrates chemical equivalence between the Logan and Pasching sites. Results for Medium 1 are displayed in Figure 6.

Fig 6. Medium 1 recovery of amino acids at Logan and Pasching sites. Average of duplicate samples.
Vitamins
Intra- and inter-batch homogeneity were determined by comparing relative standard deviation (RSD) results within and across multiple batches, as was done for amino acids. Samples were assayed using HPLC. cGMP manufacturing batches were considered homogeneous and chemically equivalent if RSD values were within ± 15%.
All batches of media and supplements manufactured at either site met the specified target (RSD ± 15%) for the selected vitamins. Analytical data clearly demonstrates chemical equivalence and blend homogeneity between manufacturing sites.
Figure 7 displays Medium 1 results for intra- and inter-batch homogeneity of vitamins.


Fig 7. Medium 1 homogeneity of vitamins. (A) intra-batch, (B) inter-batch. Average of duplicate samples.
A percent recovery of 85%–115% of theoretical values for vitamins was targeted. The range was higher than for amino acids, because there is much more assay variability with this test. This level of variability could be attributed to the relatively low concentrations often approaching detectability limits. The closer the value to detectability, the more variable the results.
Recovery of all vitamins was within the target range. As with the product homogeneity results, formulation accuracy data demonstrates chemical equivalence between the Logan and Pasching sites. Results for Medium 1 are shown in Figure 8.

Fig 8. Medium 1 recovery of vitamins at Logan and Pasching sites. Average of duplicate samples.
Metals
Intra- and inter-batch homogeneity were determined by comparing relative standard deviation (RSD) results within and across multiple batches, as was done for amino acids and vitamins. Samples were assayed using ICP-MS. cGMP manufacturing batches were considered homogeneous and chemically equivalent if RSD values were within ± 15%.
All batches of media and supplements manufactured at either site met the specified target (RSD ± 15%) for the selected vitamins. Analytical data clearly demonstrates chemical equivalence and blend homogeneity between manufacturing sites.
Figure 9 displays Medium 1 results for intra- and inter-batch homogeneity of metals.


Fig 9. Medium 1 homogeneity of metals. (A) intra-batch, (B) inter-batch. Average of duplicate samples.
A recovery of 85%–115% of theoretical values for metals was targeted. The range was higher than for amino acids, because there is much more assay variability with this test. This level of variability could be attributed to the relatively low concentrations often approaching detectability limits. The closer the value to detectability, the more variable the results.
Recovery of all metals was within the target range. As with the product homogeneity results, formulation accuracy data demonstrates chemical equivalence between the Logan and Pasching sites. Results for Medium 1 are shown in Figure 10.

Fig 10. Medium 1 recovery of metals at Logan and Pasching sites. Average of duplicate samples.
Biological characteristics
Ultimately, the purpose of cell culture media and feeds is to provide a suitable environment for optimal cell growth and production of a target molecule. When determining product equivalence, cell culture performance should be considered the most critical criterion to assess whether differences in manufacturing sites or processes have a substantial impact.
Cell culture performance
Medium 1 and both supplements were evaluated in a fed-batch process. To assess the comparability of the medium and feed batches, samples were evaluated in triplicate 125 mL shaker flasks. The study matrix varied only one condition, while the other two conditions used a previously QC released lot. Additionally, two controls were used to confirm validity of the growth assay.
A DG-44 derived cell line that expresses IgG was used in a 11-day fed-batch system. IgG productivity samples were collected on days 4–11. Fed-batch growth data were obtained.
All growth curves are given as a measure of viable cell densities. Growth curves for Medium 1 (Fig 11) and both supplements displayed similar trends over a 11-day period, with DG44 growth peaking at approximately day 6 and comparable cell viabilities.

Fig 11. Medium 1. DG44 growth kinetics is given as a measure of viable cell densities. Percent viability is shown on the right. Average of triplicate samples.
Slight variation was noted for some test conditions but was within the expected variation of 20%–25% for the shaker flask assay used. Total IgG expression for each condition over the course of days 4–11 in fed batch are displayed in Figure 12.

Fig 12. Total IgG expression for Medium 1 conditions over the course of days 4 through 11 in fed batch.
Protein quality
Samples from each test condition were collected on day 12 of the fed-batch study. Samples were purified using a protein A spin column.
Protein quality and charge variants were assessed by analyzing the samples for aggregates, monomers, and fragments using UPLC equipped with a UV detector in a size exclusion column. Results for Medium 1 are shown in Figure 13.

Fig 13. Aggregate profiles for Medium 1 batches. Single injections.
Analyses of charge variants and glycan forms in IgG production were also performed. Results for Medium 1 are presented in Figures 14 and 15, respectively.
Analysis of protein quality attributes shows similar results between the Logan and Pasching manufacturing sites for all medium and feed conditions evaluated.

Fig 14. Charge variants for Medium 1 batches. Single injections.

Fig 15. Glycan distribution for Medium 1 batches. Single injections.
Analysis of protein quality attributes shows equivalency between the Logan and Pasching sites.
Conclusions
In this in-depth equivalency study, an assessment of the physical, chemical, and biological characteristics of representative complex media and feeds was made. Based on the findings, cGMP scale batches of complex media and feeds, representing a wide range of batch sizes, can be produced at the Logan and Pasching manufacturing sites with equivalent results. Although data are not shown here for the Tuas site, results are expected to be similar to those for the Logan site since both sites use the same milling equipment.
Assessment of physical characteristics showed inherent variation for color, particle size distribution, and bulk density. Considering all 4 formulations, mean particle sizes for Logan and Pasching batches were 69.2 μm and 50.4 μm, respectively. Although there is some inherent variation in the physical characteristics between powdered media manufactured at each site, this variation is likely attributed to differences in site-specific pin mill manufacturers. It is important to note that cell culture performance is not negatively affected.
Chemical analysis of complex CHO media and feed supplements demonstrates equivalence and scalability between both sites. Specifically, amino acids for all batches were within ± 10% RSD and vitamins and elemental metals were within ± 15% RSD.
Cell growth, IgG production, and protein quality attributes were shown to be comparable between the Logan and Pasching manufacturing sites for all media and feeds evaluated.
About our cell culture media production
We are a leading manufacturer of dry powdered medium (DPM) formulations used throughout the bioprocessing industry for a wide range of cell culture applications. With global manufacturing capabilities in three major regions of the world—USA, Austria, and Singapore—we offer the flexibility and assurance of supply to meet customer demands. DPM formulations are manufactured in accordance with cGMP guidelines and follow ISO 9001:2000 certified processes. Each site has been designed with strict environmental controls, dedicated animal-derived component-free manufacturing areas, and robust processes to ensure that product consistency, scalability, and reproducibility are achieved.
Our vision for cell culture media manufacturing is to globally harmonize manufacturing processes at all sites. We have invested $25 million in capacity, quality, and capability improvements, plus an additional $10 million to upgrade the Pasching site, to address the following categories:
- Global quality management systems
- Manufacturing technologies
- Global raw materials
- Redundant manufacturing capacity
- Security of supply
- Inventory management (raw and finished goods)
- Capacity utilization
Contact us for more information about custom cell culture media production.
Supplement 1
The experimental design was conducted according to the details provided in the article. Batch sizes are listed in Table 6.
Table 6. Batch sizes of Supplement 1
| Product |
Manufacturing site |
Scale (kg) |
Lot ID |
| Supplement 1 | Pasching |
105 |
P3 |
| 800 | P4 | ||
| Logan | 10 | L4 | |
| 130 | L5 | ||
| 800 | L6 |
Analytical testing was performed according to the details provided in the article. Results for Supplement 1 are summarized here.
Comparison of critical quality attributes
Physical characteristics
A comparison of physical characteristics was made between the batches of Supplement 1 manufactured at the Logan and Pasching sites to identify any differences in the appearance, particle size, flowability, or filterability of the micronized powder.
Appearance and color
Color comparison using spectrophotometry as well as visual inspection showed slight variations in color for some batches of the powder media.
Variations in color are likely attributed to specific raw chemicals. Subsequent cell culture performance evaluations suggest that slight variation in color does not negatively affect biological performance.
Moisture and bioburden
Moisture and bioburden results were obtained by reviewing the lot-specific in-process testing and QC release testing for each batch of Supplement 1.
Collected data for the Supplement 1 batches manufactured at the Pasching and Logan sites were within allowable limits for both moisture and bioburden.
Particle size distribution
Data collected for each Supplement 1 batch shows slight variation between manufacturing sites for PSD and bulk density. However, as the chemical and biological data later confirm, this variability does not negatively affect cell culture performance and can likely be attributed to inherent differences between the specific pin mills used. PSD results for Supplement 1 are displayed in Figure 16.
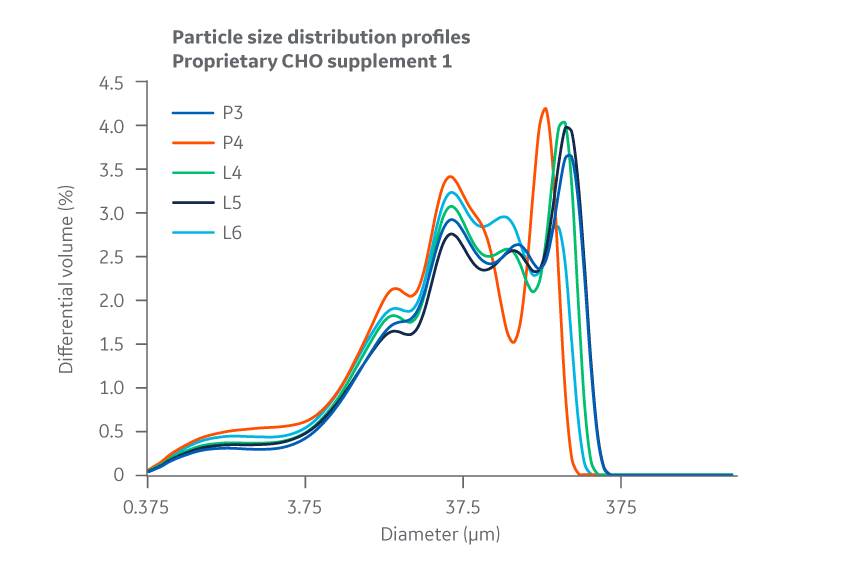
Fig 16. Supplement 1. Particle size distribution. Average of duplicate samples.
Flowability, determined by calculating the angle of repose for the micronized powder, showed no substantial differences between Supplement 1 formulations manufactured at either site.
Filterability
No substantial differences between manufacturing sites were observed for 0.2 μm filtration throughput or flow decay (constant pressure). Figure 17 shows results for Supplement 1.
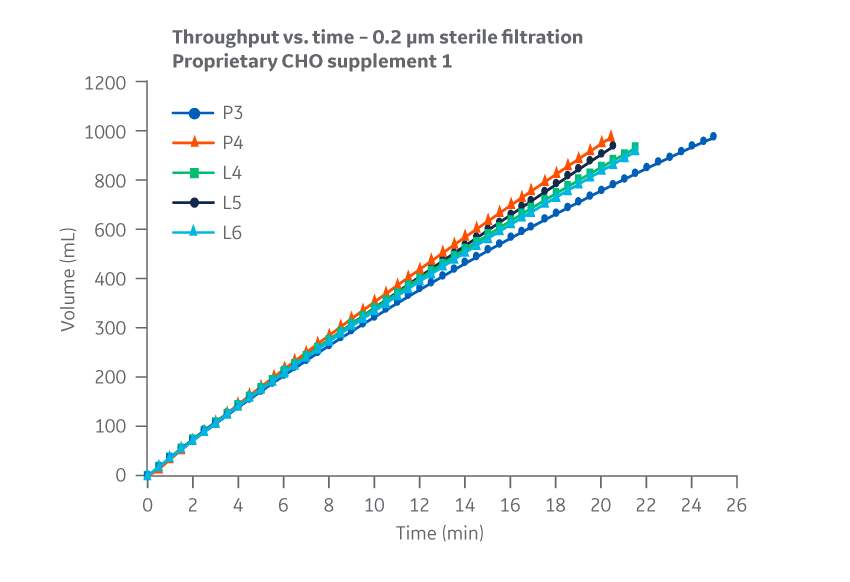
Fig 17. Supplement 1. Throughput versus time for samples subjected to 0.2 µm filtration. Filtration data represents 0.2 µm glass fiber (GF) pre-filtration, and 0.2 µm PVDF final filtration. Average of duplicate samples.
Chemical characteristics
Amino acids
Intra- and inter-batch homogeneity were determined by comparing relative standard deviation (RSD) results within and across multiple batches. Analytical data were compared to determine the deviation between the Pasching and Logan manufacturing sites. Representative samples from each batch were hydrated according to current protocols and sampled in duplicate.
Samples were assayed using HPLC. cGMP manufacturing batches were considered homogeneous and chemically equivalent if RSD values were within ± 10%.
Batches of Supplement 1 manufactured at either site met the specified target (RSD ± 10%) for the selected amino acids. Analytical data clearly demonstrate chemical equivalence and blend homogeneity between manufacturing sites.
Figure 18 shows Supplement 1 results for intra- and inter-batch homogeneity of amino acids.
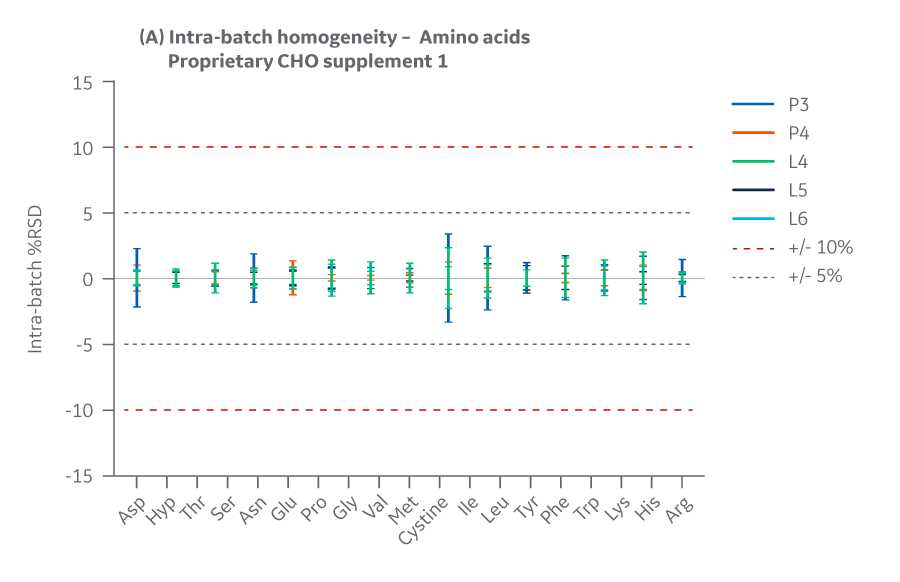
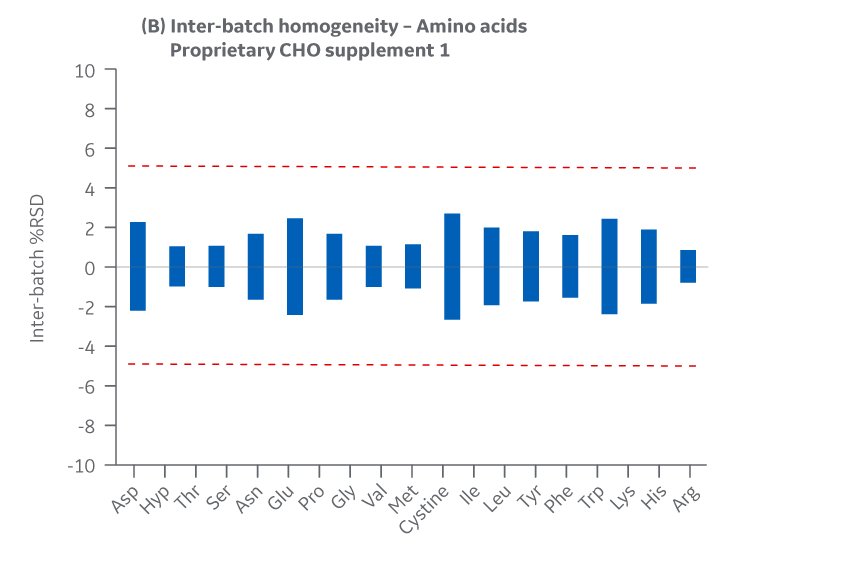
Fig 18. Supplement 1. Homogeneity of amino acids. (A) intra-batch, (B) inter-batch. Average of duplicate samples.
Lot-specific analytical data were also compared to the theoretical levels specified by eachformulation to calculate percent recovery. To demonstrate a high level of confidence in the overall manufacturing process for each site, a recovery of 90%–110% of theoretical values for amino acids was targeted.
Recovery of all amino acids was within 90%–110% with little variability between manufacturing sites. As with the product homogeneity results, formulation accuracy data demonstrates chemical equivalence between the Logan and Pasching sites. Results for Supplement 1 are displayed in Figure 19.
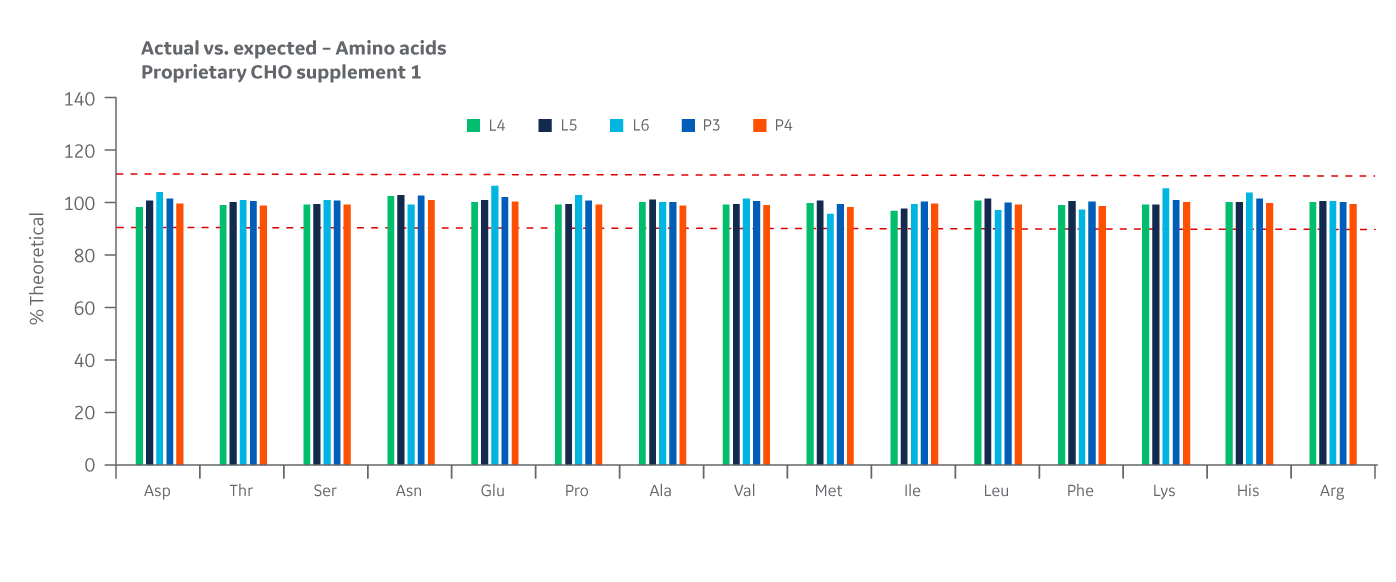
Fig 19. Supplement 1 recovery of amino acids at Logan and Pasching sites. Average of duplicate samples.
Vitamins
Intra- and inter-batch homogeneity were determined by comparing relative standard deviation (RSD) results within and across multiple batches, as was done for amino acids. Samples were assayed using HPLC. cGMP manufacturing batches were considered homogeneous and chemically equivalent if RSD values were within ± 15%.
The Supplement 1 batches manufactured at either site met the specified target (RSD ± 15%) for the selected vitamins. Analytical data clearly demonstrates chemical equivalence and blend homogeneity between manufacturing sites.
Figure 20 displays Supplement 1 results for intra- and inter-batch homogeneity of vitamins.
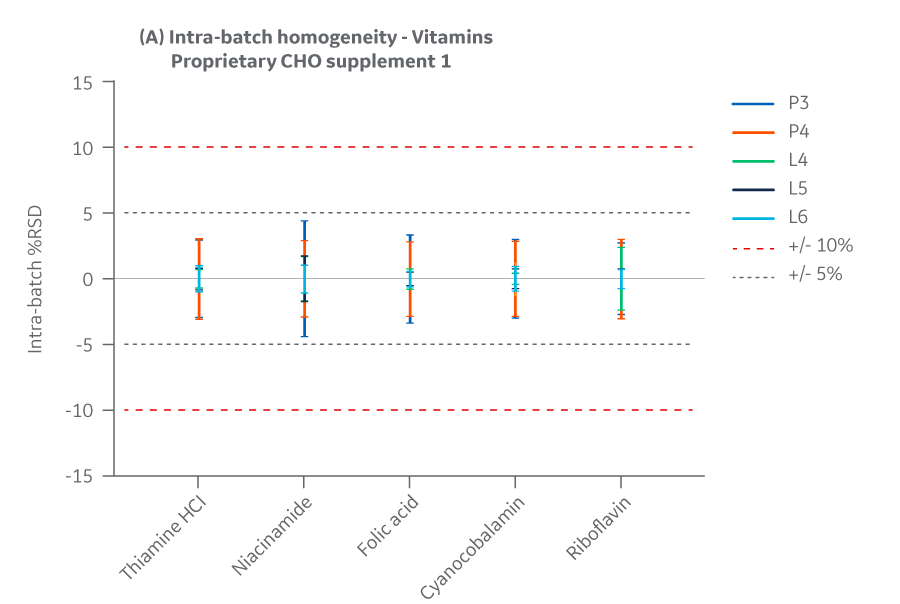
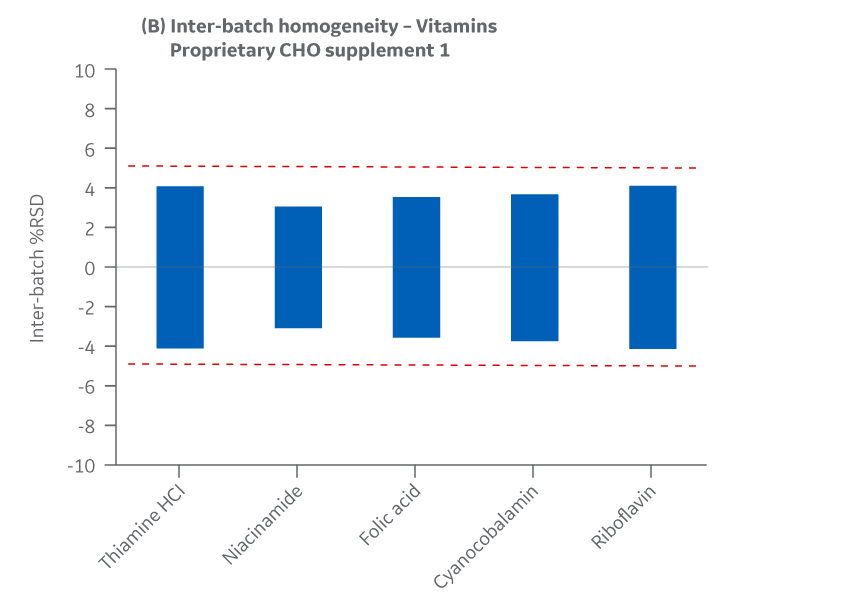
Fig 20. Supplement 1 homogeneity of vitamins. (A) intra-batch, (B) inter-batch. Average of duplicate samples.
A percent recovery of 85%–115% of theoretical values for vitamins was targeted.
Recovery of all vitamins was within the target range. As with the product homogeneity results, formulation accuracy data demonstrates chemical equivalence between the Logan and Pasching sites. Results for Supplement 1 are shown in Figure 21.
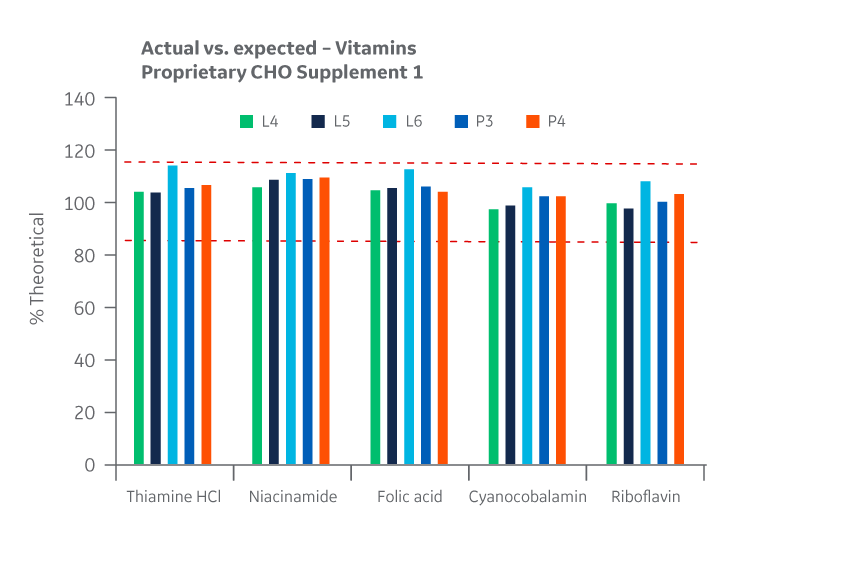
Fig 21. Supplement 1 recovery of vitamins at Logan and Pasching sites. Average of duplicate samples.
Metals
Intra- and inter-batch homogeneity were determined by comparing relative standard deviation (RSD) results within and across multiple batches, as was done for amino acids and vitamins. Samples were assayed using ICP-MS. cGMP manufacturing batches were considered homogeneous and chemically equivalent if RSD values were within ± 15%.
All Supplement 1 batches manufactured at either site met the specified target (RSD ± 15%) for the selected vitamins. Analytical data clearly demonstrates chemical equivalence and blend homogeneity between manufacturing sites.
Figure 22 displays Supplement 1 results for intra- and inter-batch homogeneity of metals.
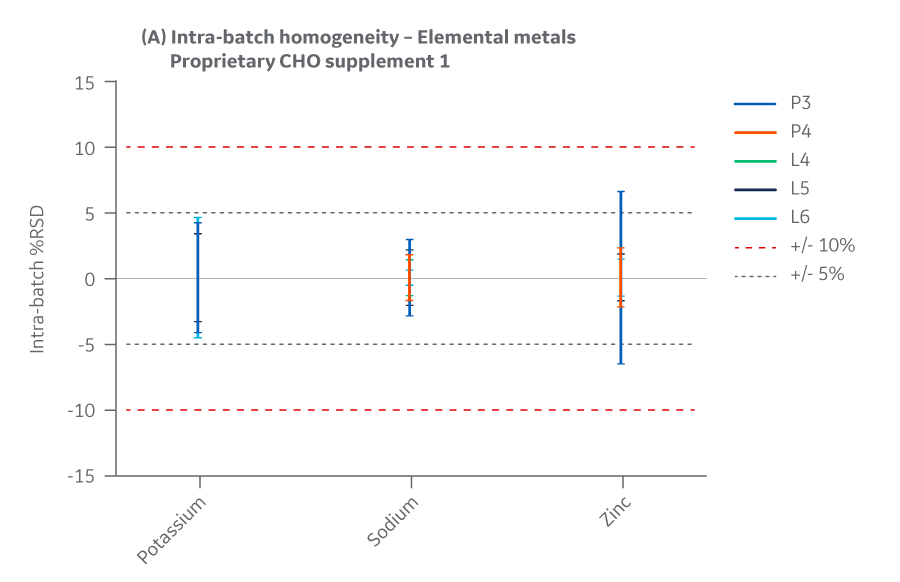
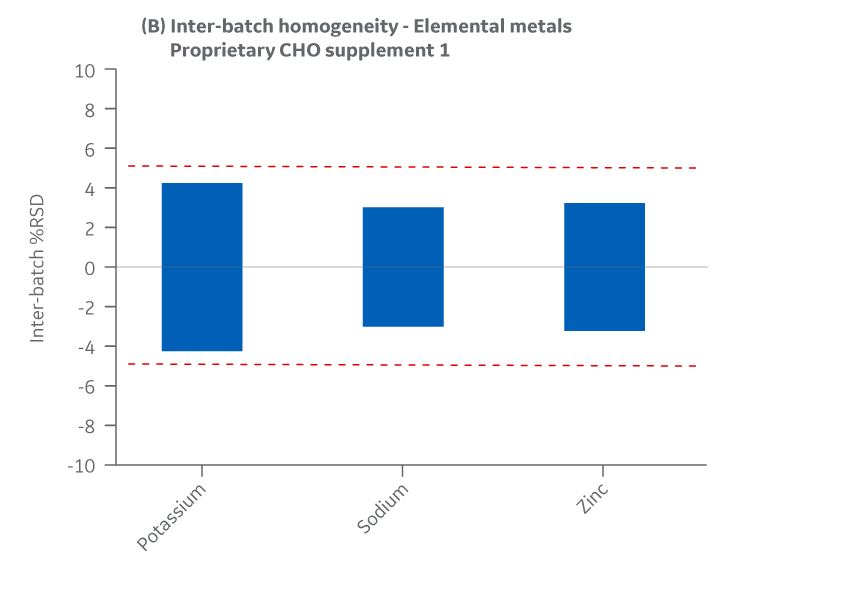
Fig 22. Supplement 1 homogeneity of metals. (A) intra-batch, (B) inter-batch. Average of duplicate samples.
A recovery of 85%–115% of theoretical values for metals was targeted.
Recovery of all metals was within the target range. As with the product homogeneity results, formulation accuracy data demonstrates chemical equivalence between the Logan and Pasching sites. Results for Supplement 1 are shown in Figure 23.
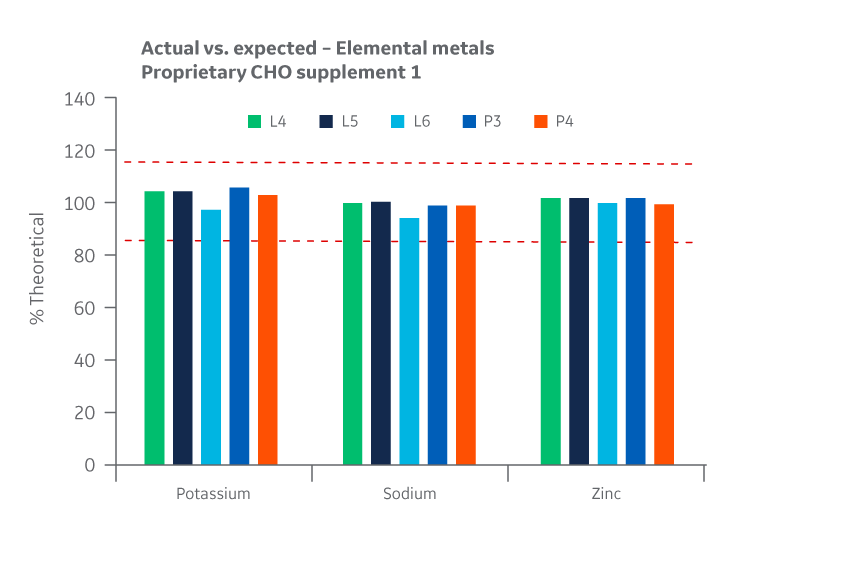
Fig 23. Supplement 1 recovery of metals at Logan and Pasching sites. Average of duplicate samples.
Biological characteristics
Cell culture performance
Supplement 1 was evaluated in a fed-batch process. To assess the comparability of the feed batches, samples were evaluated in triplicate 125 mL shaker flasks. The study matrix varied only one condition, while the other two conditions used a previously QC released lot. Additionally, two controls were used to confirm validity of the growth assay.
A DG-44 derived cell line that expresses IgG was used in a 11-day fed-batch system. IgG productivity samples were collected on days 4–11. Fed-batch growth data were obtained.
All growth curves are given as a measure of viable cell densities. Growth curves for Supplement 1 (Fig 24) displayed similar trends over a 11-day period, with DG44 growth peaking at approximately day 6 and comparable cell viabilities.
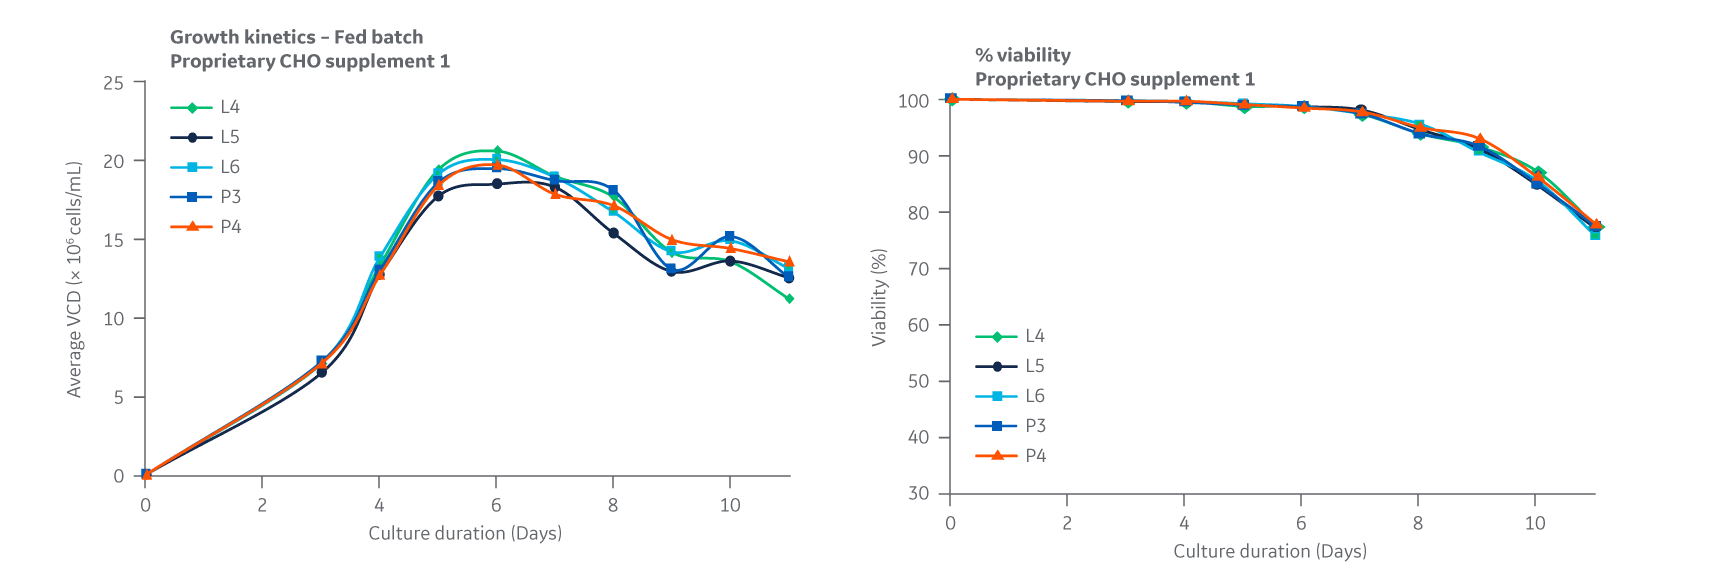
Fig 24. Supplement 1. DG44 growth kinetics is given as a measure of viable cell densities. Percent viability is shown on the right. Average of triplicate samples.
Slight variation was noted for some test conditions but was within the expected variation of 20%–25% for the shaker flask assay used. Total IgG expression for each condition over the course of days 4–11 in fed batch are displayed in Figure 25.
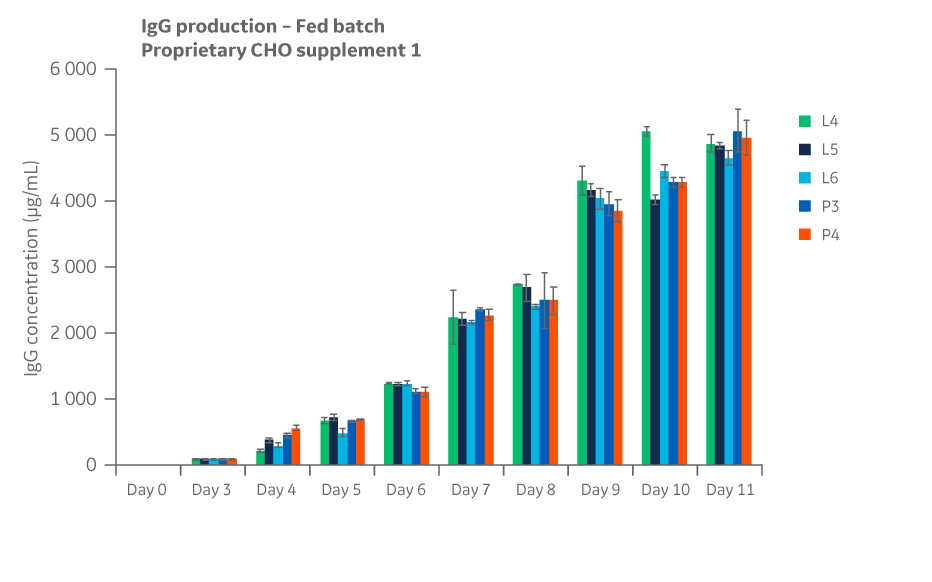
Fig 25. Total IgG expression for Supplement 1 conditions over the course of days 4 through 11 in fed batch.
Protein quality
Samples from each test condition were collected on day 12 of the fed-batch study. Samples were purified using a protein A spin column.
Protein quality and charge variants were assessed by analyzing the samples for aggregates, monomers, and fragments using UPLC equipped with a UV detector in a size exclusion column. Results for Supplement 1 are shown in Figure 26.
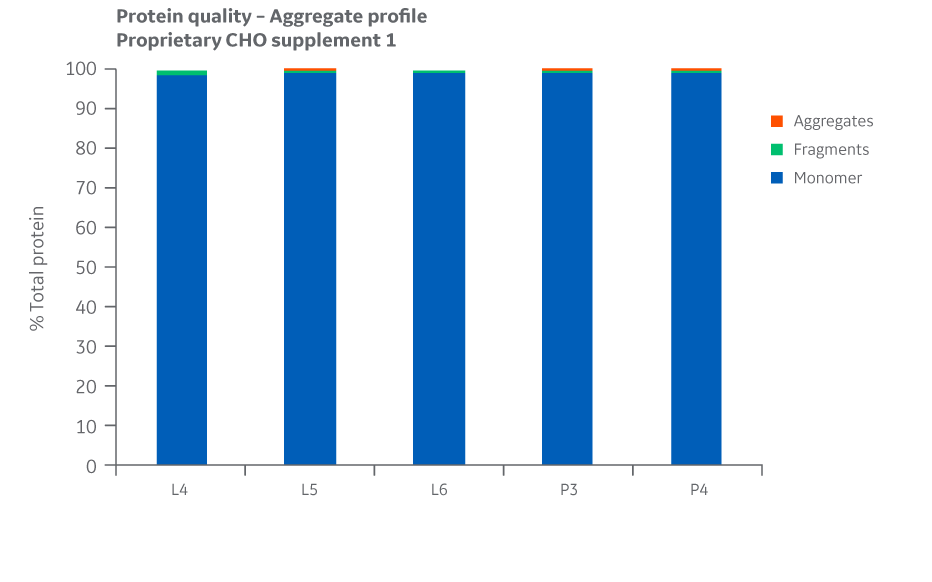
Fig 26. Aggregate profiles for Supplement 1 batches. Single injections.
Analyses of charge variants and glycan forms in IgG production were also performed. Results for Supplement 1 are presented in Figures 27 and 28, respectively.
Analysis of protein quality attributes shows similar results between the Logan and Pasching manufacturing sites for all feed conditions evaluated.
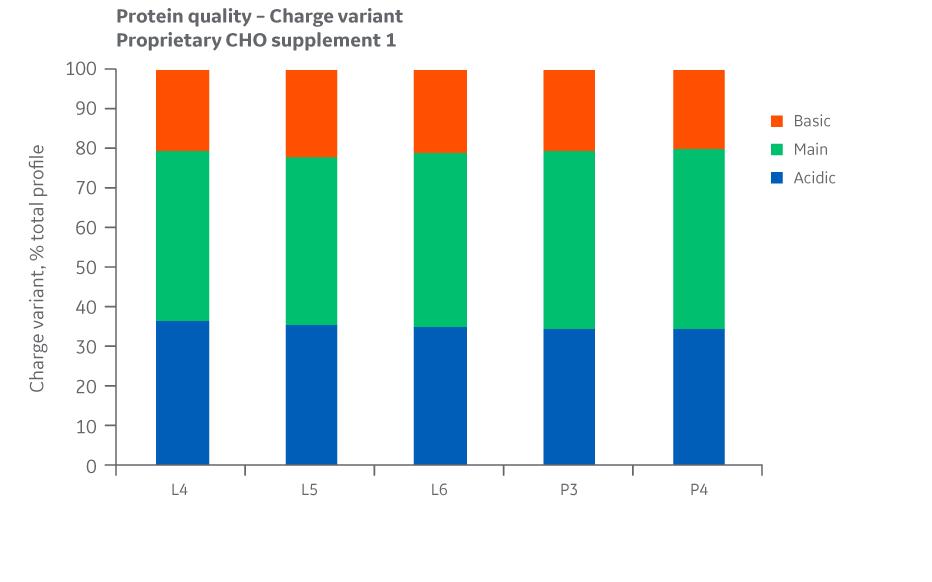
Fig 27. Charge variants for Supplement 1 batches. Single injections.
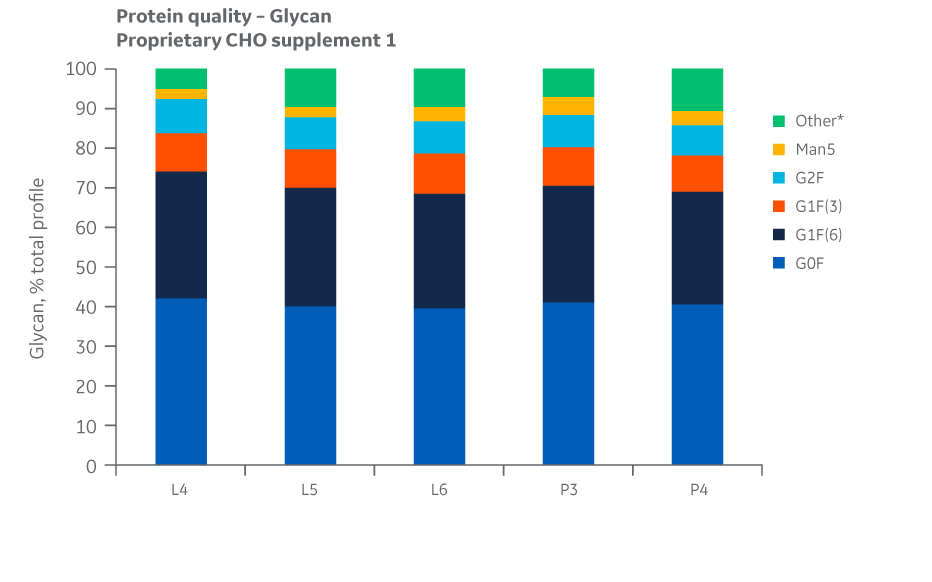
Fig 28. Glycan distribution for Supplement 1 batches. Single injections.
Analysis of protein quality attributes shows equivalency between the Logan and Pasching sites.
Supplement 2
The experimental design was conducted according to the details provided in the article. Batch sizes are listed in Table 7.
Table 7. Batch sizes of Supplement 2
| Product |
Manufacturing site |
Scale (kg) |
Lot ID |
| Supplement 2 | Pasching |
105 |
P5 |
| 300 | P6 | ||
| Logan | 7 | L7 | |
| 150 | L8 | ||
| 800 | L9 |
Analytical testing was performed according to the details provided in the article. Results for Supplement 2 are summarized here.
Comparison of critical quality attributes
Physical characteristics
A comparison of physical characteristics was made between the batches of Supplement 2 manufactured at the Logan and Pasching sites to identify any differences in the appearance, particle size, flowability, or filterability of the micronized powder.
Appearance and color
Color comparison using spectrophotometry as well as visual inspection showed slight variations in color for some batches of the powder media.
Variations in color are likely attributed to specific raw chemicals. Subsequent cell culture performance evaluations suggest that slight variation in color does not negatively affect biological performance.
Moisture and bioburden
Moisture and bioburden results were obtained by reviewing the lot-specific in-process testing and QC release testing for each batch of Supplement 2.
Collected data for the Supplement 2 batches manufactured at the Pasching and Logan sites were within allowable limits for both moisture and bioburden.
Particle size distribution
Data collected for each Supplement 2 batch shows slight variation between manufacturing sites for PSD and bulk density. However, as the chemical and biological data later confirm, this variability does not negatively affect cell culture performance and can likely be attributed to inherent differences between the specific pin mills used. PSD results for Supplement 2 are displayed in Figure 29.
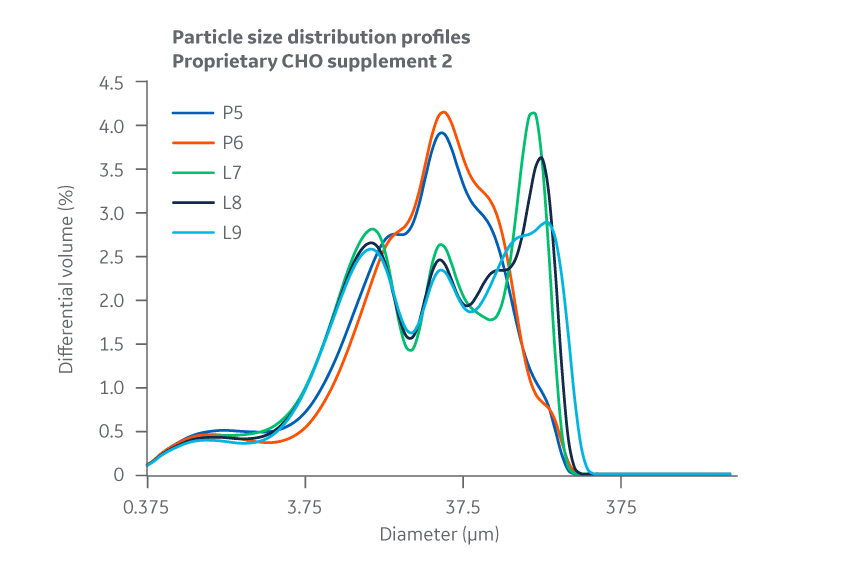
Fig 29. Supplement 2. Particle size distribution. Average of duplicate samples.
Flowability, determined by calculating the angle of repose for the micronized powder, showed no substantial differences between Supplement 2 formulations manufactured at either site.
Filterability
No substantial differences between manufacturing sites were observed for 0.2 μm filtration throughput or flow decay (constant pressure). Figure 30 shows results for Supplement 2.
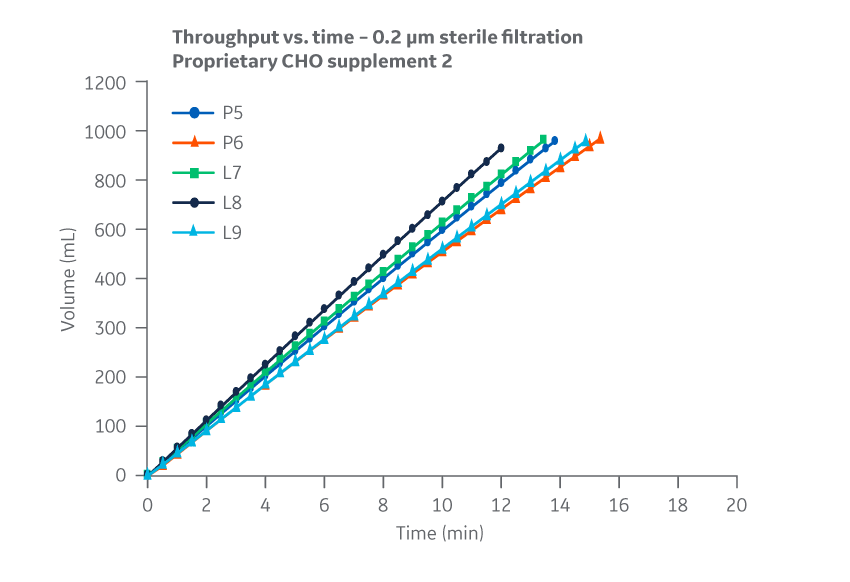
Fig 30. Supplement 2. Throughput versus time for samples subjected to 0.2 µm filtration. Filtration data represents 0.2 µm glass fiber (GF) pre-filtration, and 0.2 µm PVDF final filtration. Average of duplicate samples.
Chemical characteristics
Supplement 2 has three analytes. To protect the proprietary formulation, results for those analytes are provided without revealing their name or identifying attribute. Intra- and inter-batch homogeneity and recovery are presented in Figures 31 and 32, respectively.
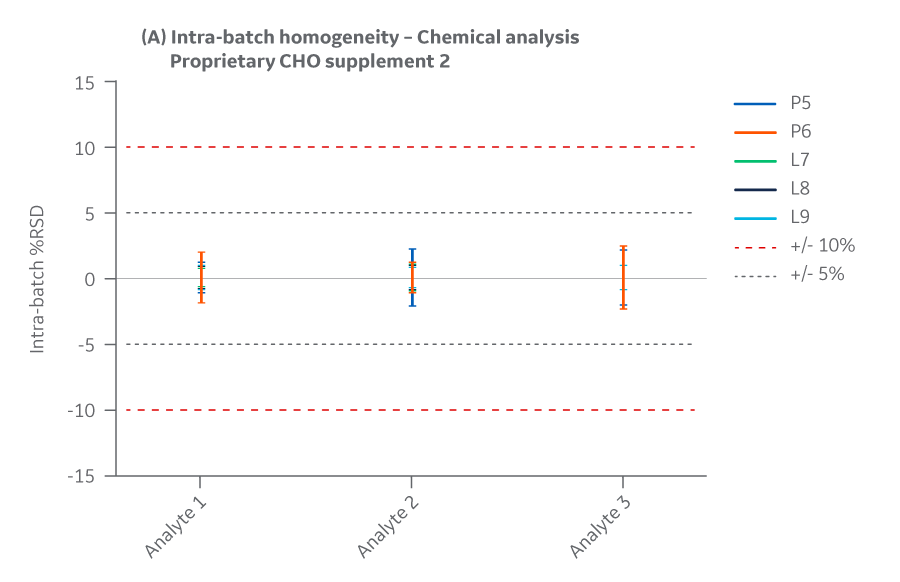
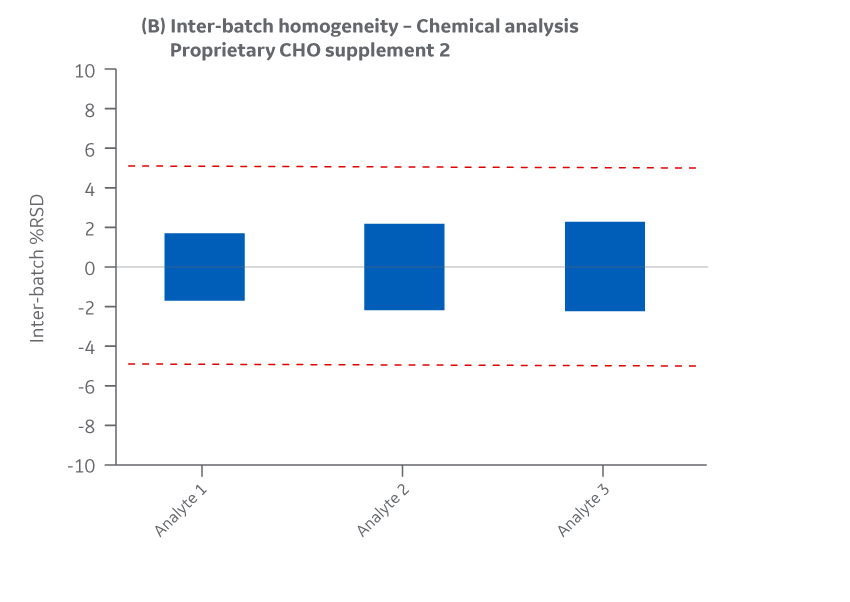
Fig 31. Supplement 2 homogeneity of chemical analytes. (A) intra-batch, (B) inter-batch. Average of duplicate samples.
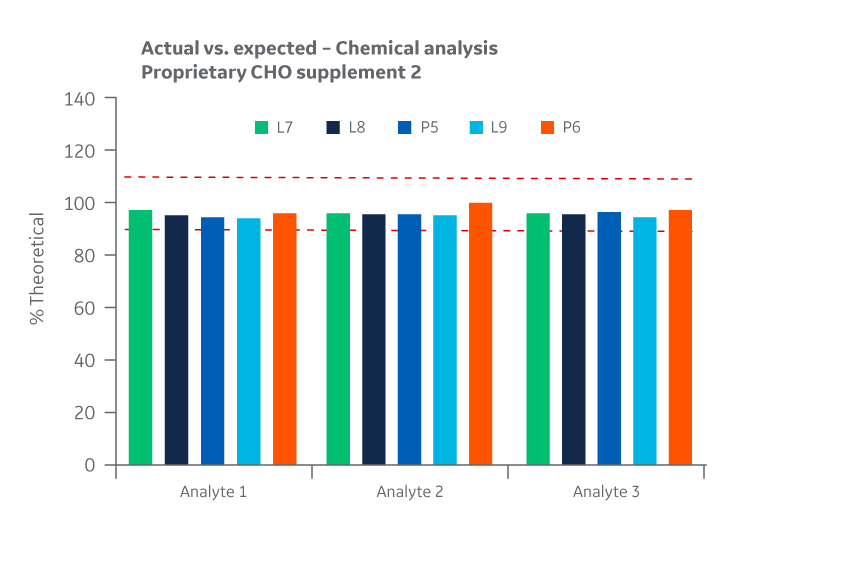
Fig 32. Supplement 2 recovery of chemical analytes at Logan and Pasching sites. Average of duplicate samples.
Biological characteristics
Cell culture performance
Supplement 2 was evaluated in a fed-batch process. To assess the comparability of the feed batches, samples were evaluated in triplicate 125 mL shaker flasks. The study matrix varied only one condition, while the other two conditions used a previously QC released lot. Additionally, two controls were used to confirm validity of the growth assay.
A DG-44 derived cell line that expresses IgG was used in a 11-day fed-batch system. IgG productivity samples were collected on days 4–11. Fed-batch growth data were obtained.
All growth curves are given as a measure of viable cell densities. Growth curves for Supplement 2 (Fig 33) displayed similar trends over a 11-day period, with DG44 growth peaking at approximately day 6 and comparable cell viabilities.
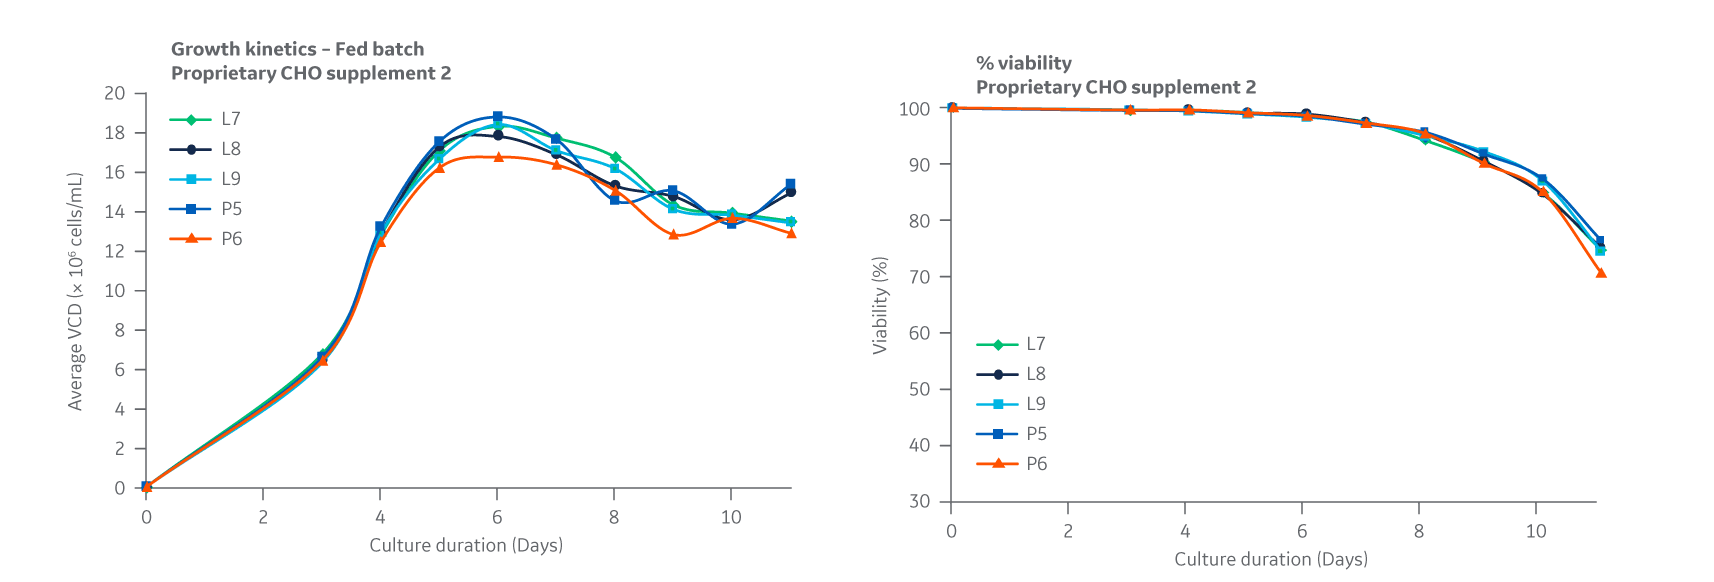
Fig 33. Supplement 2. DG44 growth kinetics is given as a measure of viable cell densities. Percent viability is shown on the right. Average of triplicate samples.
Slight variation was noted for some test conditions but was within the expected variation of 20%–25% for the shaker flask assay used. Total IgG expression for each condition over the course of days 4–11 in fed batch are displayed in Figure 34.
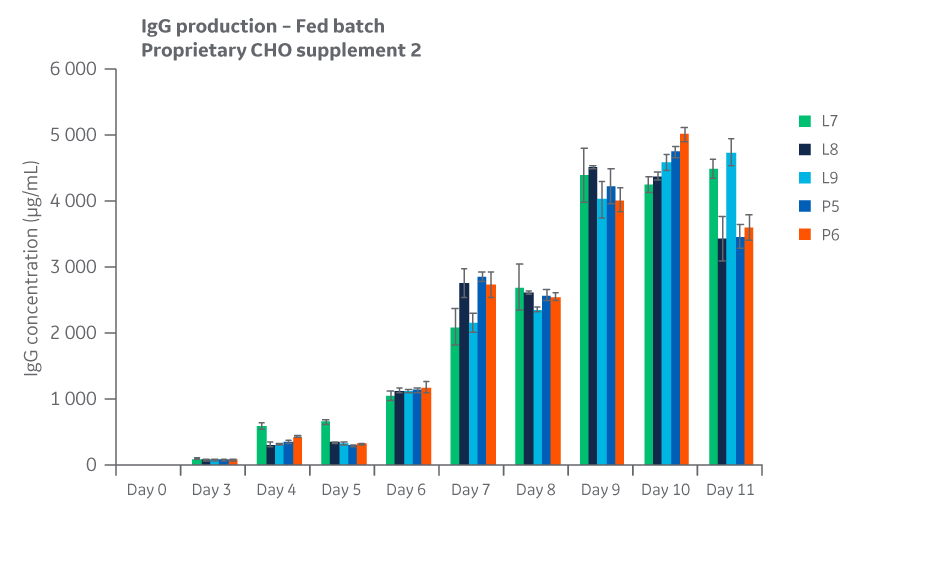
Fig 34. Total IgG expression for Supplement 2 conditions over the course of days 4 through 11 in fed batch.
Protein quality
Samples from each test condition were collected on day 12 of the fed-batch study. Samples were purified using a protein A spin column.
Protein quality and charge variants were assessed by analyzing the samples for aggregates, monomers, and fragments using UPLC equipped with a UV detector in a size exclusion column. Results for Supplement 2 are shown in Figure 35.
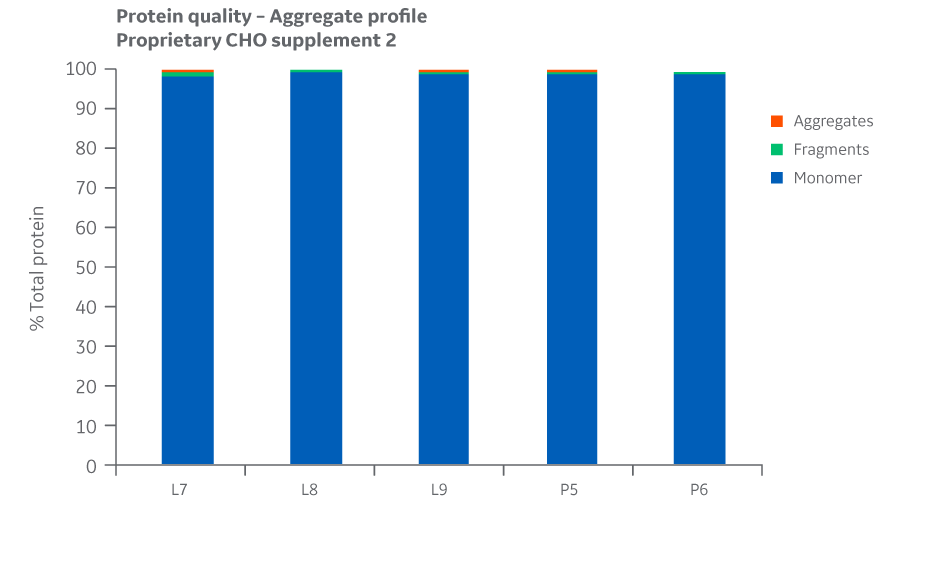
Fig 35. Aggregate profiles for Supplement 2 batches. Single injections.
Analyses of charge variants and glycan forms in IgG production were also performed. Results for Supplement 2 are presented in Figures 36 and 37, respectively.
Analysis of protein quality attributes shows similar results between the Logan and Pasching manufacturing sites for all feed conditions evaluated.
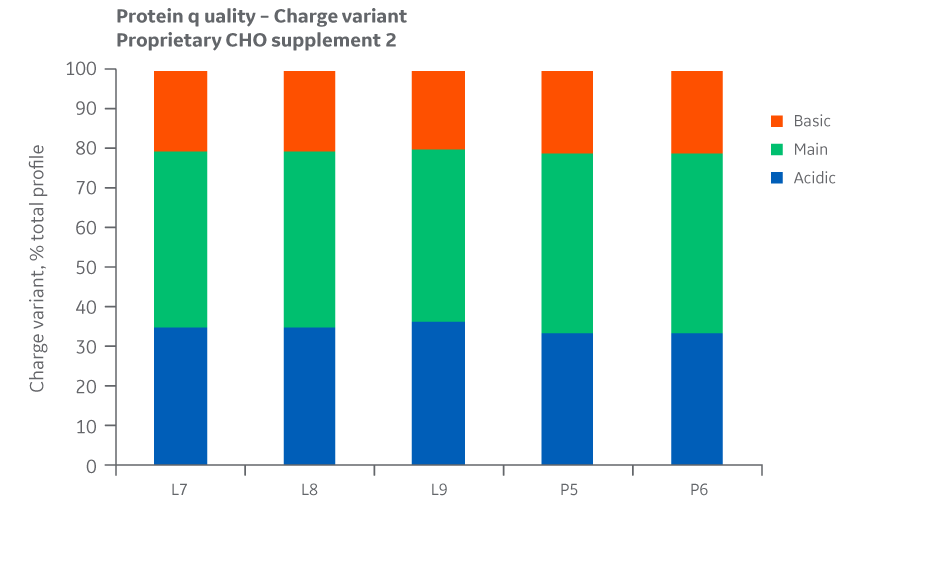
Fig 36. Charge variants for Supplement 2 batches. Single injections.
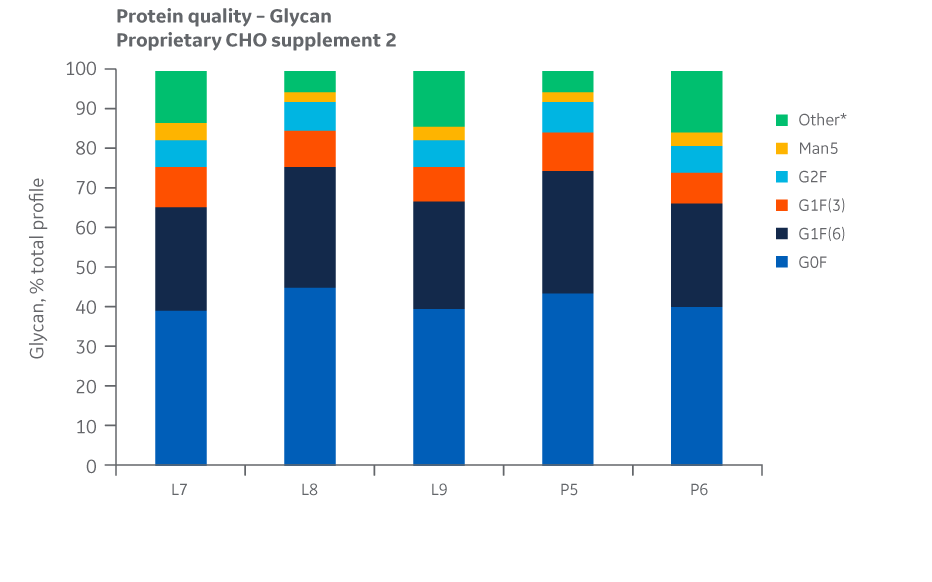
Fig 37. Glycan distribution for Supplement 2 batches. Single injections.
Analysis of protein quality attributes shows equivalency between the Logan and Pasching sites.
Medium 2
The experimental design was conducted according to the details provided in the article. Medium 2 manufactured at both sites shared the exact same raw material vendors and vendor lots. Batch sizes are listed in Table 8.
Table 8. Batch sizes of Medium 2
| Product |
Manufacturing site |
Scale (kg) |
Lot ID |
| Medium 2 | Pasching |
250 |
P7 |
| Logan | 250 | L10 |
Analytical testing was performed according to the details provided in the article. Results for Medium 2 are summarized here.
Comparison of critical quality attributes
Physical characteristics
A comparison of physical characteristics was made between the batches of Medium 2 manufactured at the Logan and Pasching sites to identify any differences in the appearance, particle size, flowability, or filterability of the micronized powder.
Appearance and color
Color comparison using spectrophotometry as well as visual inspection showed slight variations in color for some batches of the powder media.
Variations in color are likely attributed to specific raw chemicals. Subsequent cell culture performance evaluations suggest that slight variation in color does not negatively affect biological performance.
Moisture and bioburden
Moisture and bioburden results were obtained by reviewing the lot-specific in-process testing and QC release testing for each batch of Medium 2.
Collected data for the Medium 2 batches manufactured at the Pasching and Logan sites were within allowable limits for both moisture and bioburden.
Particle size distribution
Data collected for each Medium 2 batch shows slight variation between manufacturing sites for PSD and bulk density. However, as the chemical and biological data later confirm, this variability does not negatively affect cell culture performance and can likely be attributed to inherent differences between the specific pin mills used. PSD results for Medium 2 are displayed in Figure 38.
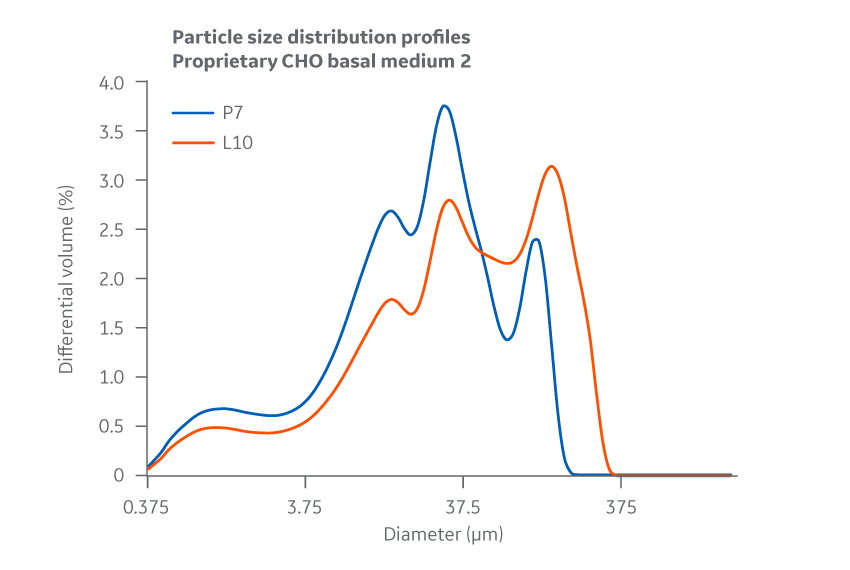
Fig 38. Medium 2. Particle size distribution. Average of duplicate samples.
Flowability, determined by calculating the angle of repose for the micronized powder, showed no substantial differences between Medium 2 formulations manufactured at either site.
Filterability
No substantial differences between manufacturing sites were observed for 0.2 μm filtration throughput or flow decay (constant pressure). Figure 39 shows results for Medium 2.
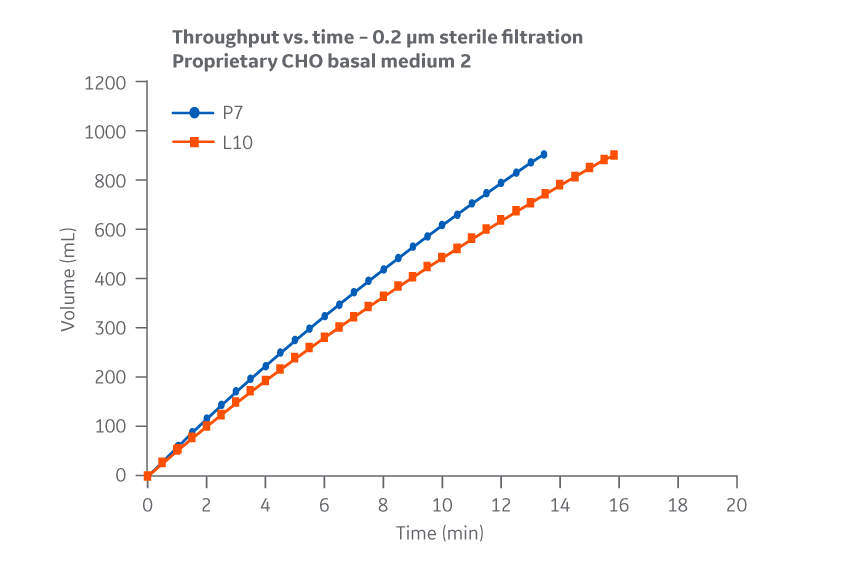
Fig 39. Medium 2. Throughput versus time for samples subjected to 0.2 µm filtration. Filtration data represents 0.2 µm glass fiber (GF) pre-filtration, and 0.2 µm PVDF final filtration. Average of duplicate samples.
Chemical characteristics
Amino acids
Intra- and inter-batch homogeneity were determined by comparing relative standard deviation (RSD) results within and across two batches. Analytical data were compared to determine the deviation between the Pasching and Logan manufacturing sites. Representative samples from each batch were hydrated according to current protocols and sampled in duplicate.
Samples were assayed using HPLC. cGMP manufacturing batches were considered homogeneous and chemically equivalent if RSD values were within ± 10%.
Batches of Medium 2 manufactured at either site met the specified target (RSD ± 10%) for the selected amino acids. Analytical data clearly demonstrate chemical equivalence and blend homogeneity between manufacturing sites.
Figure 40 shows Medium 2 results for intra- and inter-batch homogeneity of amino acids.
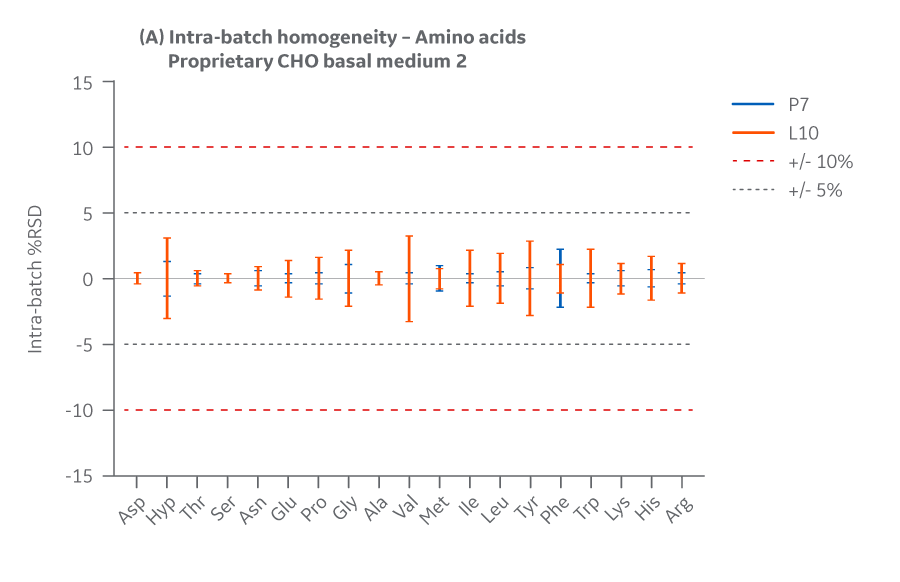
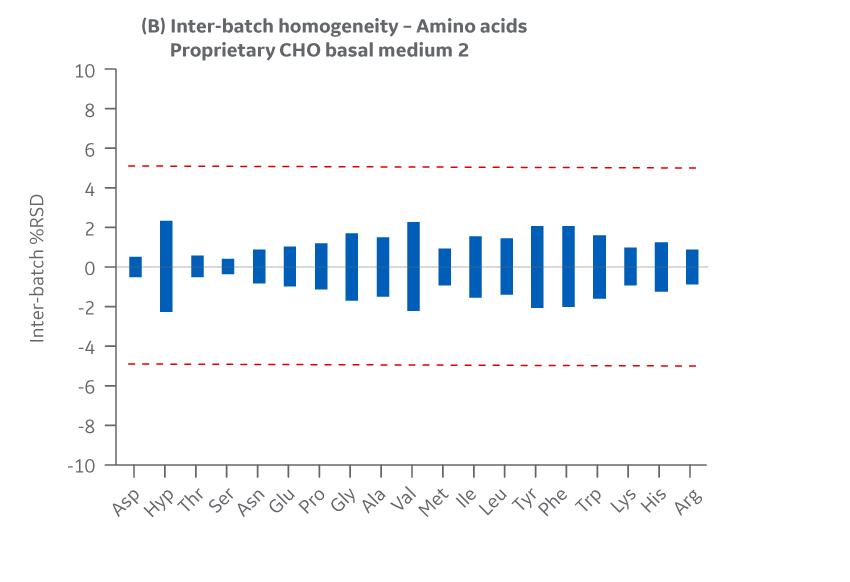
Fig 40. Medium 2 homogeneity of amino acids. (A) intra-batch, (B) inter-batch. Average of duplicate samples.
Lot-specific analytical data were also compared to the theoretical levels specified by each formulation to calculate percent recovery. To demonstrate a high level of confidence in the overall manufacturing process for each site, a recovery of 90%–110% of theoretical values for amino acids was targeted.
Recovery of all amino acids was within 90%–110% with little variability between manufacturing sites. As with the product homogeneity results, formulation accuracy data demonstrates chemical equivalence between the Logan and Pasching sites. Results for Medium 2 are displayed in Figure 41.
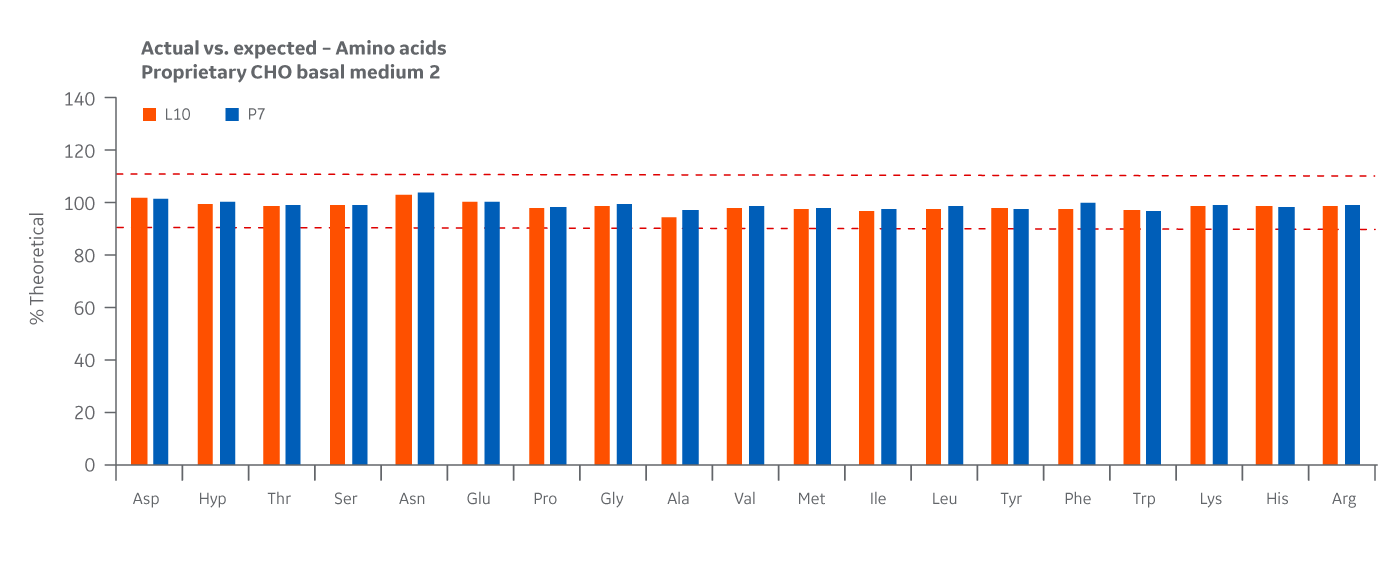
Fig 41. Medium 2 recovery of amino acids at Logan and Pasching sites. Average of duplicate samples.
Vitamins
Intra- and inter-batch homogeneity were determined by comparing relative standard deviation (RSD) results within and across two batches, as was done for amino acids. Samples were assayed using HPLC. cGMP manufacturing batches were considered homogeneous and chemically equivalent if RSD values were within ± 15%.
The Medium 2 batches manufactured at either site met the specified target (RSD ± 15%) for the selected vitamins. Analytical data clearly demonstrates chemical equivalence and blend homogeneity between manufacturing sites.
Figure 42 displays Medium 2 results for intra- and inter-batch homogeneity of vitamins.
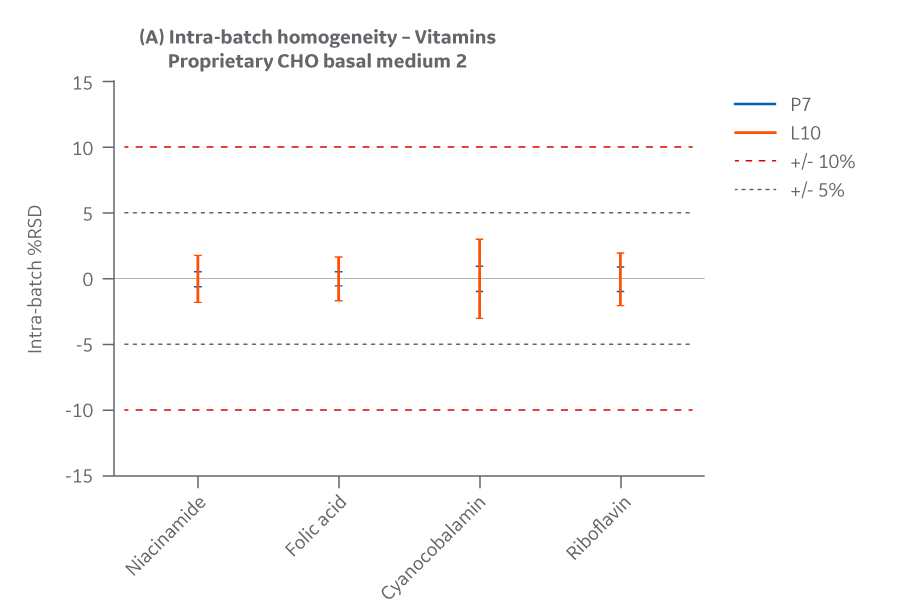
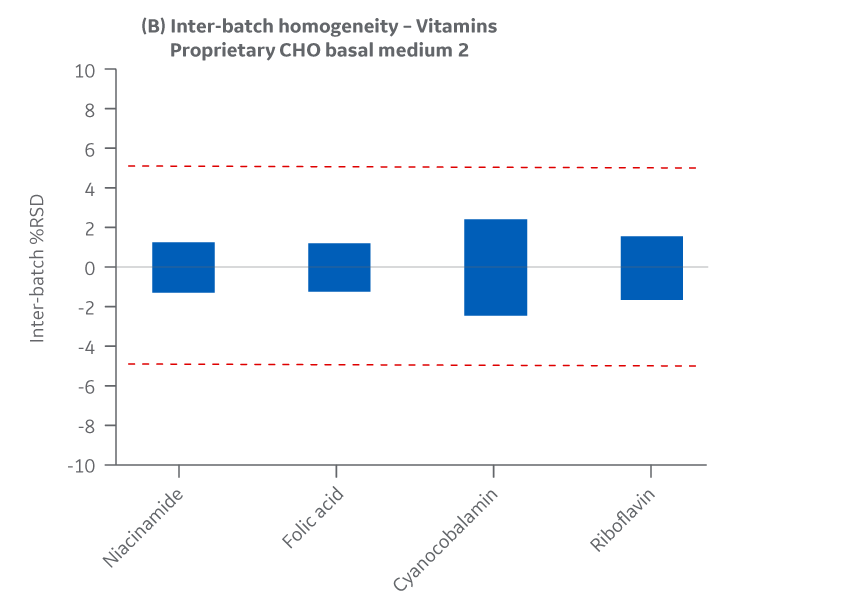
Fig 42. Medium 2 homogeneity of vitamins. (A) intra-batch, (B) inter-batch. Average of duplicate samples.
A percent recovery of 85%–115% of theoretical values for vitamins was targeted.
Recovery of all vitamins was within the target range. As with the product homogeneity results, formulation accuracy data demonstrates chemical equivalence between the Logan and Pasching sites. Results for Medium 2 are shown in Figure 43.
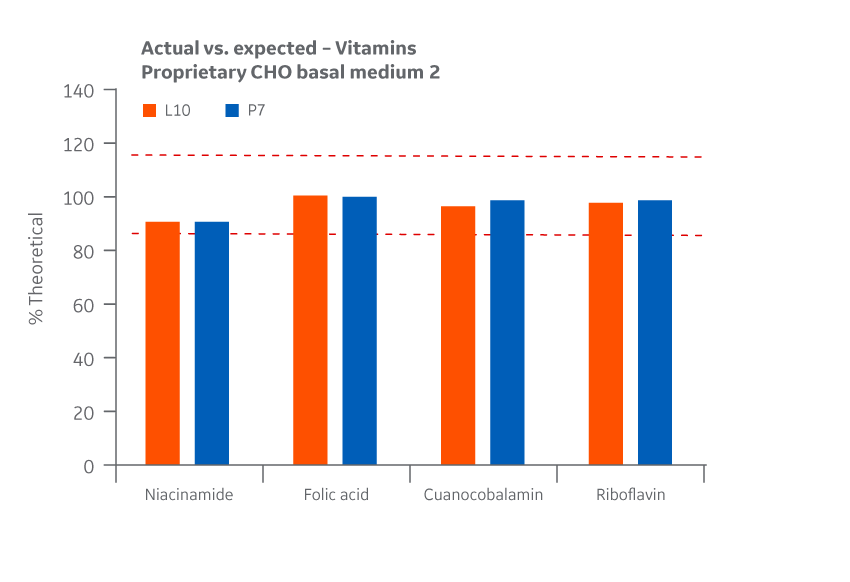
Fig 43. Medium 2 recovery of vitamins at Logan and Pasching sites. Average of duplicate samples.
Metals
Intra- and inter-batch homogeneity were determined by comparing relative standard deviation (RSD) results within and across multiple batches, as was done for amino acids and vitamins. Samples were assayed using ICP-MS. cGMP manufacturing batches were considered homogeneous and chemically equivalent if RSD values were within ± 15%.
Both Medium 2 batches manufactured at either site met the specified target (RSD ± 15%) for the selected vitamins. Analytical data clearly demonstrates chemical equivalence and blend homogeneity between manufacturing sites.
Figure 44 displays Medium 2 results for intra- and inter-batch homogeneity of metals.
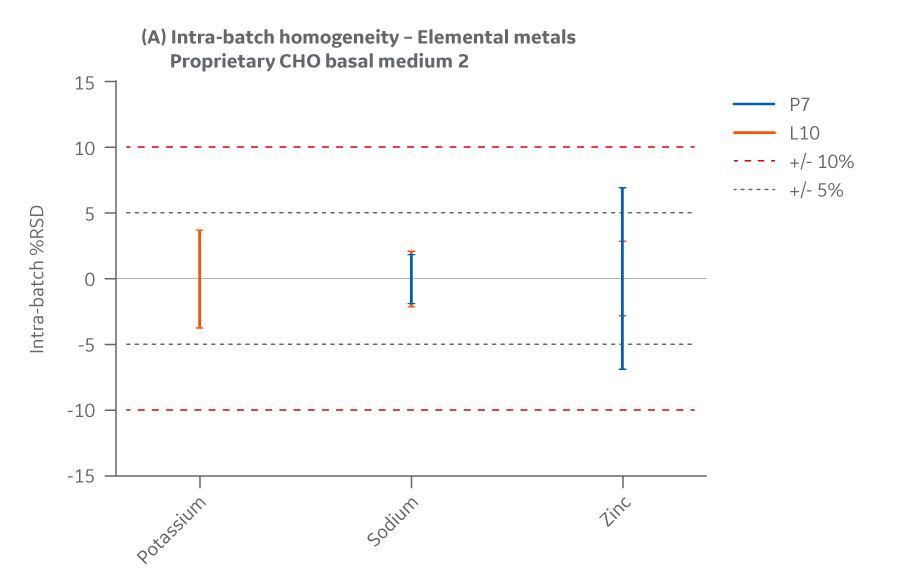
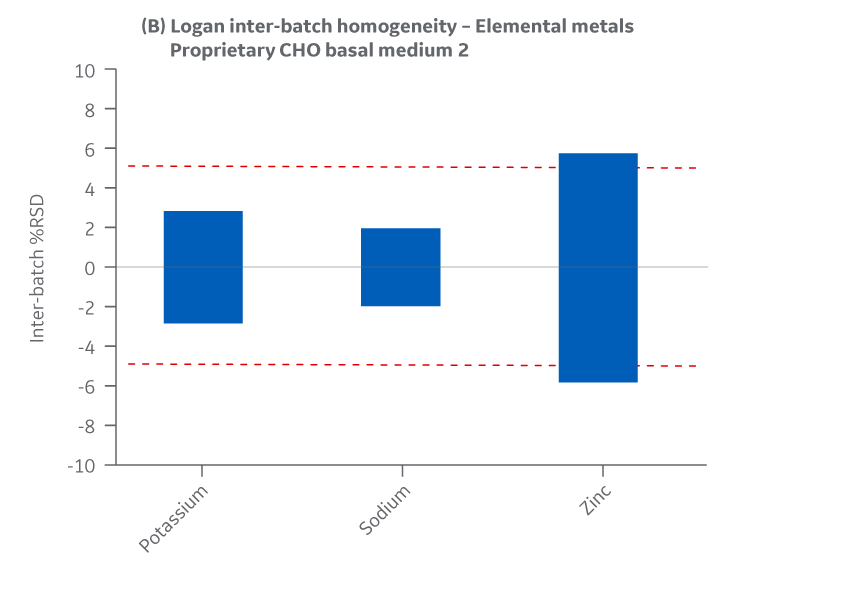
Fig 44. Medium 2 homogeneity of metals. (A) intra-batch, (B) inter-batch. Average of duplicate samples.
A recovery of 85%–115% of theoretical values for metals was targeted.
Recovery of all metals was within the target range. As with the product homogeneity results, formulation accuracy data demonstrates chemical equivalence between the Logan and Pasching sites. Results for Medium 2 are shown in Figure 45.
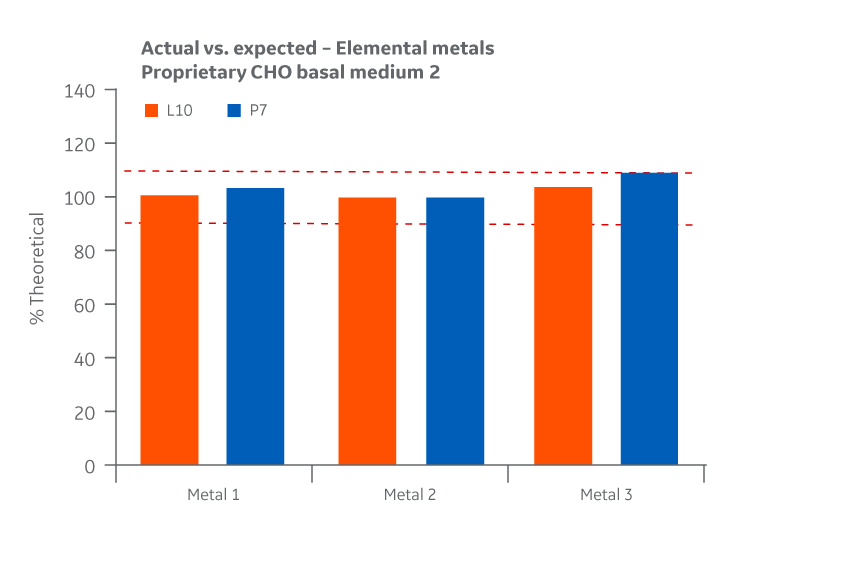
Fig 45. Medium 2 recovery of metals at Logan and Pasching sites. Average of duplicate samples.
Biological characteristics
Cell culture performance
Medium 2 was evaluated in a straight batch process. To assess the comparability of the medium batches, samples were evaluated in triplicate 125 mL shaker flasks. The study matrix varied only one condition, while the other two conditions used a previously QC released lot. Additionally, two controls were used to confirm validity of the growth assay.
Batch growth data for Medium 2 was obtained. All growth curves are given as a measure of viable cell densities and displayed similar trends over a 7-day period, with DG44 growth peaking at approximately day 4, as shown in Figure 46. Slight variation was noted for some test conditions but was within the expected variation of 20%-25% for the shaker flask assay used.
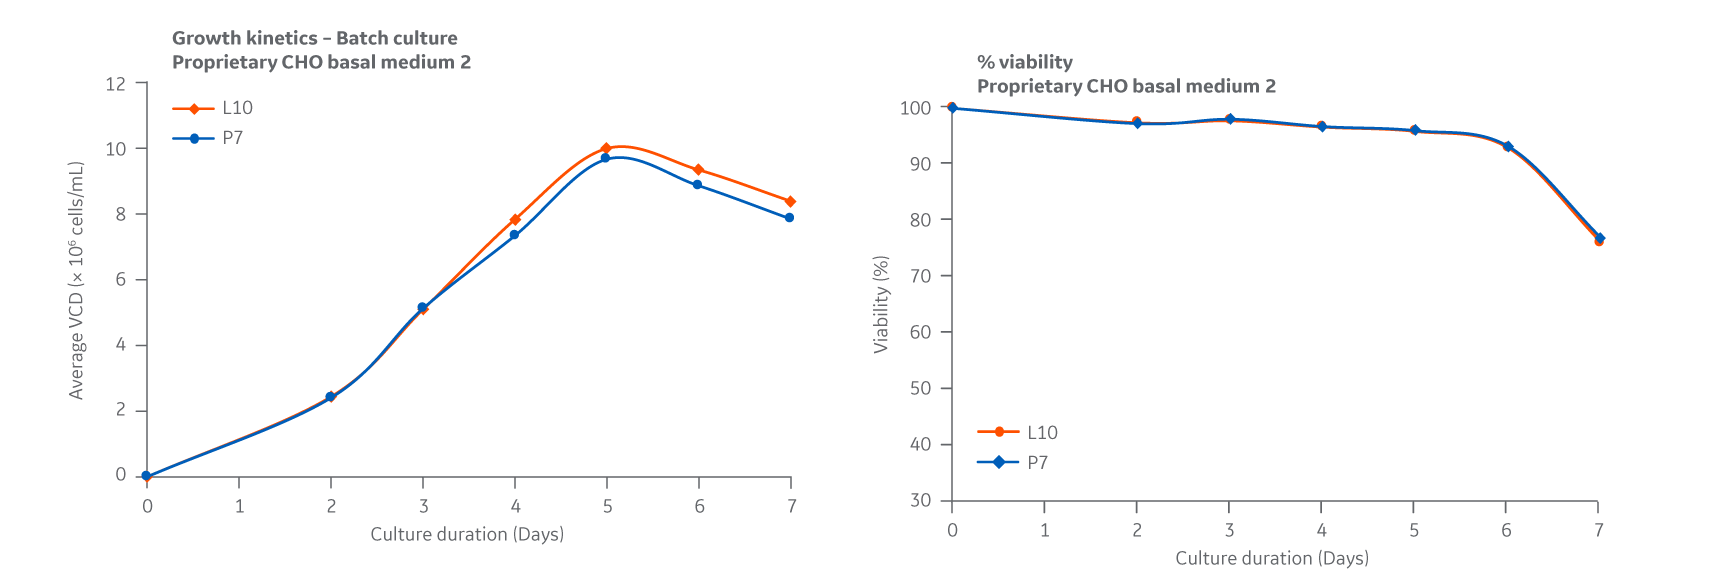
Fig 46. Medium 2. DG44 growth kinetics is given as a measure of viable cell densities. Average of triplicate samples
Total IgG expression for each condition over the course of days 4–7 in fed batch are displayed in Figure 47.
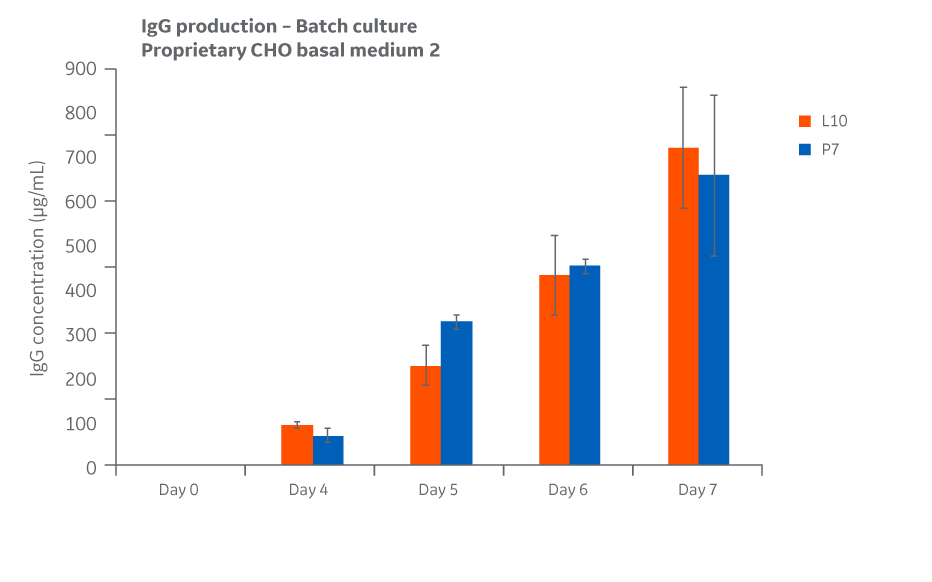
Fig 47. Total IgG expression for Medium 2 conditions over the course of days 4 through 7 in straight batch.
Protein quality
Samples from each test condition were collected. Samples were purified using a protein A spin column..
Protein quality and charge variants were assessed by analyzing the samples for aggregates, monomers, and fragments using UPLC equipped with a UV detector in a size exclusion column. Aggregate results for Medium 2 are shown in Figure 48.
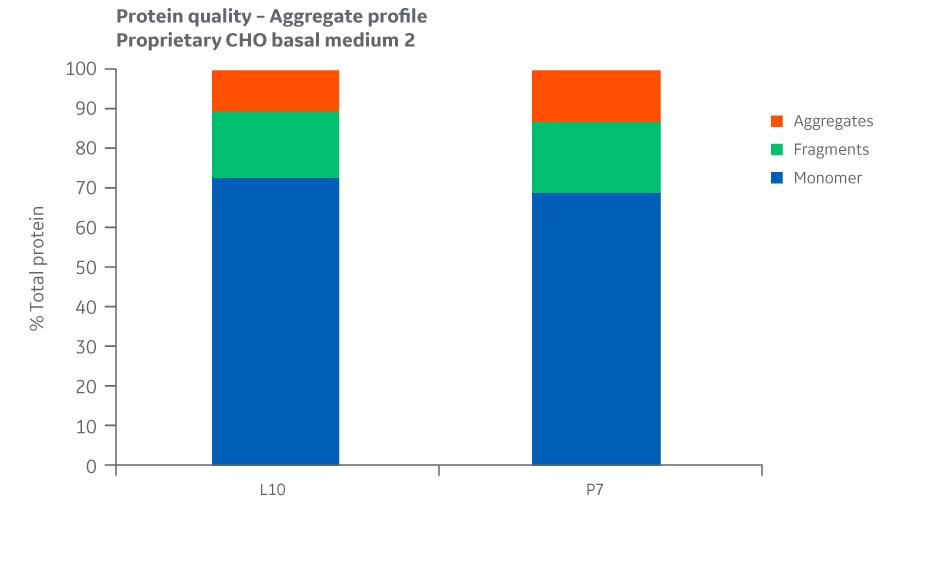
Fig 48. Aggregate profiles for Medium 2 batches. Single injections.
Analyses of charge variants and glycan forms in IgG production were also performed. Results for Medium 2 are presented in Figures 49 and 50, respectively.
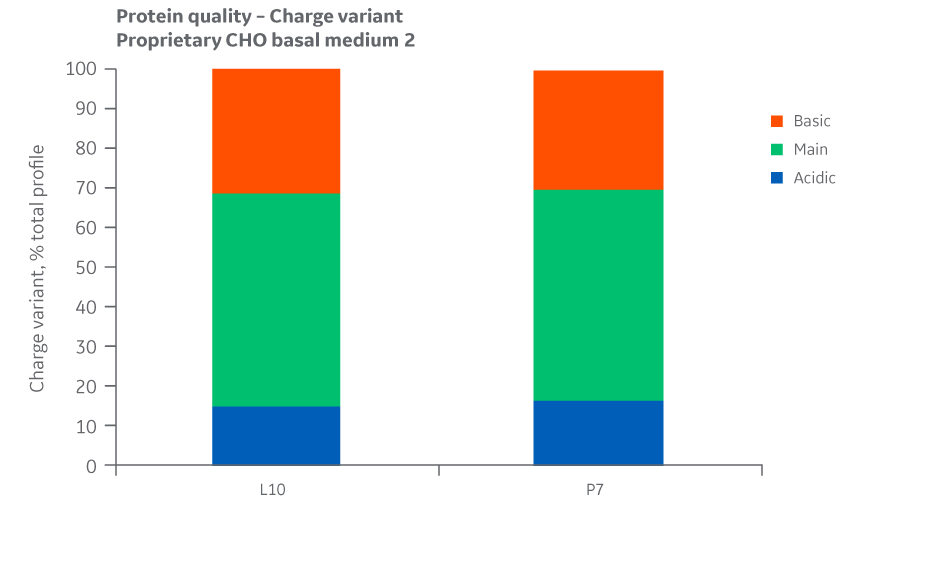
Fig 49. Charge variants for Medium 2 batches. Single injections.
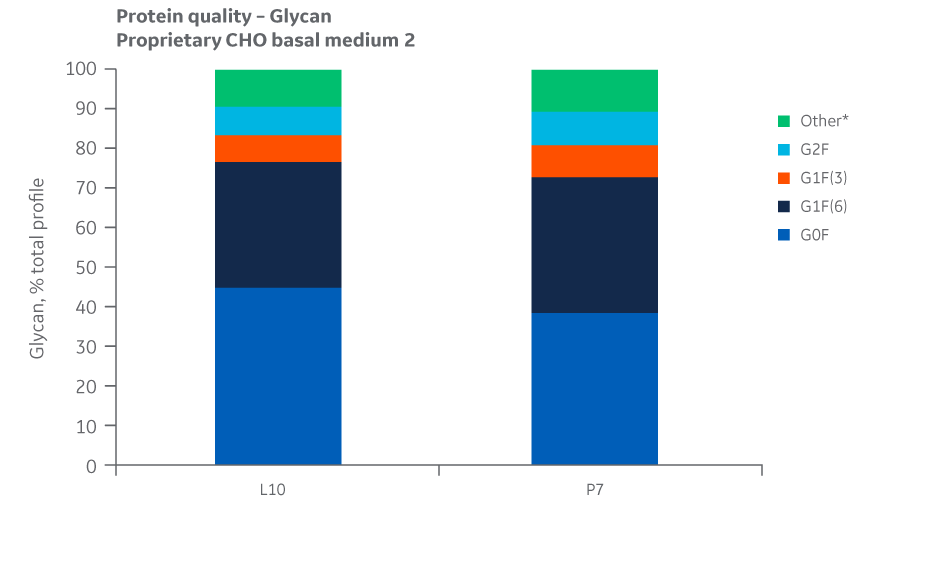
Fig 50.Glycan distribution for Medium 2 batches. Single injections.
Analysis of protein quality attributes for Medium 2 samples shows equivalency between the Logan and Pasching sites.