By Divakara Uppu, Mark Auger Jr, Roman Kondra, Adam Hejmowski, and Nicholas Marchand
Cytiva has in 2024 launched Delta regenerated cellulose (RC) flat sheet membranes with 100 kDa molecular weight cutoff (MWCO). The membranes are available in Centramate™ and Centrasette™ cassettes and are intended for ultrafiltration/diafiltration of RNA drug therapeutics by tangential flow filtration (TFF). Our objective with this application note is to test the performance of the Delta 100 kDa membrane cassettes for UF/DF of various RNA molecules such as mRNA, self-amplifying RNA (saRNA), and lipid nanoparticle (LNP)-encapsulated RNA (RNA-LNPs) by TFF.
Buy now Watch 30 minute webinar
Introduction
The advent of messenger RNA (mRNA) vaccines for COVID-19 has revolutionized RNA-based genomic medicine and opened avenues for prophylactic as well as therapeutic applications in multiple disease areas (1–3). Apart from mRNA, self-amplifying/-replicating (saRNA) and circular RNA (cRNA) have emerged as new classes of RNA drug molecules. Ultrafiltration and diafiltration (UF/DF) via tangential flow filtration (TFF) is an important unit operation in RNA manufacturing that is employed in three to five steps throughout the process (1) (Fig 1). Common TFF steps include UF/DF of a crude RNA mixture to remove impurities, as well as to condition the mRNA into a buffer suitable for the subsequent chromatography step. A second UF/DF step is often performed to concentrate and condition the purified RNA into a storage buffer followed by bioburden filtration to make the bulk RNA drug substance. If the RNA is to be encapsulated into lipid nanoparticles (RNA-LNPs), a third UF/DF step is typically required to concentrate and buffer exchange into the cryopreservation buffer before sterile filtration and aseptic fill/finish of the drug product (1).
RNA and RNA-LNP UF/DF processes are typically run at ambient temperature wherein maintaining product quality and minimizing processing time are paramount. Unlike monoclonal antibodies (mAbs), newer modalities like RNA and RNA-LNPs tend to be less stable at ambient temperature and more prone to membrane fouling owing to their size, secondary structures, and chemistry (2, 3). Larger constructs like saRNA are particularly prone to degradation (1, 4, 5) due to autohydrolysis. LNP solutions often show poor stability due to the ethanol used in their formulation which can lead to membrane fouling (1–3). For these reasons, the industry requires TFF equipment that can minimize fouling and minimize processing time. Common approaches to achieve this include selecting membranes and cassettes designed to limit fouling and maximize flux.
With the launch of our Delta regenerated cellulose (RC) flat sheet membranes with 100 kDa molecular weight cutoff (MWCO) in T-series cassettes, we have expanded our existing portfolio (Delta 10 and 30 kDa membranes) to offer UF/DF for nucleic acid therapeutic applications. The objective here is to test the performance of the Delta 100 kDa membrane cassettes for UF/DF bioprocessing of mRNA, saRNA, and RNA-LNPs at ambient temperature.
Fig 1. An overview of the RNA manufacturing process with the need for three UF/DF steps where a Delta 100 kDa cassette could be employed.
Materials and methods
We evaluated two TFF cassettes containing 100 kDa regenerated cellulose membranes in this work as described in Table 1. mRNA handling best practices were maintained throughout the testing, and RNase-free consumables and buffers were used for all testing. All the testing was performed with TFF in recirculation mode. As per the supplier recommendations for the cassettes, we performed a cleaning step with 0.25 (Delta) and 1.0 N (Sartocon Slice 200 Hydrosart membrane cassette, Sartorius) NaOH for 1 h for the entire flow path of the TFF system. We used a TFF system with a peristaltic pump, 1/8” (pump and retentate valve), and 1/16” (permeate) internal diameter tubing, pressure sensors (feed, retentate and permeate), and scales (feed and permeate). Transmembrane pressure (TMP) was controlled using a retentate back-pressure valve. We measured permeate flow by weight for 1 min and normalized to surface area to calculate flux. The temperature of the UF/DF process was maintained at 20°C ± 2°C. All operating parameters and results (e.g., flow rates, loading) were normalized to effective filter area (EFA) to ensure equivalent operating conditions between cassettes.
Table 1. Characteristics of the evaluated TFF cassettes
| Supplier | Membrane | MWCO | Cassette | EFA |
| Cytiva | Delta (RC) | 100 kDa | Centramate™ T01 | 93 cm2 |
| Sartorius | Hydrosart (RC) | 100 kDa | Sartocon Slice 200 E-screen | 200 cm2 |
Results and discussion
Messenger RNA (mRNA)
We used a green fluorescent protein (GFP) construct of mRNA (~ 1 kb, uncapped with a ~ 120 nt PolyA tail) for the testing. A crude mRNA mixture was used as the feed material. Initial permeate flux excursions with mRNA feed at three different feed flow rates — 2.5, 5.0, and 7.5 L/min/m2 (LMM) showed improved flux from the Delta (Fig 2A) compared to the Hydrosart membrane cassette (Fig 2B) at all flow rates. The limiting permeate flux at the highest feed flow rate of 7.5 LMM was 1.9-fold higher for Delta (315 LMH) compared to Hydrosart membrane cassettes (163 LMH, Fig 2C).
Fig 2. Flux excursion with crude mRNA. Permeate flux (L/m2/h, LMH) vs transmembrane pressure (TMP) curves for Delta (A) and Hydrosart (B) membrane cassettes at three different feed flow rates. (C) Comparison of limiting permeate flux at 7.5 LMM feed flow rate. mRNA feed concentration at ~ 0.5 g/L and loaded at 5 L/m2. Data represent mean ± standard deviation (S.D.), n = 3. p-value: *** < 0.001. Statistical analysis was performed using Student’s t-test (unpaired, two-tailed).
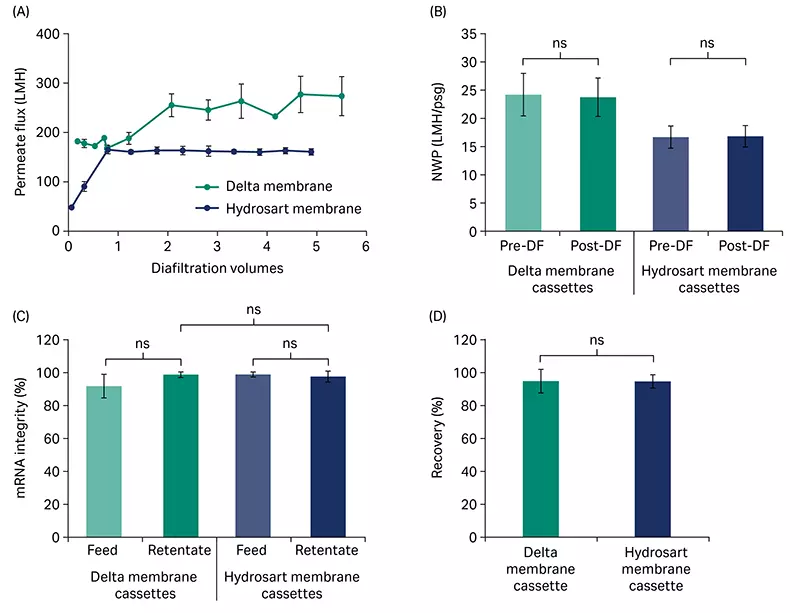
Using a TMP-control strategy, we performed diafiltration at 7.5 LMM feed flow rate for five diavolumes (DV). Diafiltration was run near the critical TMP for both the Delta and Hydrosart membrane cassettes (15 to 20 psi [1.03 to 1.38 bar, 0.10 to 0.14 MPa]). The Delta membrane cassettes showed higher flux during the diafiltration (Fig 3A), which led to approximately 40% to 50% faster processing time compared to the Hydrosart membrane cassettes. This flux benefit could translate to either reduced processing time, or reduced filter area required in your manufacturing setting.
The normalized water permeability (NWP) for both cassettes did not significantly change over diafiltration indicating low fouling (Fig 3B). We observed no significant differences in mRNA yield or integrity between Delta and Hydrosart membrane cassettes (Fig 3C and 3D). For the Delta membrane cassettes, mRNA integrity (analyzed by capillary gel electrophoresis, PA800 Plus, SCIEX) showed > 90% main peak area with no significant differences between the feed and retentate when we performed diafiltration at room temperature (Fig 3C). mRNA yield (based on concentration by Ribogreen assay kit) after diafiltration averaged 94% (Fig 3D). Product retention for both Delta and Hydrosart was > 99.3% as the mRNA concentration in the permeate was below the limit of quantitation (BLQ) for the Ribogreen assay. Protein concentration (NanoOrange assay kit) of the crude RNA feed as well as the retentate read below the limit of quantitation for both the cassettes, preventing any findings on protein impurity removal.
Fig 3. Diafiltration of crude mRNA. (A) Diafiltration of crude mRNA comparing the flux of Delta and Hydrosart membrane cassettes. (B) Normalized water permeability (NWP) at 20°C before and after diafiltration (DF). (C) mRNA integrity (main peak area) in feed and retentate pools. (D) Product recovery in the retentate pools after diafiltration. mRNA feed concentration was at ~ 0.5 g/L and loaded at 5 L/m2. Three independent cassettes (n = 3) were used for each cassette type. Diafiltration buffer: 10 mM TRIS and 1 mM EDTA, pH 7.5. Data represents mean ± S.D., n = 3. p-value: ns = not significant (p > 0.05). Statistical analyses were performed using Student’s t-test (unpaired, two-tailed).
Self-amplifying RNA (saRNA)
For a crude mixture of saRNA (GFP construct, 8.5 kb uncapped with a ~ 40 nt PolyA tail), permeate flux excursion showed higher flux performance for the Delta membrane cassette (Fig 4A) at three different feed flow rates compared to the Hydrosart membrane cassette (Fig 4B). The limiting permeate flux at the highest feed flow rate of 7.5 LMM was 1.8-fold higher for the Delta (161 LMH) compared to the Hydrosart membrane cassettes (91 LMH, Fig 4C). Interestingly, we observed some effect from RNA construct size on the permeate flux through the TFF cassettes, wherein the limiting flux decreased when the construct size increased from 1 kb to 8.5 kb with similar RNA concentrations (Fig 2C and 4C).
Fig 4. Flux excursions with saRNA. Permeate flux vs TMP curves for Delta (A) and Hydrosart (B) membrane cassettes at three different feed flow rates. (C) A comparison between Delta and Hydrosart membrane cassettes for limiting flux at 7.5 LMM feed flow rate. saRNA feed concentration at ~ 0.5 g/L and loading at 5 L/m2. Data represent mean ± S.D., n = 3. p-value: ** p < 0.01. Statistical analysis was performed using Student’s t-test (unpaired, two-tailed).
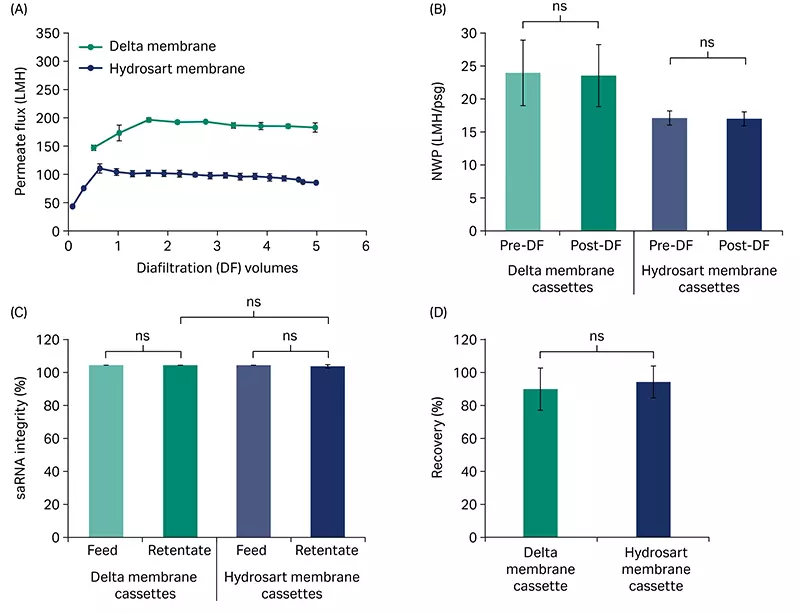
Diafiltration performed at 7.5 LMM and critical TMP (20 psi [1.37 bar, 0.137 MPa] for the Delta membrane cassette; 13 psi [0.89 bar, 0.089 MPa] for the Hydrosart membrane cassette) with saRNA showed consistently higher permeate flux across the 5 diafiltration volumes (Fig 5A) and ~ 40% faster processing time for the Delta membrane compared to the Hydrosart membrane. NWP was not significantly changed by the diafiltration for either cassette (Fig 5B) indicating low fouling. DF processing conditions did not affect saRNA quality as measured by integrity being > 95% and not significantly different between the feed and retentate pools for both Delta and Hydrosart membrane cassettes (Fig 5C). The yield from the Delta membrane cassettes averaged 87% after DF and was not statistically different from the Hydrosart membrane cassettes (Fig 5D).
Fig 5. Diafiltration of saRNA. (A) Diafiltration of crude saRNA demonstrating the flux difference across 5 diafiltration volumes for Delta and Hydrosart membrane cassettes. (B) Normalized water permeability (NWP) at 20°C for before and after diafiltration. (C) saRNA integrity (main peak area) in feed and retentate pools. (D) Product recovery from the retentate pools after diafiltration. saRNA feed concentration was ~ 0.5 g/L and loading was 5 L/m2. Three independent cassettes (n = 3) were used for each cassette type. Diafiltration buffer: 10 mM TRIS and 1 mM EDTA, pH 7.5. Data represent mean ± S.D., n = 3. p-value: ns- not significant (p > 0.05). Statistical analyses were performed using Student’s t-test (unpaired, two-tailed).
Lipid nanoparticles (LNP)
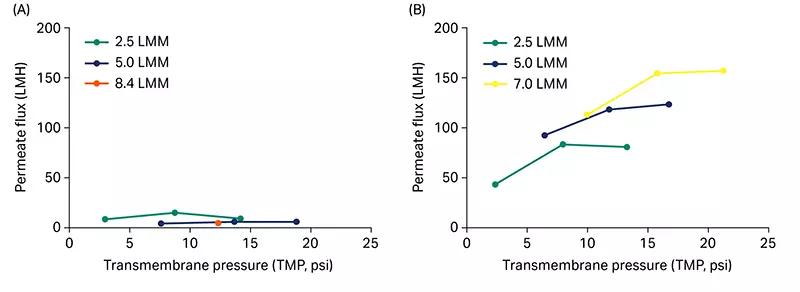
Enzymatically capped RNA was encapsulated into LNPs that have a custom lipid composition of cholesterol and ionizable, helper, and stabilizer lipids using a Nanoassemblr™ Blaze™ nanoparticle formulation system. We mixed the lipid cocktail in ethanol with RNA (in 0.1 M sodium acetate, pH 4.0) at a 1:3 reagent ratio followed by dilution with 1× PBS (pH 7.4). To investigate the effect of membrane chemistry on TFF performance with RNA-LNPs, initial permeate flux excursions were conducted using 100 kDa Omega™ and Delta membrane cassettes that contain polyethersulfone (PES) and regenerated cellulose (RC) membranes, respectively. PES membrane cassettes showed high fouling with flux under 20 LMH and no dependency on feed flow rate or TMP (Fig 6A) whereas the RC membranes showed up to 157 LMH (Fig 6B) at a feed flow rate of 7 LMM. Based on these initial observations, RC membrane cassettes were chosen for further studies.
Fig 6. Flux excursion curves for RNA-LNPs using our Omega™ (polyethersulfone) 100 kDa (A) and Delta (regenerated cellulose) 100 kDa (B) membrane cassettes at three different feed flow rates.
Fresh RNA-LNPs were then used to run flux excursions on Delta and Hydrosart membrane cassettes in triplicate. Permeate flux vs TMP curves showed higher flux for Delta compared to Hydrosart membrane cassettes across the range of conditions tested (Fig 7A and 7B). At 7.5 LMM, we observed that the Delta membrane cassettes had a 1.8-fold higher limiting flux (161 LMH) compared to the Hydrosart (91 LMH) membrane cassettes (Fig 7C).
Fig 7. Flux excursions with mRNA-LNPs. Permeate flux vs TMP curves for Delta (A) and Hydrosart membrane cassettes (B) at three different feed flow rates. (C) Comparison of the limiting permeate flux at 7.5 LMM feed flow rate. Three independent cassettes (n = 3) were used for each cassette type. Data represent mean ± S.D., n = 3. ** p < 0.01. Statistical analysis was performed using Student’s t-test (unpaired, two-tailed).
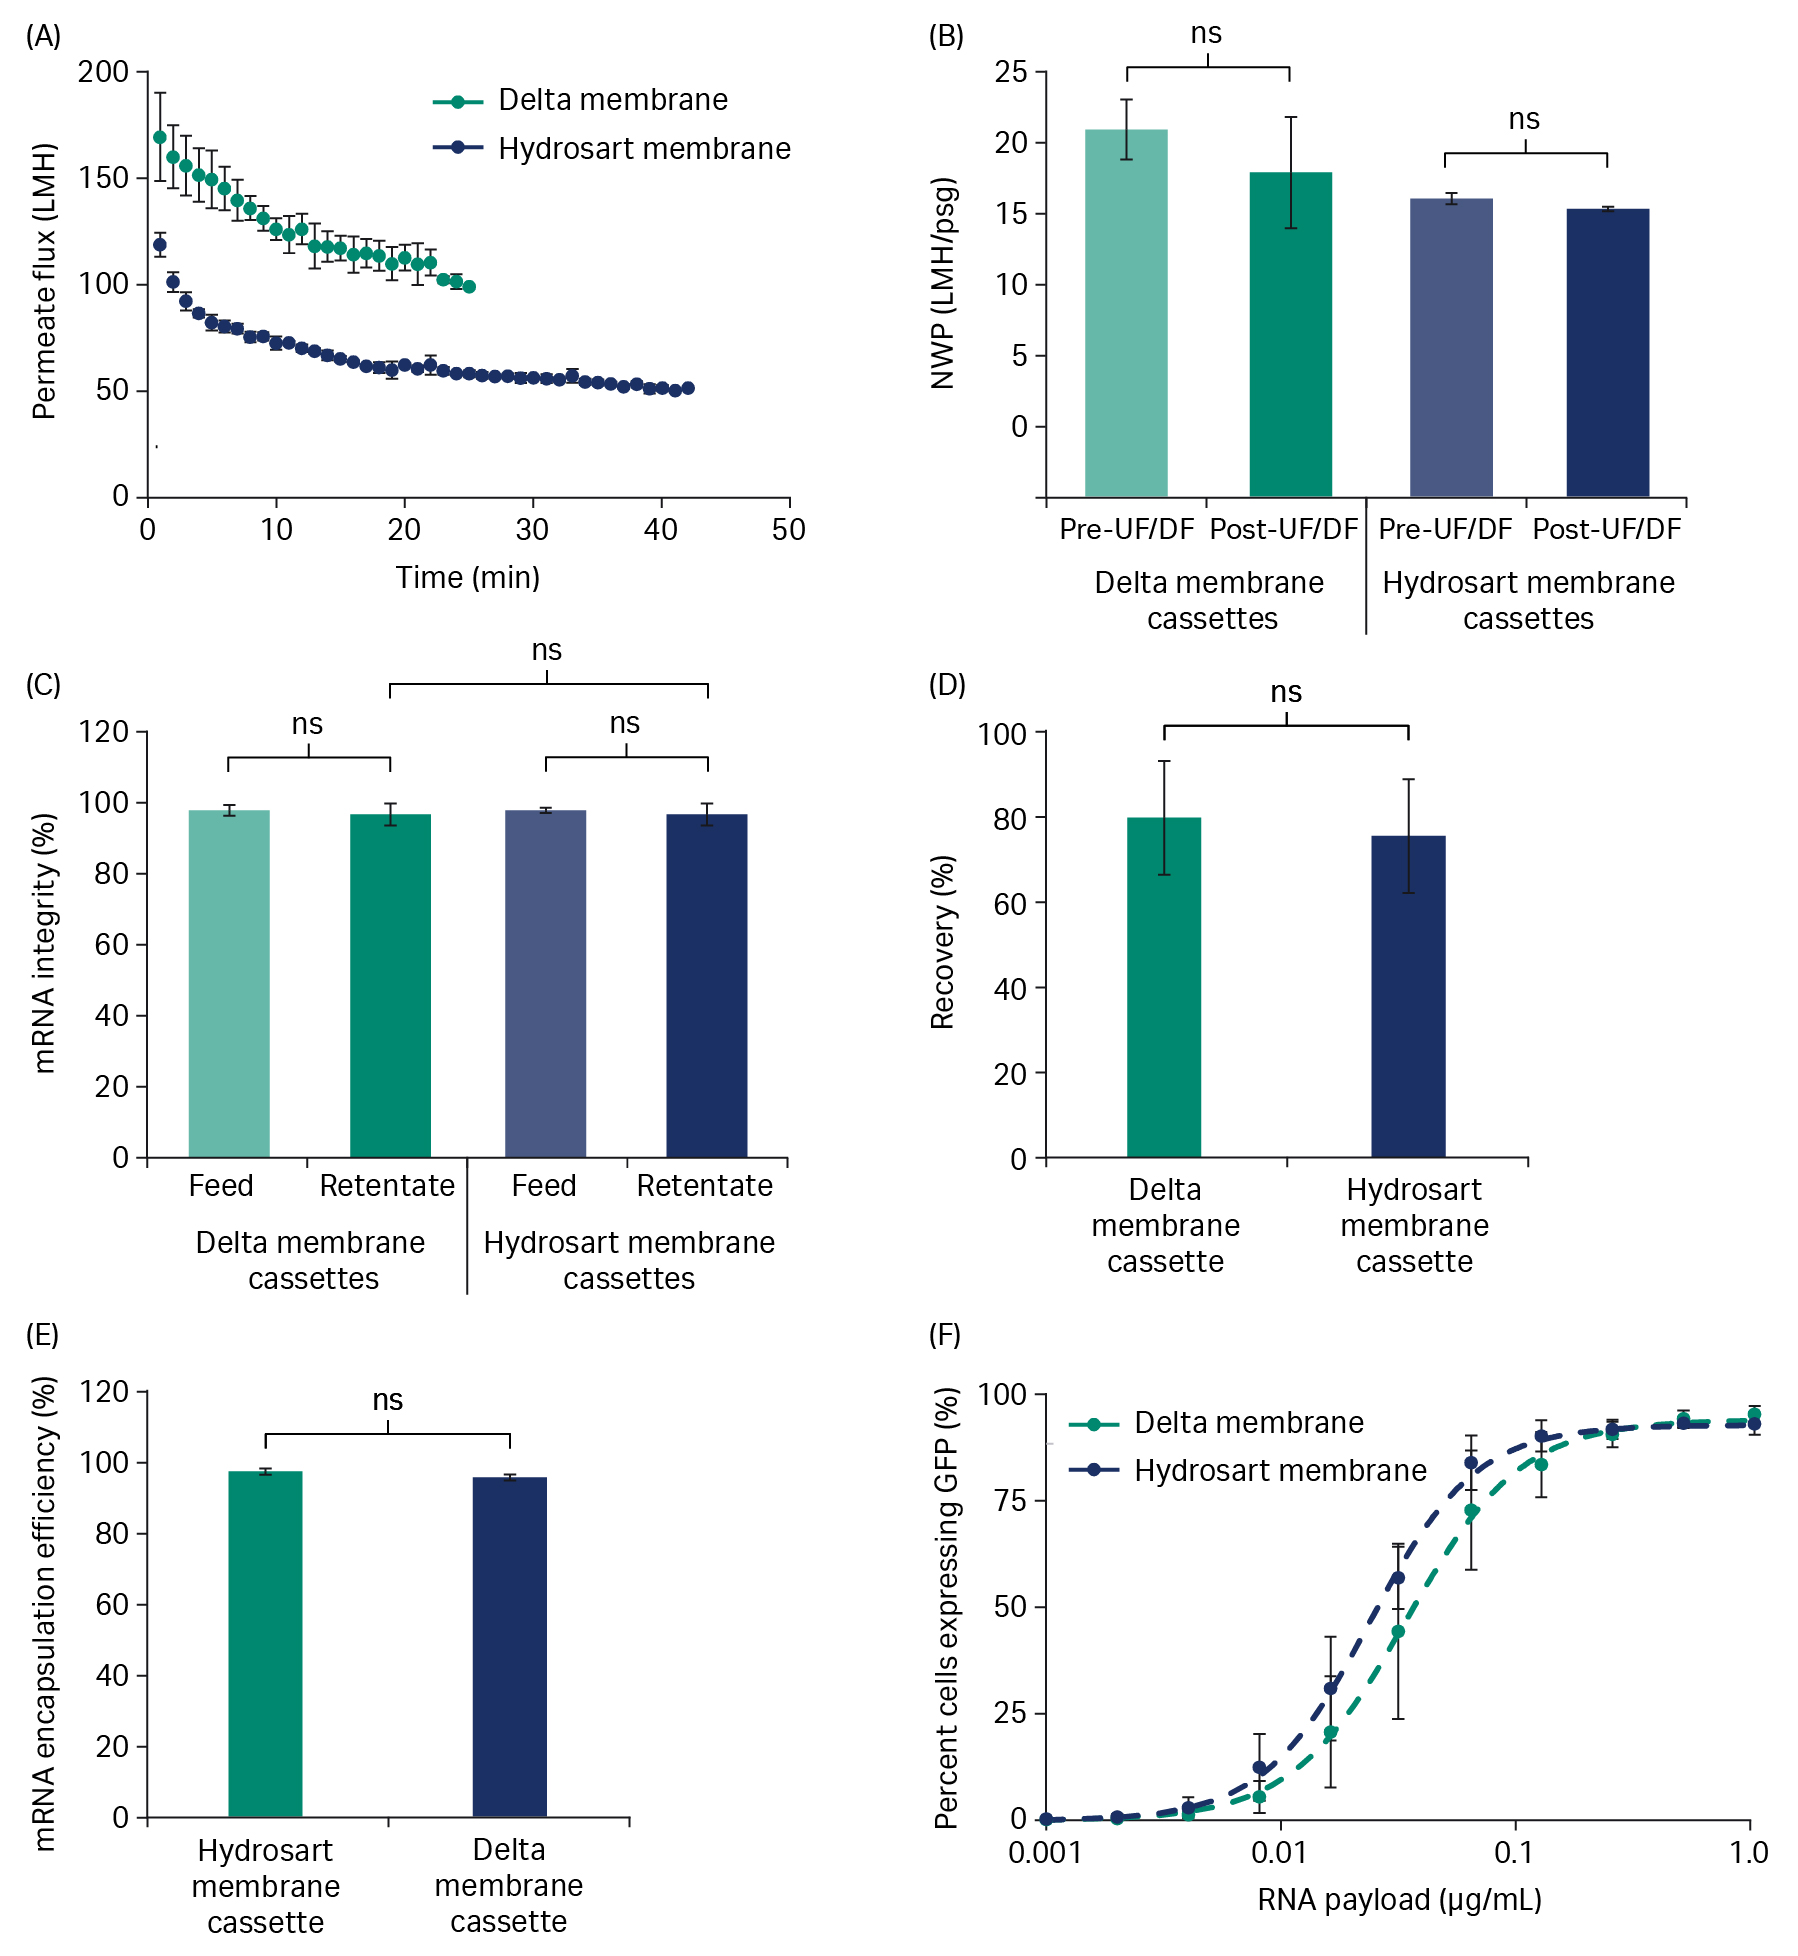
After the encapsulation, we processed the RNA-LNP formulation through UF/DF to obtain the desired RNA concentration, remove the ethanol, and buffer exchange into the final formulation buffer. An 8-fold concentration and 6-DV diafiltration were performed at 7.5 LMM feed flow rate and critical TMP (Delta membrane cassettes, 20 psi; Hydrosart membrane cassettes, 18 psi). At similar loading (34 L/m2 for the Delta membrane cassettes, 28 L/m2 for the Hydrosart membrane cassette) the UF/DF process averaged 40 min for the Hydrosart membrane cassettes whereas the Delta membrane cassettes were 41% faster averaging 24 min (Fig 8A).
NWP was not significantly changed by UF/DF for either cassette (Fig 8B) indicating low fouling. We found that mRNA integrity in LNPs was > 93% and not statistically different between the feed and retentate pools for both Delta and Hydrosart membrane cassettes (Fig 8C). Recovery of mRNA-LNPs after UF/DF was 70% to 80% and was not significantly different between Delta and Hydrosart membrane cassettes (Fig 8D). mRNA encapsulation efficiency was > 95% for both cassette types after UF/DF (Fig 8E). Product retention was > 99.7% for both the cassette types. After we performed sterile filtration, serial dilutions of the formulated mRNA-LNPs were incubated with HEK293 cells and measured for GFP expression via flow cytometry. Dose-response curves are shown in Figure 8F. There was no significant difference between EC50 (concentration of LNPs that gives half-maximal response) values (p > 0.05) for LNPs processed through Delta (0.04 ± 0.02 μg/mL) compared to Hydrosart membrane cassettes (0.02 ± 0.01 μg/mL).
Fig 8. UF/DF performance with mRNA-LNPs. (A) We performed concentration and diafiltration of RNA-LNPs with a diafiltration buffer of 20 mM TRIS and 10% sucrose (pH 7.4). We loaded the Delta membrane cassettes at 34 L/m2 and the Hydrosart membrane cassettes at 28 L/m2. Permeate flux vs time curves are shown for Delta and Hydrosart membrane cassettes tested in triplicate. (B) Normalized water permeability (NWP) at 20°C for before and after UF/DF. (C) mRNA integrity (main peak area) in LNPs from feed and retentate pools. (D) Product recovery from the retentate pools after UF/DF. (E) mRNA encapsulation efficiency of the retentate pools after UF/DF. (F) Dose-response curve of GFP-expressing HEK293 cells with formulated mRNA-LNPs. Curve fits based on the sum of residual square analysis using the Hill equation. Three independent cassettes (n = 3) were used for each cassette type; data represent mean ± S.D., n = 3. p-value: ns = not significant (p > 0.05). Statistical analysis was performed using Student’s t-test (unpaired, two-tailed).
Process development example
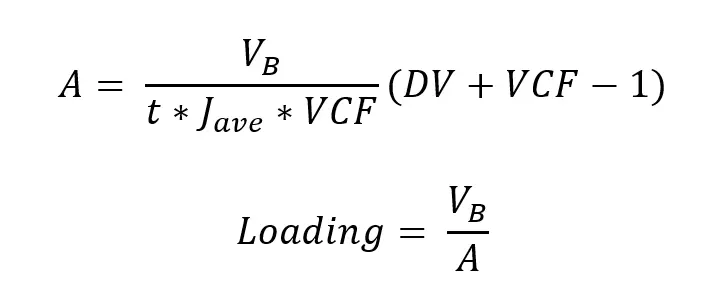
Flux excursions (like those shown in Fig 2, 4, 6, and 7) are commonly used during process optimization to select input parameters such as membrane chemistry, MWCO, feed flow rate, and TMP. If the desired volumetric concentration factor (VCF) and number of DV for buffer exchange are known, your next step is typically to run the process at bench scale and record permeate flux over time (similar to the data shown in Fig 3A, 5A, and 8A). Averaging the recorded flux over time (Jave) provides all the inputs necessary to estimate the appropriate loading for your process, and the filter area required for scaling up:
Where A is the required filter area, VB is the batch volume to be processed, and t is the desired processing time for the batch (not including time for flushing and any recovery chase).
Taking the LNP process in Figure 8 as an example — the process included an 8-fold concentration, a 6-DV diafiltration, and the bench-scale experiment gave Jave of 126 LMH. Processing a hypothetical 250 L batch of LNPs in 2 h would therefore require ≥ 1.6 m2 of filter area at a loading of ≤ 155 L/m2.
T-series cassettes with Delta 100 kDa membrane are available in a wide range of filter areas to allow for bench-scale process development, pilot-scale processing, and large-scale manufacturing (Table 2). These cassettes can also be stacked to create filter areas in between cassette sizes and > 2.5 m2 for large-batch manufacturing. For additional help with process optimization and scale-up, please reach out to your local Cytiva field support representative, cytiva.com/contact.
Table 2. T-series cassette sizes with Delta 100 kDa membrane
| Product family | Product number | Filter area |
| Centramate™ | DC100T01 | 93 cm2 |
| DC100T02 | 186 cm2 | |
| DC100T12 | 0.1 m2 | |
| Centrasette™ | DC100T06 | 0.5 m2 |
| DC100T26 | 2.5 m2 |
Conclusions
Our data demonstrate the efficacy of the Delta 100 kDa TFF membrane cassette for use in mRNA, saRNA, and LNP processing. In all processes, we observed no significant difference in NWP after DF or UF/DF processing indicating low membrane fouling. There was also no significant difference seen in mRNA integrity across all processes tested, indicating these cassettes were not imposing excessive shear on these constructs. Step yields for the Delta membrane cassette averaged between 80% and 94% across the constructs tested. Finally, for the three constructs tested, the limiting flux was 1.8 to 1.9-fold higher for Delta compared to a similar 100 kDa RC membrane cassette (Sartocon Hydrosart E screen). These higher limiting fluxes provided faster processing times in all processes evaluated and could translate to either faster manufacturing or cheaper manufacturing by using less TFF area for a given batch size.
Buy now Watch 30 minute webinar
References
- Daniel S, Kis Z, Kontoravdi C, Shah N. Quality by Design for enabling RNA platform production processes. Trends Biotechnol. 2022 Oct;40(10):1213-1228. doi: 10.1016/j.tibtech.2022.03.012.
- Schoenmaker L, Witzigmann D, Kulkarni JA, Verbeke R, Kersten G, Jiskoot W et al. mRNA-lipid nanoparticle COVID-19 vaccines: Structure and stability. Int J Pharm. 2021 May 15;601:120586. doi: 10.1016/j.ijpharm.2021.120586.
- Oude Blenke E, Örnskov E, Schöneich C, Nilsson GA, Volkin DB, Mastrobattista E, et al. The storage and in-use stability of mRNA vaccines and therapeutics: Not a cold case. J Pharm Sci. 2023 Feb;112(2):386-403. doi: 10.1016/j.xphs.2022.11.001.
- Packer, M., Gyawali, D., Yerabolu, R. et al. A novel mechanism for the loss of mRNA activity in lipid nanoparticle delivery systems. Nat Commun. 2021 12;6777. https://doi.org/10.1038/s41467-021-26926-0
- White P. Moderna Science and Technology Day. Published 2022. Accessed 31 Jan 2024. https://s29.q4cdn.com/435878511/files/doc_presentations/2022/05/Sci ence-Day-2022-Master-Slides-FINAL-(05.17_7am).pdf.
CY42341-120324-AN


