Sugar Quality Control: Polarimetry
The sugar manufacturing process consists of a series of steps in which raw sugar is purified to produce granulated sugar and other refined products. The value of these products depends on meeting specific requirements for sucrose content, color, and other measures. Maximizing efficiency and accuracy in quality control (QC) of a sugar refinery is key to meeting these requirements.
What determines the quality of raw sugar?
Sucrose content and purity strongly influence the price paid by sugar mills or refineries. To measure these properties, organizations such as the International Commission for Uniform Methods of Sugar Analysis (ICUMSA) publish methods for quality assessment in the manufacturing process. For labs performing these tests, speed and accuracy of measurements influence efficiency.
Sucrose content is measured with a polarimeter. For accurate analysis, particulates and other optically active substances need to be removed. This step is typically accomplished by clarification using lead acetate or a nonhazardous agent, followed by gravity filtration.
How does the choice of filter paper impact sugar QC testing?
Different filter papers might meet the required specifications for sugar filtration and produce similar polarimetry results. But they could also vary in filtration speed. To ensure that QC goes as quickly and smoothly as possible, filter choice matters.
An independent study, carried out by Salamon and Seaber Ltd., London, UK, investigated three different filter papers for their suitability for QC sample preparation of raw sugar in ICUMSA method GS 1/2/3/9-1. The tests compared consistency of the polarimetry measurements as well as filtration time.
The results, as shown in Figure 1, indicated no significant differences (p > 0.05) between the three tested papers in the consistency of polarimeter measurements. Filtration speed, however, did vary significantly (p < 0.001).
In these tests, the filtration time ranged from almost 70 minutes to under 20 minutes, with the shortest time achieved by the Whatman brand Grade 91 filter paper (Fig 2). This is approximately a three-fold increase in filtration speed, providing the opportunity for throughput improvements in QC analyses.
Sugar QC analysts can use the data from this independent study to improve their own workflows. The results demonstrate that achieving significant reductions in filtration time is possible without compromising filtration efficiency or consistency.
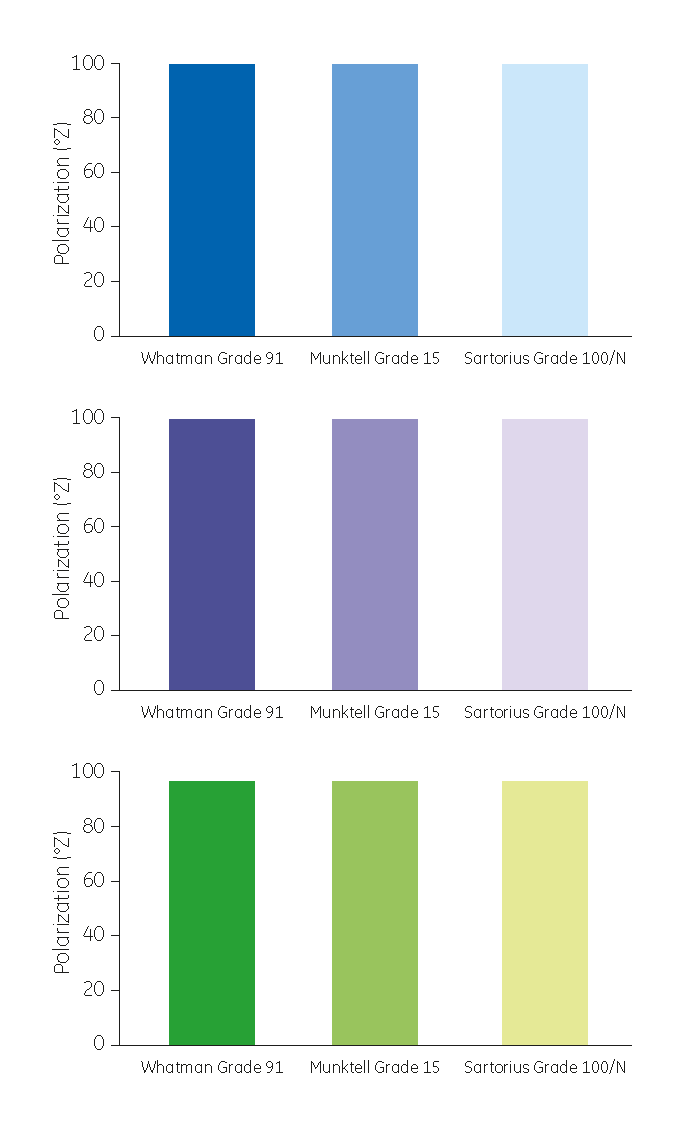
Fig 1. Optical rotation of 30 mL raw sugar solution samples after filtration.
Samples are from A) Brazil B) Zimbabwe C) Guyana. Each bar represents the average of 10 replicates. Results were highly repeatable for all three filter types. Analysis using one-way analysis of variables.
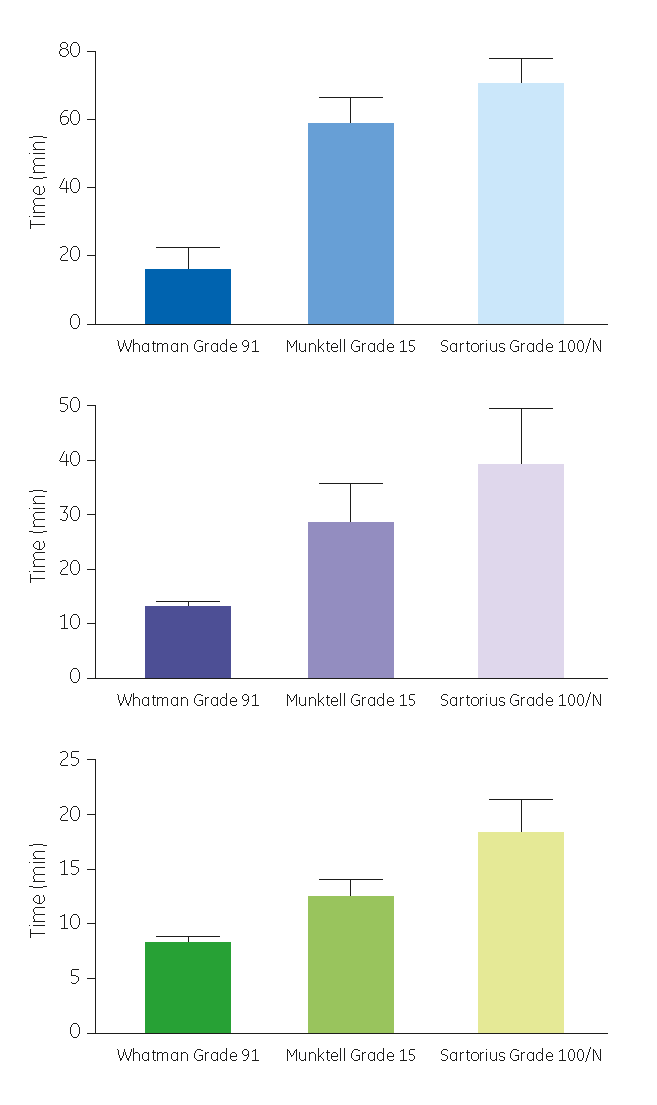
Fig 2. Filtration time of 30 mL raw sugar solution samples using three filter papers (n=10). Filter selection significantly influences filtration speed (p < 0.001).
Analysis using one-way analysis of variables. Sugar samples from Brazil (blue) Zimbabwe (purple) Guyana (green).
The data used to support this study was performed at Salamon and Seaber in 2014 and 2015. It can be made available upon request.
Resources:
Application Note - Comparative analysis of filter papers used in the sugar industry (PDF)
Try our Whatman Filter Selector App to find out if you are using the most appropriate filtration solution for your samples. To discuss any challenges you are facing, please contact Scientific Support.
Related Documents