Introduction
Capillary iso-electric focusing (cIEF) offers a way to obtain a high resolution of protein charge variants with similar pI values, e.g., for different antibody charge variants. This technique has been used for quality control of monoclonal antibodies (mAb) for many years (1). The formation of a smooth pH gradient during cIEF requires a mixture of many different amphoteric compounds covering the pH region of interest.
In this study Pharmalyte™ carrier ampholytes, a mixture of 600 to 700 different amphoteric compounds, was used as the ampholyte. Pharmalyte™ carrier ampholytes offers several different pH ranges to choose from, with one wide gradient covering pH 3 to10 and four narrow gradients covering most applications. It is also possible to mix different Pharmalyte™ carrier ampholytes to tailor the gradient as needed. There has been some discussion regarding batch-to-batch variation of ampholytes with respect to pI determination. We tested 19 different batches of Pharmalyte™ 3–10 to understand batch-to-batch variation. We present the results of using different calibrants and focusing times for determining the pI of a target molecule. In addition, we performed a comparison using Pharmalyte™ 8–10.5.
Material and methods
The electrolyte kit used for this study consisted of: 0.1 M sodium hydroxide and 80 mM phosphoric acid in 0.1% methyl cellulose (PN 102506), 1% methyl cellulose (PN 101876), cIEF cartridge (PN PS-MC02-C), cIEF calibrants 3.38, 4.05, 5.85, 6.14, 7.05, 8.40, and 9.99 (PN 046-028 to 034), cIEF fluorescent calibration standard (PN 046-025), L-arginine (Sigma Aldrich, PN A5006-100), iminodiacetic acid (Sigma Aldrich PN 220000-25G), adalimumab, Maurice™ glass reagent vials 2 (PN046-017), Maurice™ 96-well plate (PN 046-021), Maurice™ clear screw caps (PN 046-138), Maurice™ blue pressure caps (PN 046-573).
The Maurice™ unit from ProteinSimple (PN 090-000) was used for the separations performed. Data acquisition and processing was performed using iCE Compass Software. Pharmalyte™ 3-10 (PN 17045601) and Pharmalyte™ 8–10.5 (PN 17045601) were purchased from Cytiva.
The monoclonal antibody adalimumab was purchased from Distansapoteket, (Stockholm, Sweden) and was used to demonstrate the resolution and reproducibility of the cIEF when using the different Pharmalyte™.
The separation protocol used for the 3–10 samples was 1500 V for 1 min followed by 3000 V for 2 to 6.5 min. While the separation protocol used for the 8.5–10 samples and the mixes of 8.5–10 and 3–10, was 1500 V for 1 min and 3500 V for 10 min. Each of the injections were performed in duplicate.
Results
In Figure 1 a typical electropherogram for the separation of the mAb adalimumab is shown. However, unlike a normal run seven different calibrants were included in this run to test the effect of using different calibrants when determining the pI values of the target protein. In Figure 2 the peaks of adalimumab are magnified to show the excellent resolution, with a pI difference of around 0.1 pI units.
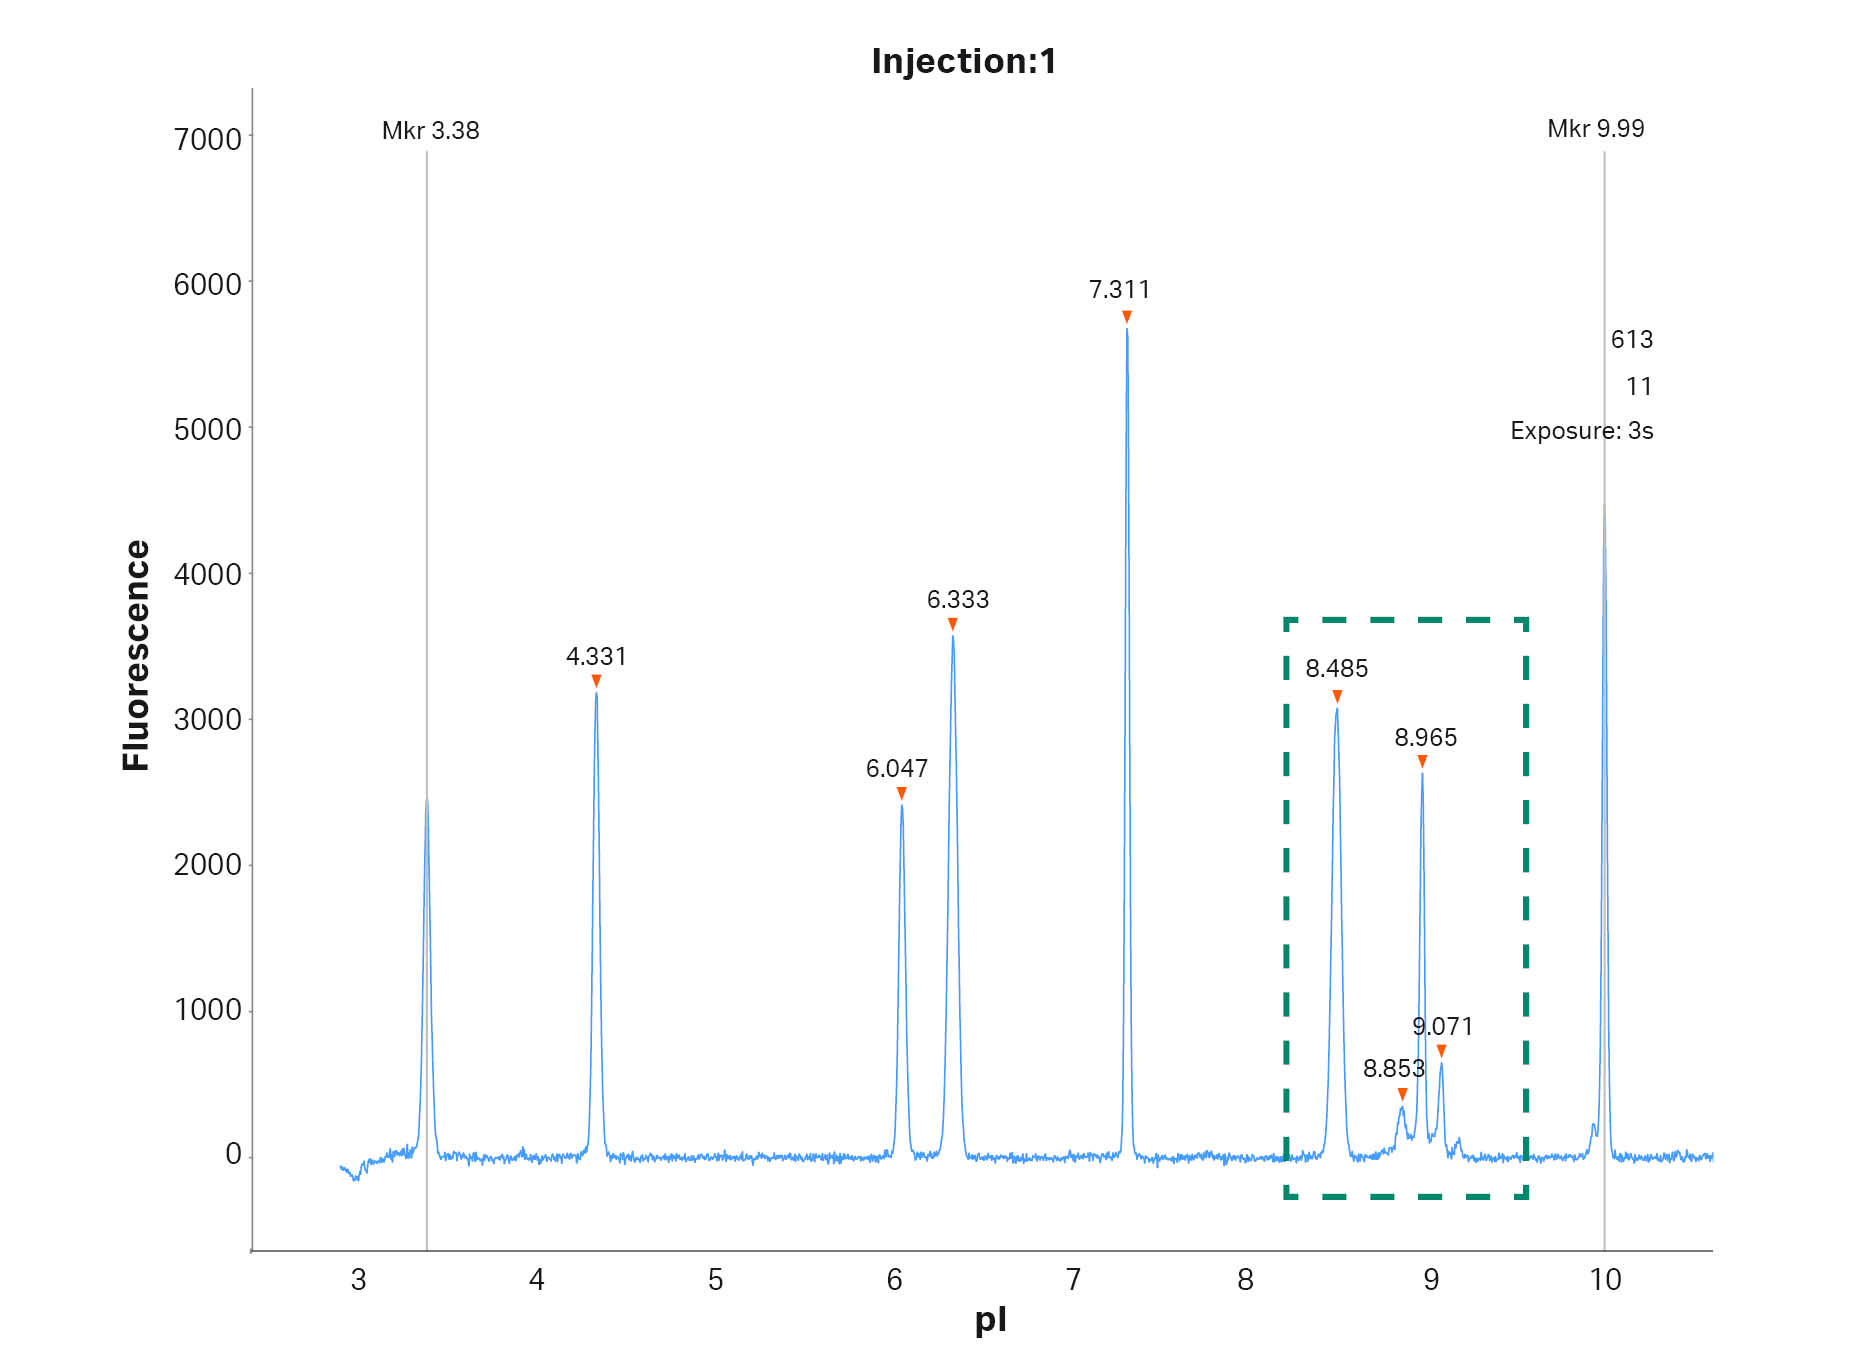
Fig 1. cIEF electropherogram for adalimumab highlighting the typical result obtained using Pharmalyte™ 3–10. Seven different calibrants were included to evaluate their effect on the determined pI.
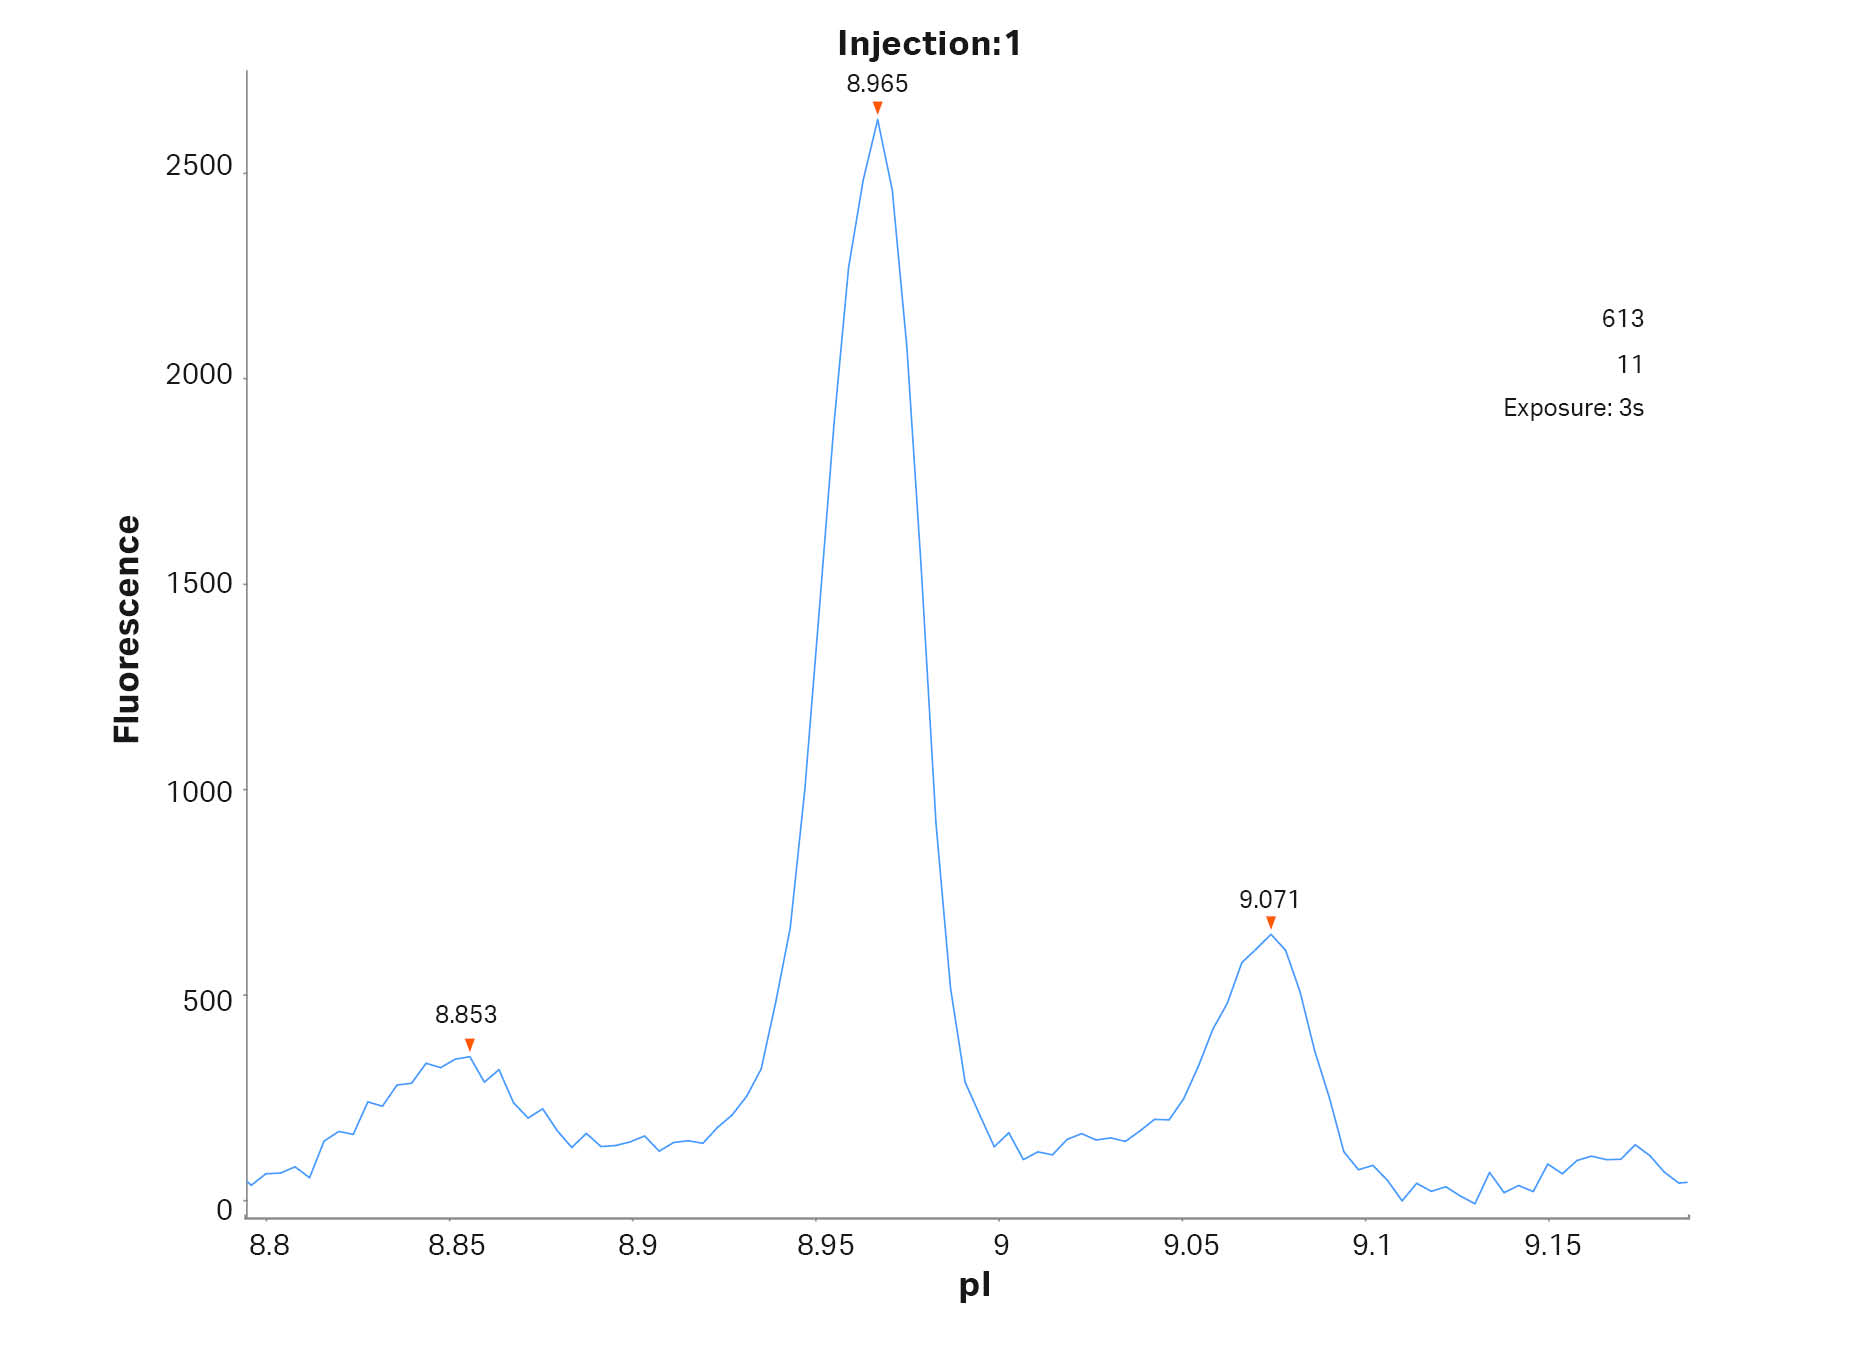
Fig 2. Magnified cIEF electropherogram for adalimumab demonstrating peak resolution of the different charge variants. pI was determined by using calibrant 3.38 and 9.99.
The impact of focusing time on resultant pI
To test the impact of different focusing times on the obtained pI values, runs at four different focusing times were performed (Fig 3). The linearity when using all the calibrants or without calibrant 3.38 was calculated. It was found that linearity decreased over time when calibrant 3.38 was included.
Compass software (from ProteinSimple) was used for calibrating pI calibrants 5.85 and 6.14 in these runs by using either calibrant 3.38 and 9.99, or 4.05 and 9.99 (Table 1). Since calibrant 3.38 migrated over time towards the anode, the calculated pI values increased by time. It can be seen in Table 1 that the resulting pI values are more stable and closer to the correct value when using pI calibrant 4.05.
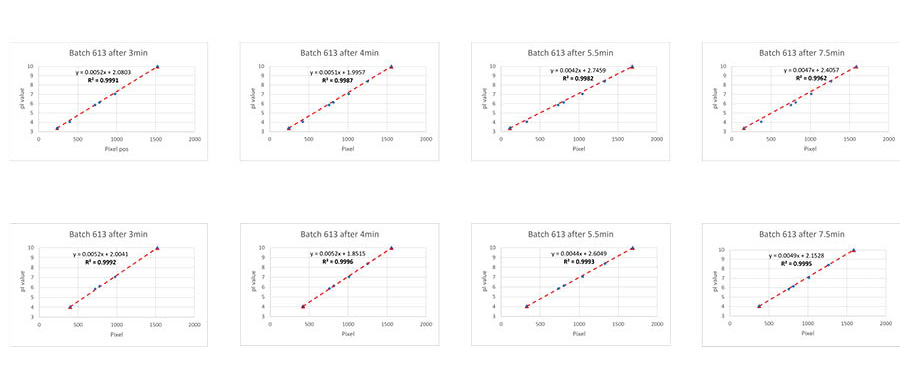
Fig 3. Using pI calibrant for comparison of different focusing times. Different pairs of calibrants were later used for calculating pI for some of the remaining calibrants. Calibrant 3.38 was omitted from the line fit in the lower row of figures.
Table 1. Calibrated pI’s using pI calibrants 3.38 and 9.99 or 4.05 and 9.99.
| Calibrated using 3.38 and 9.99 | Calibrated using 4.05 and 9.99 | |||||||
| Focusing time (min) | Focusing time (min) | |||||||
| pI marker | 3 | 4 | 5.5 | 7.5 | 3 | 4 | 5.5 | 7.5 |
| 5.85 | 5.87 | 5.98 | 6.08 | 6.14 | 5.76 | 5.82 | 5.82 | 5.91 |
| 6.14 | 6.16 | 6.26 | 6.36 | 6.42 | 6.06 | 6.12 | 6.13 | 6.20 |
The benefit of using calibrants close to the target protein
Before calibrating, the positions of the peaks in the electropherograms from different batches of Pharmalyte™ carrier ampholyes can vary, see Figure 4a. However, after calibrating the pI values, these differences decrease, see Figure 4b and 4c. A common way to calibrate is to use extremely acidic and basic calibrants to cover the entire gradient and to not disturb the sample peaks.
The problem with this approach is that the extreme pH values are difficult to keep stable in cIEF as well as in gel-based IEF. Also, small local deviations in the pH gradient may lead to deviating pI values. Using pI calibrants as close to the target protein as possible gives a much more reliable pI determination (see Fig 4b and 4c). Using calibrant 4.05, 8.40, and 9.99 gave a very small variation of the target protein pI when comparing the different Pharmalyte™ carrier ampholye lots, see Figure 4c. The Compass software uses point-to-point calibration which means that the software creates a straight calibration line between calibrant 1 to 2 and another straight line between calibrant 2 and 3. This gives the option to use three without disturbing the adjacent pH-region.
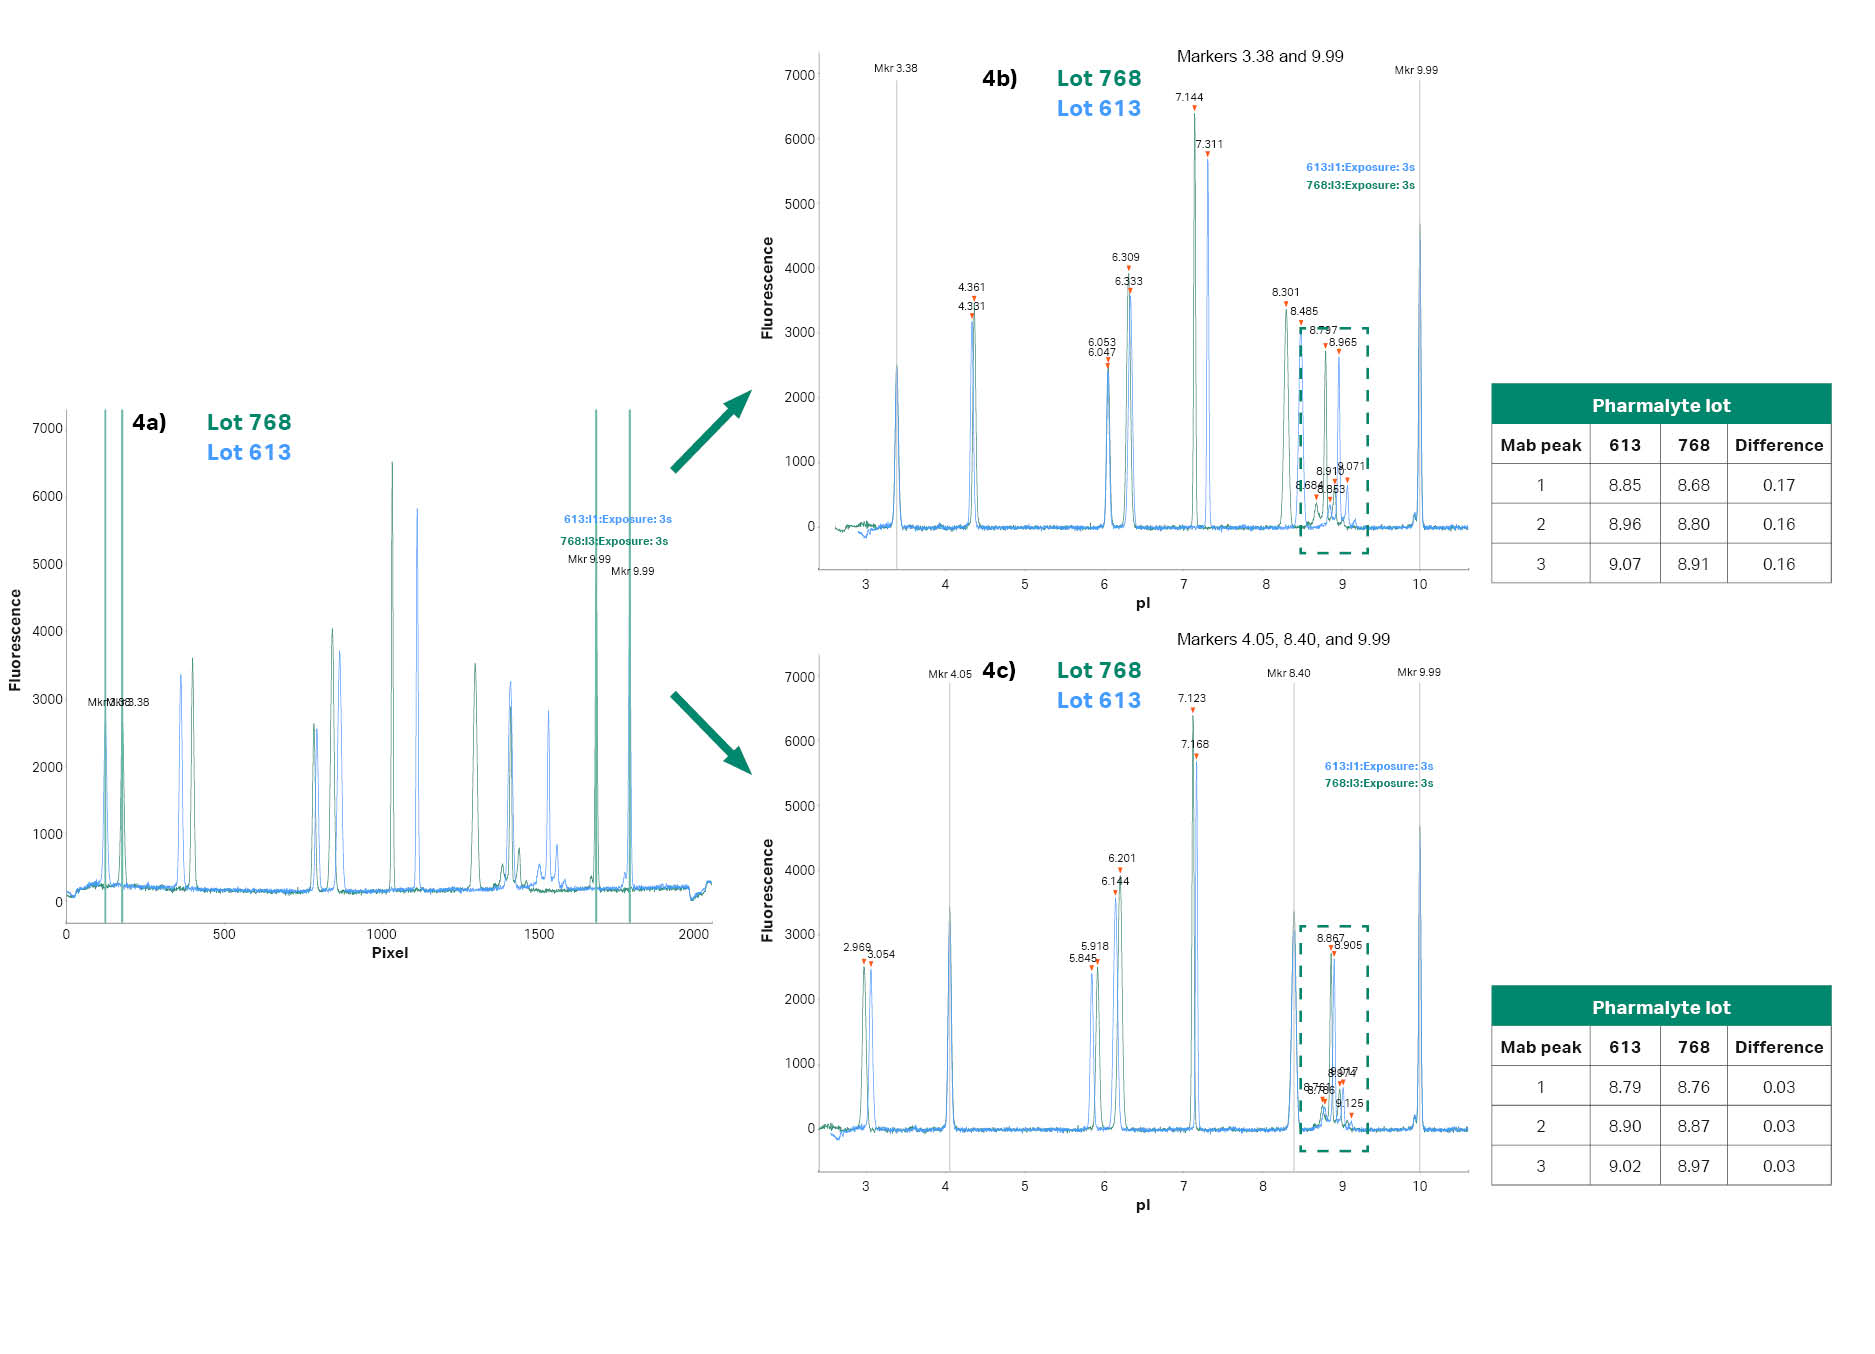
Fig 4. (a) shows the pixel positions, (b) the pI values when calibrated using pI calibrants 3.38 and 9.99, and (c) the pI calibrants 4.05, 8.40 and 9.99 was used for the calibration. The obtained pI’s of the mAb peaks are indicated in the tables.
Batch-to-batch comparison
After these findings, analysis of adalimumab was performed using 19 different batches of Pharmalyte™ 3–10. The pI of the main peak using the different batches can be seen in Figures 5 and 6. When using the extreme calibrants 3.38 and 9.99 the difference between the highest and lowest pI determinations was 0.21 pH units and the CV was 0.52. However, when using pI calibrants 8.4 and 9.99 the maximum difference was decreased to 0.05 pH units and the CV to 0.17.
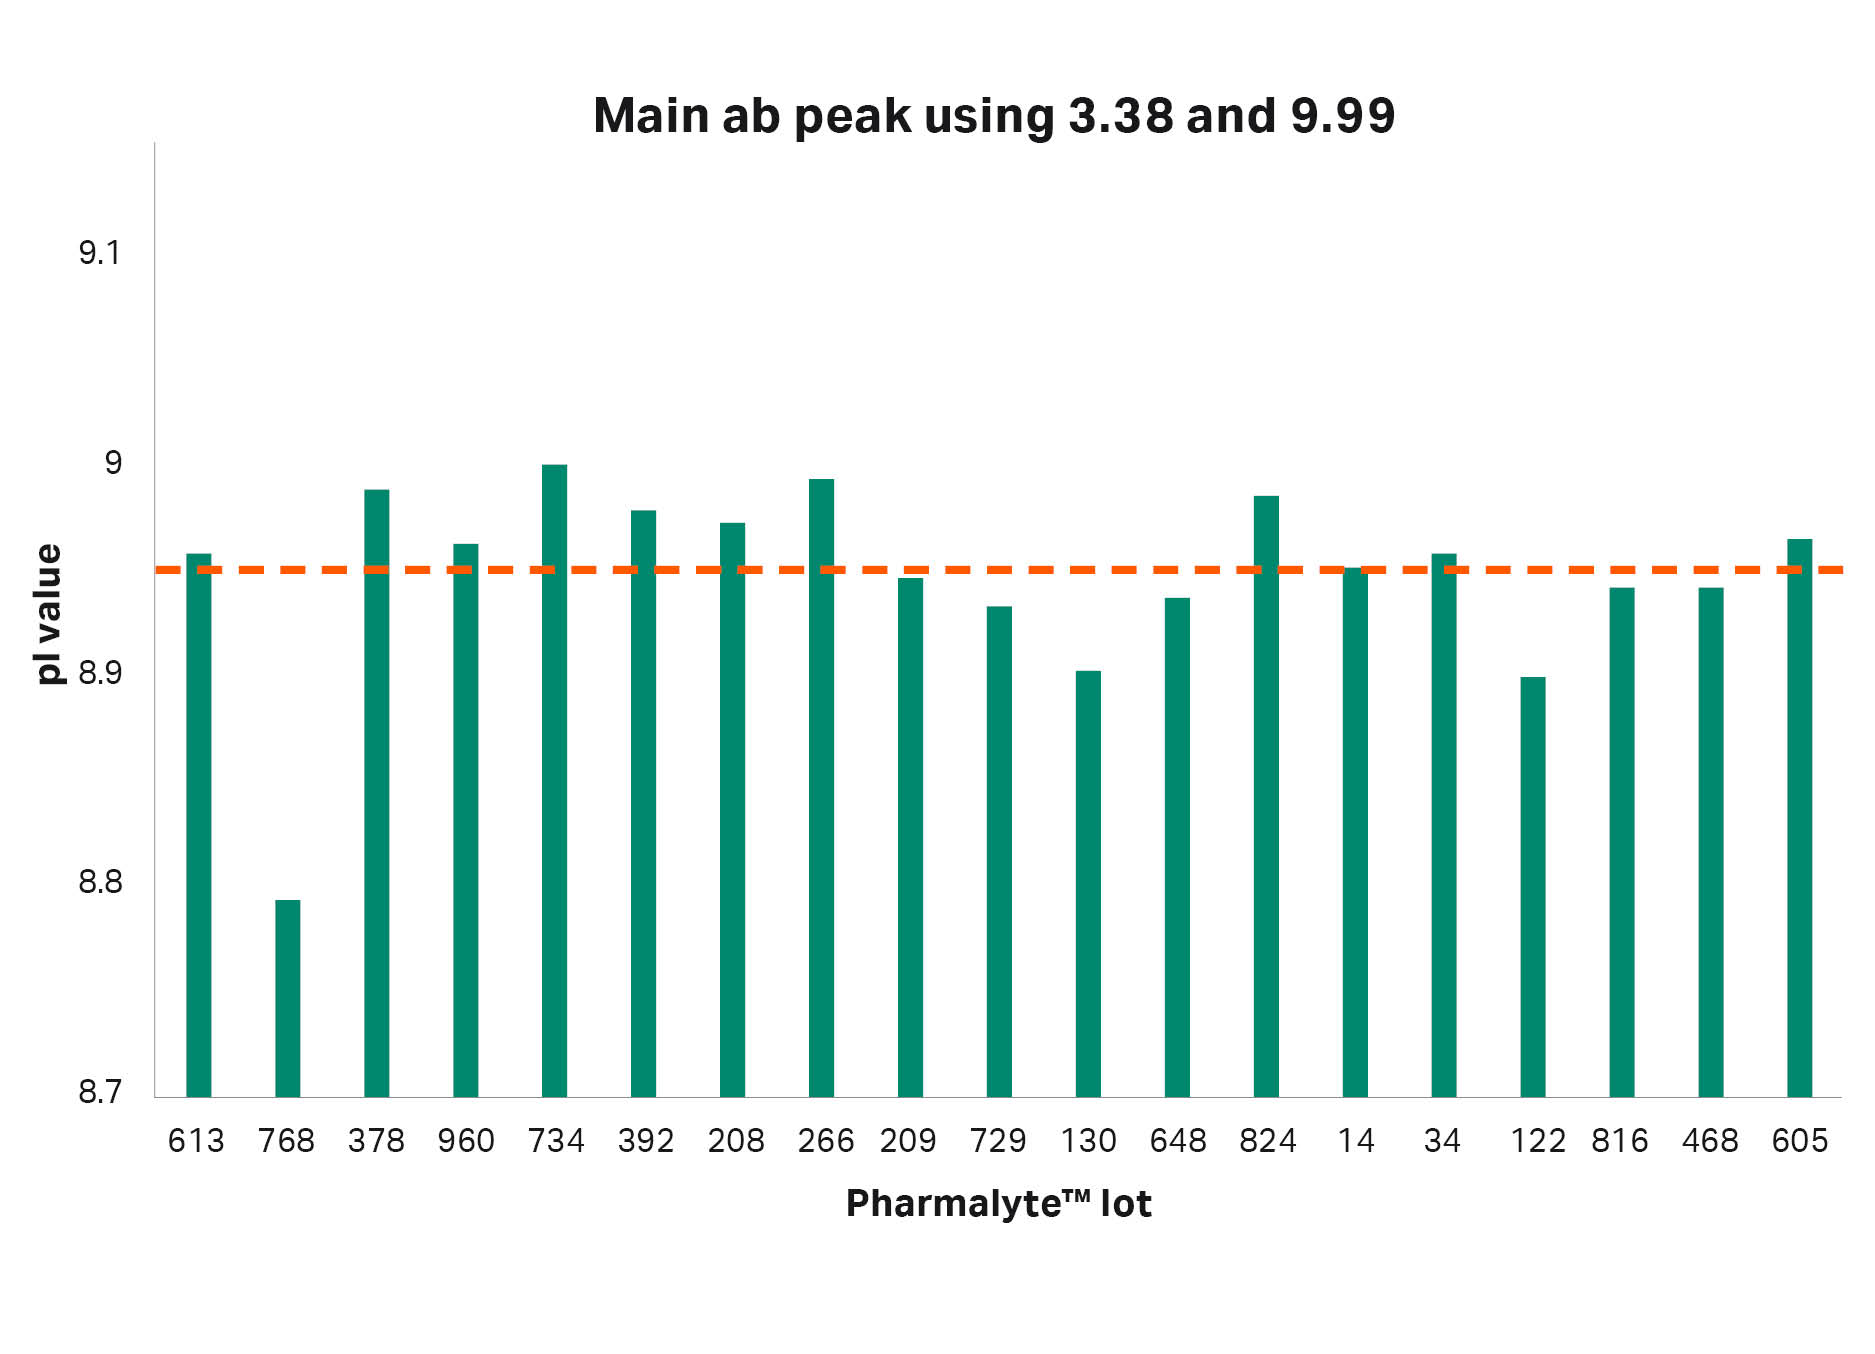
| Average | Min | Max | Max-Min | CV |
| 8.95 | 8.79 | 9.00 | 0.21 | 0.52 |
Fig 5. The pI values for the main antibody peak when using pI calibrants 3.38 and 9.99. Average pI value indicated by the dotted red line.
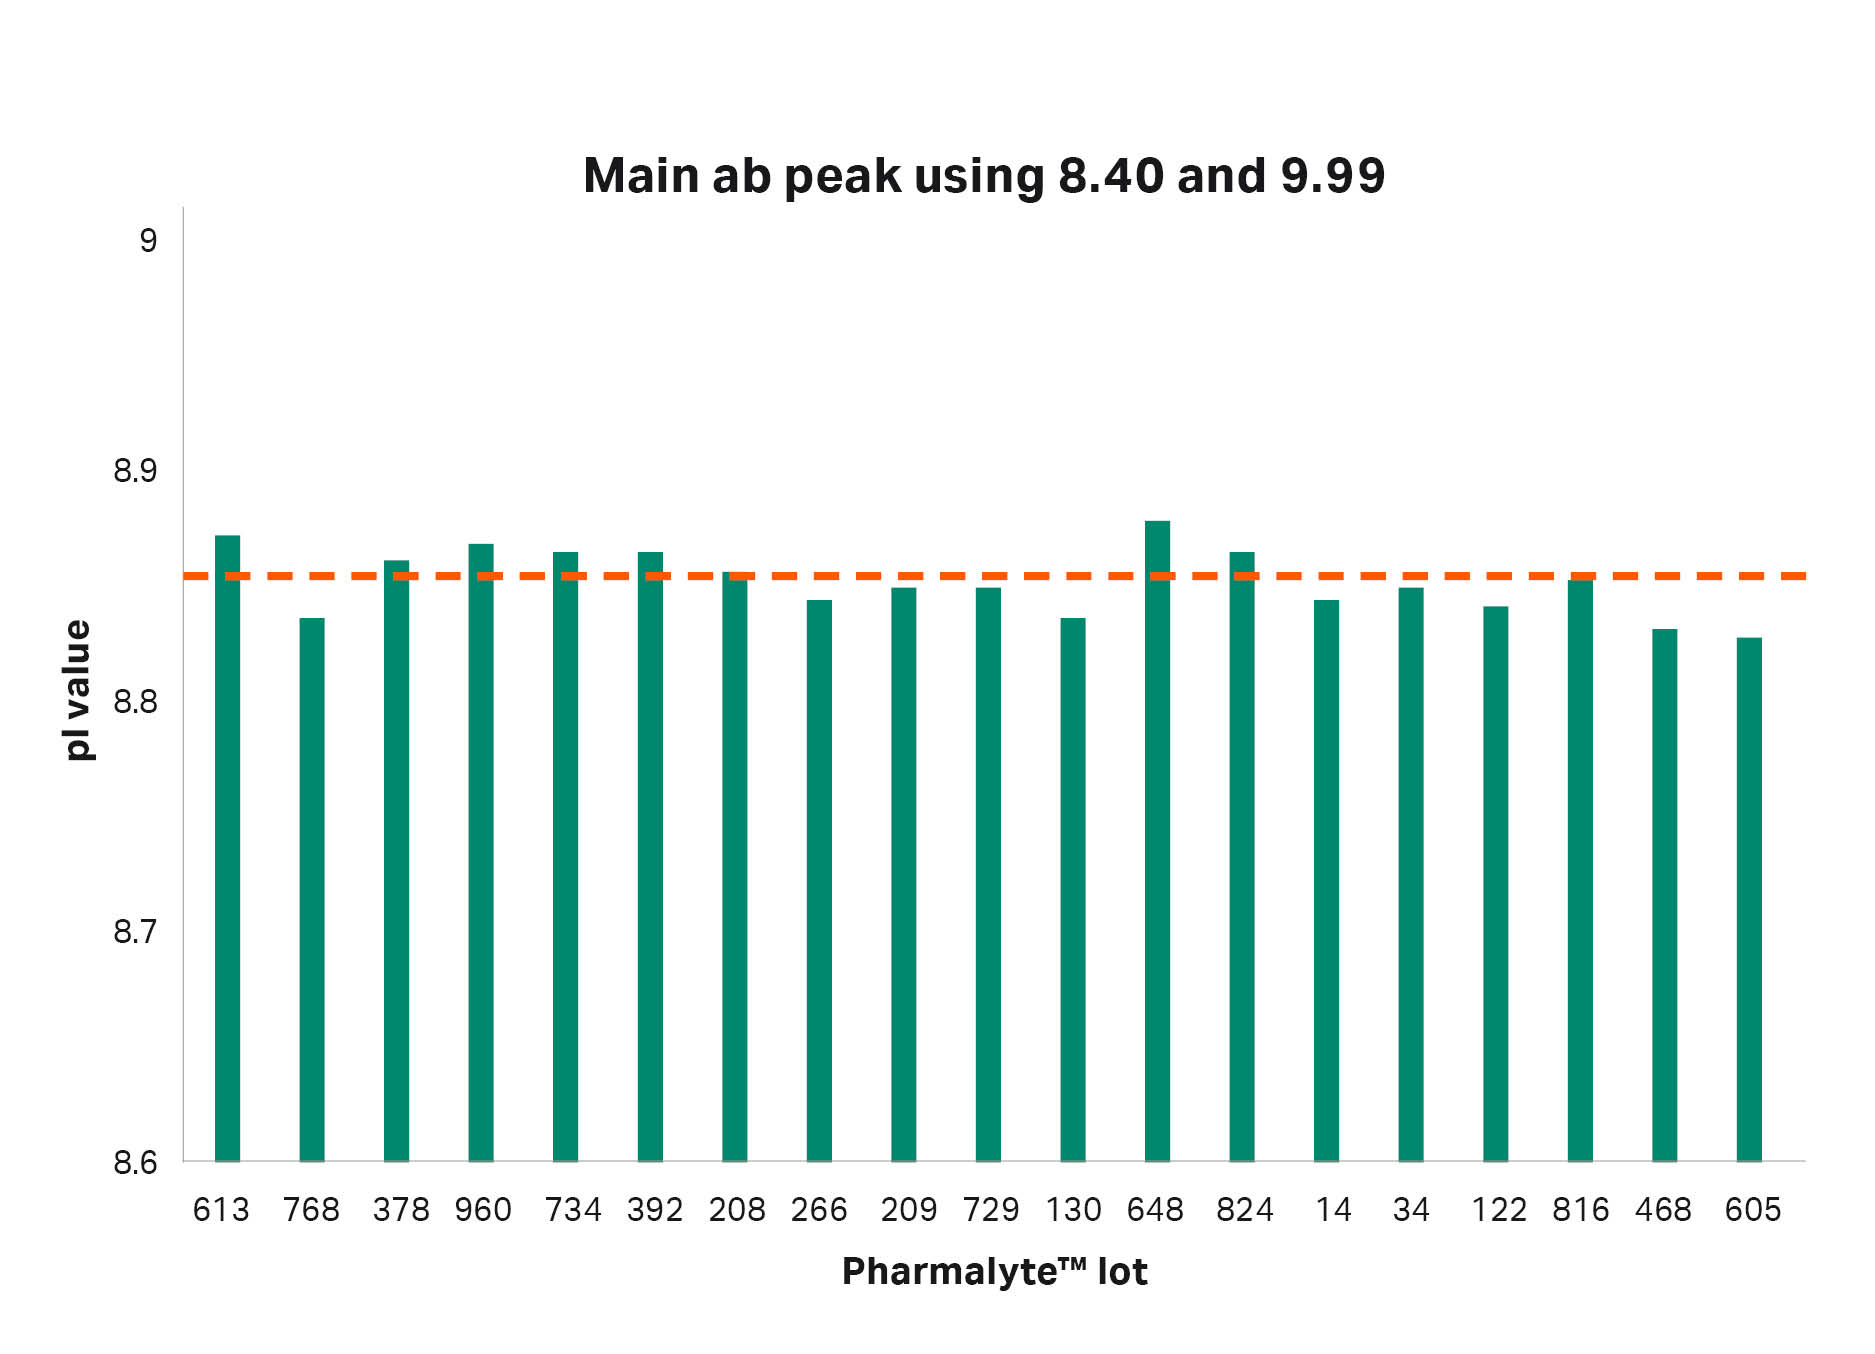
| Average | Min | Max | Max-Min | CV |
| 8.85 | 8.83 | 8.88 | 0.05 | 0.17 |
Fig 6. The obtained pI values for the main antibody peak when using pI calibrants 8.4 and 9.99. Average pI value is indicated by the dotted red line.
Comparing Pharmalyte™ 8–10.5, and 8–10.5 and 3–10
Separation using only the narrow basic Pharmalyte™ 8–10.5 was also evaluated, see Figures 7 and 8. This approach gave a better resolved peak pattern for the adalimumab. The obtained pI values were similar to that of Pharmalyte™ 3–10 when using calibrants 8.40 and 9.99 for pI determination.
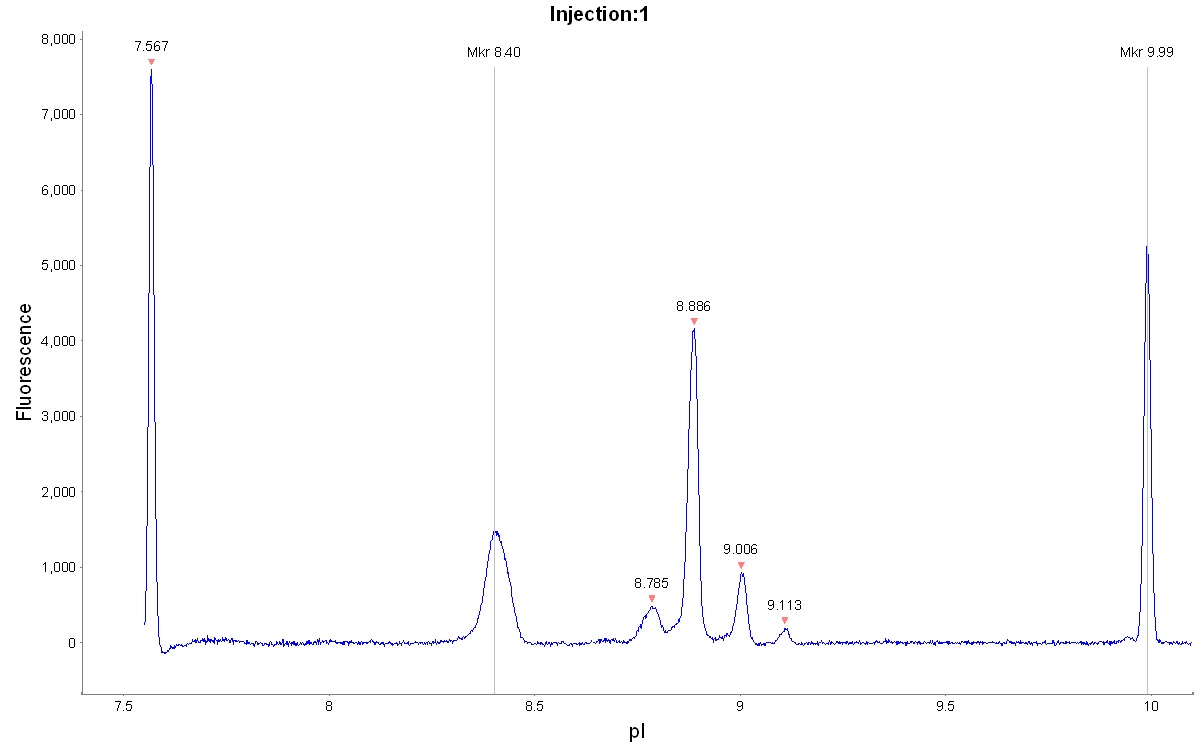
Fig 7. cIEF electropherogram for adalimumab using Pharmalyte™ 8–10.5.
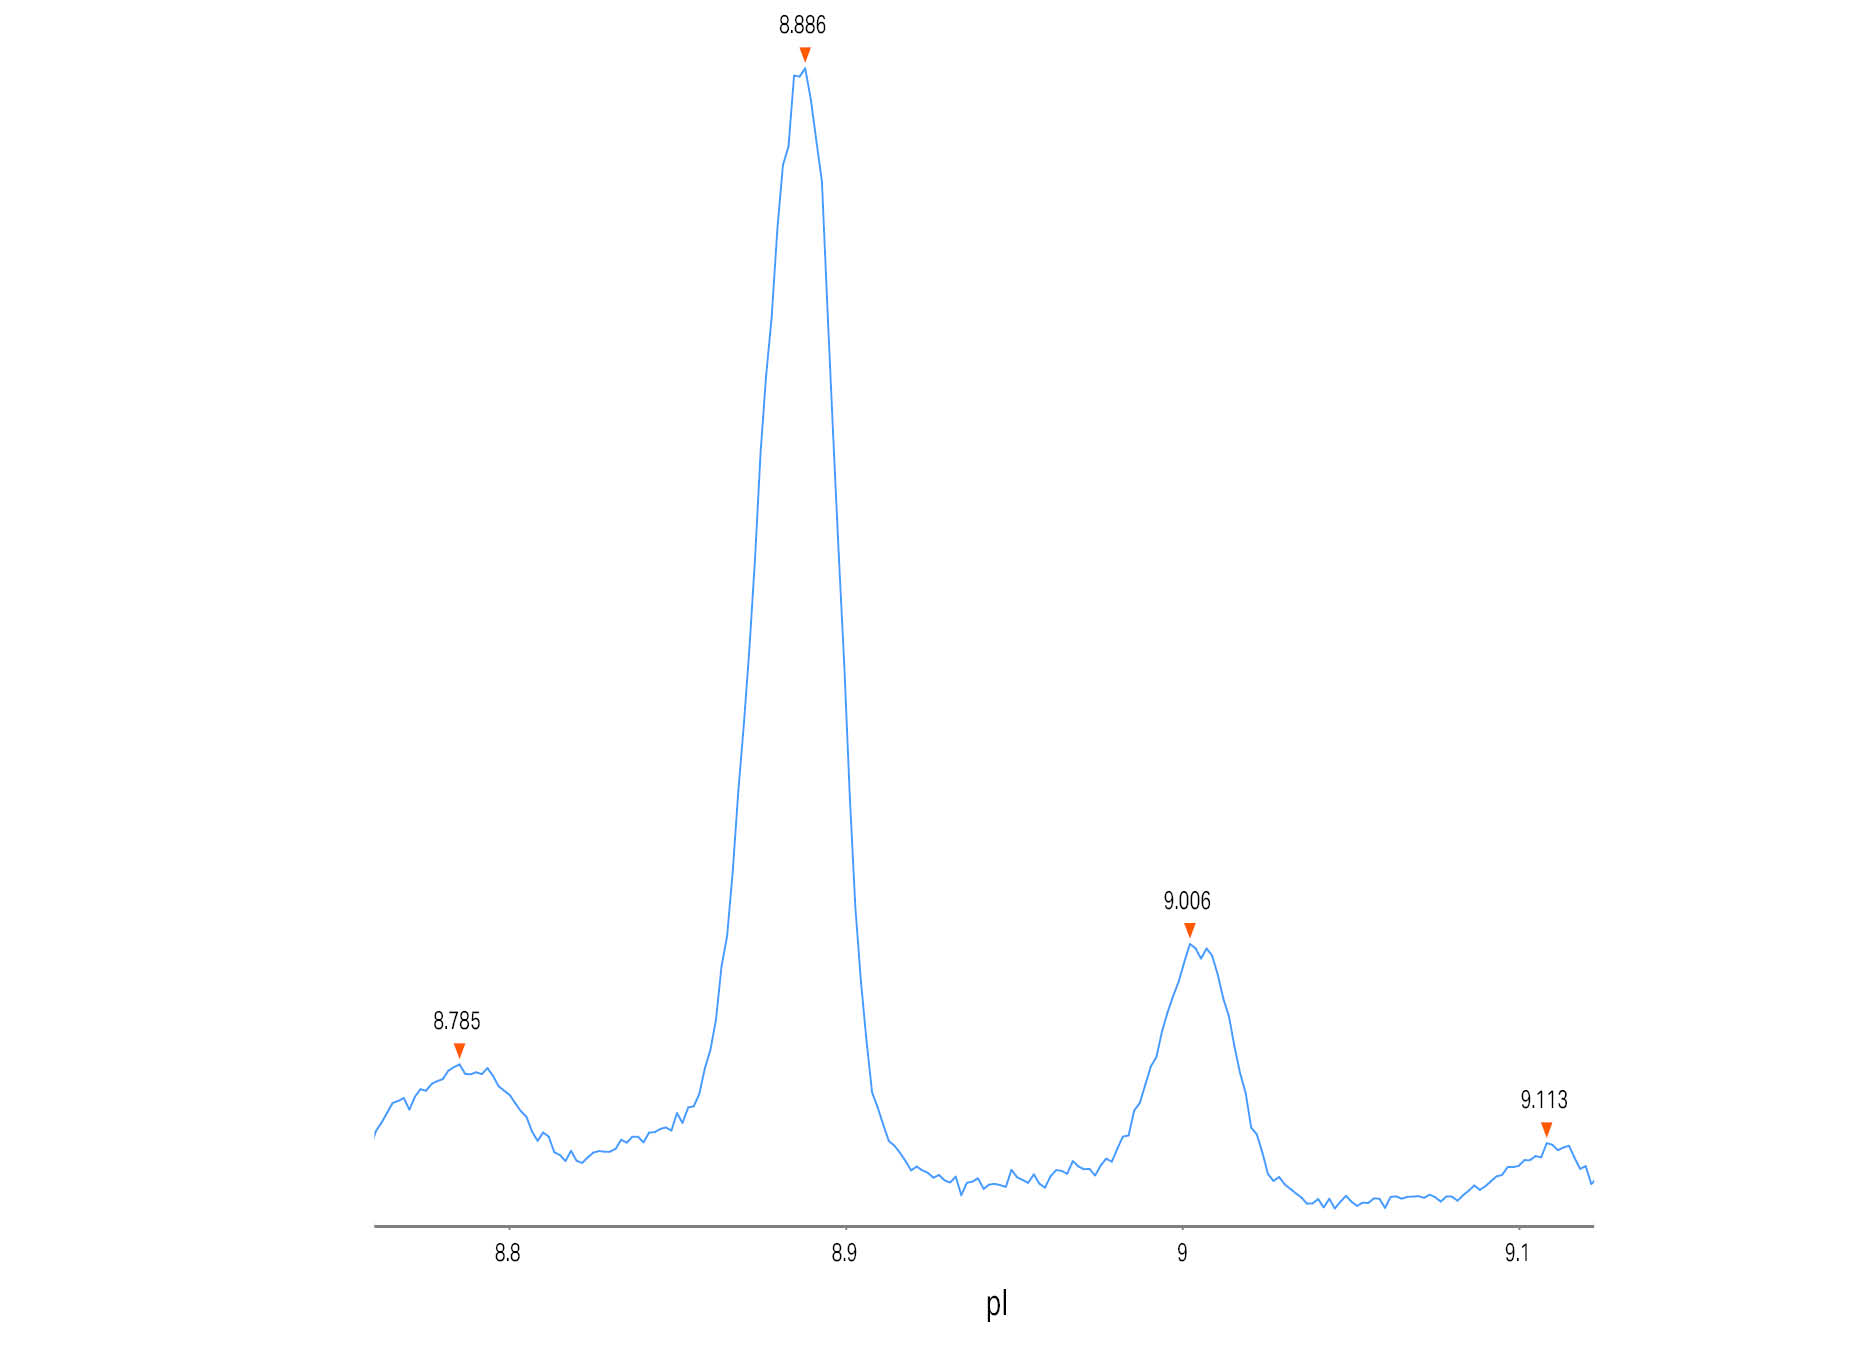
Fig 8. Magnified cIEF electropherogram for adalimumab separated using Pharmalyte™ 8–10.5 showing an increased peak resolution for the target.
Using Pharmalyte™ 8–10.5 requires a longer focusing time and an alternative way to increase the resolution is to mix Pharmalyte™ 8–10.5 with Pharmalyte™ 3–10. In Figure 9 a mixture of 25% Pharmalyte™ 3–10 and 75% Pharmalyte™ 8–10.5 was used. This mixture flattens the basic part of the gradient, and the linearity of the gradient will be lost. Due to the poor linearity only the pI calibrants close to the target protein should be used. The resulting pI when using calibrant 8.40 and 9.99 is very similar to when using only Pharmalyte™ 3–10 or only Pharmalyte™ 8–10.5. When mixing 25% Pharmalyte™ 3–10 and 75% 8–10.5 the focusing time can be decreased to 1 min at 1500 V and 8 min at 3500 V. For comparison between Pharmalyte™ 3–10, 3–10 plus 8–10.5, and 8–10.5 see Table 2.
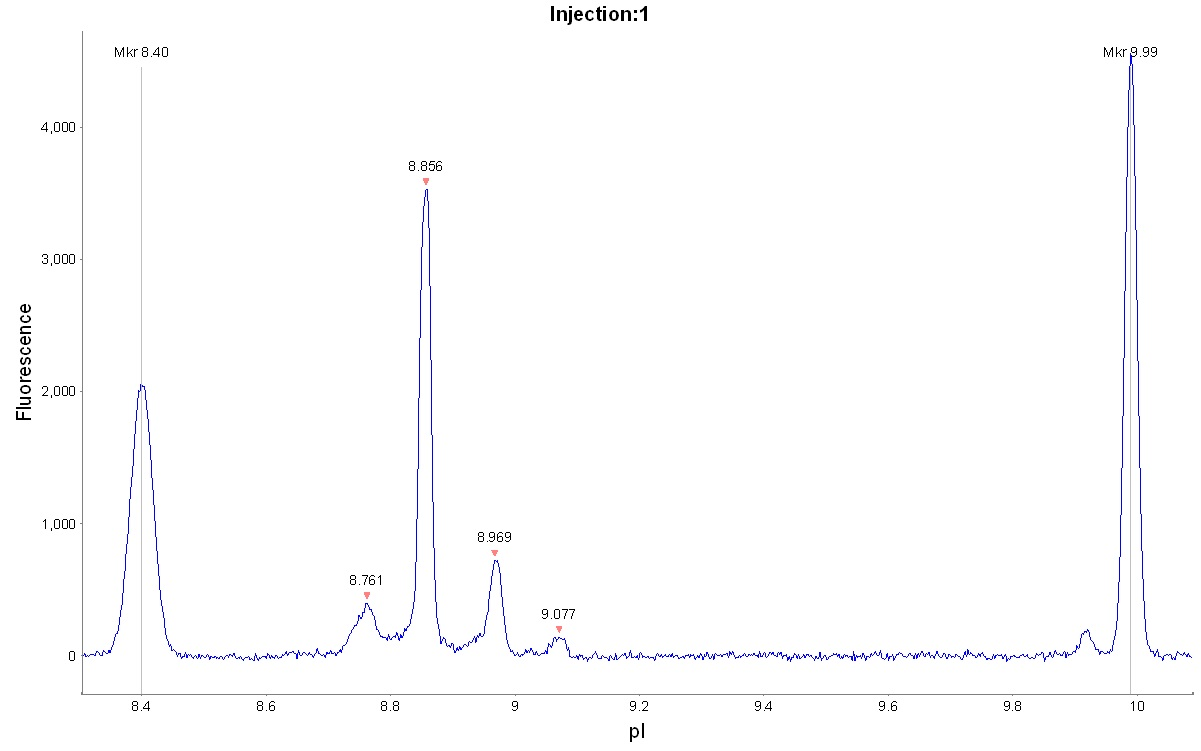
Fig 9. cIEF electropherogram for adalimumab using a mixture of 25% Pharmalyte™ 3–10 and 75% Pharmalyte™ 8–10.5.
Table 2. The outcome of using different Pharmalyte™ types for cIEF separation.
| Pharmalyte™ 3–10 | Pharmalyte™ 3–10 and 8–10.5 | Pharmalyte™ 8–10.5 | |||||||
| Peak | Position | pl | Resolution | Position | pl | Resolution | Position | pl | Resolution |
| pI 8.40 | 1407 | 8.40 | 16.17 | 928 | 8.40 | 20.92 | 513 | 8.40 | 23.46 |
| Peak 1 | 1499 | 8.76 | 3.89 | 1095 | 8.76 | 6.45 | 745 | 8.78 | 9.17 |
| Peak 2 | 1528 | 8.88 | 1.59 | 1138 | 8.86 | 2.27 | 806 | 8.89 | 2.51 |
| Peak 3 | 1554 | 8.98 | 1.80 | 1190 | 8.97 | 2.93 | 878 | 9.01 | 3.03 |
| Peak 4 | 1580 | 9.08 | 1.56 | 1241 | 9.08 | 2.67 | 943 | 9.11 | 3.16 |
| pI 9.99 | 1785 | 9.99 | 14.01 | 1663 | 9.99 | 23.71 | 1473 | 9.99 | 28 |
Conclusions
In this study, we found that determining pI by using calibrant 3.38 is more time dependent than when using calibrant 4.05, since calibrant 3.38 migrates slowly towards the anode after it has focused. We found that when focusing for 4 min or more the pI values of the molecules of interest may be somewhat overestimated.
In addition, the batch-to-batch variation was reduced significantly when using pI calibrants close to the pI value of the target molecule. When testing 19 different Pharmalyte™ carrier ampholyte batches, using calibrants 8.4 and 9.99 instead of 3.38 and 9.99, the max-min pI for Adalimumab decreased from 0.21 to 0.05 and the CV was decreased by 66.7%. Finally, using 100% Pharmalyte™ 8–10.5 gave the best resolution for Adalimumab. Mixing Pharmalyte™ 8–10.5 and Pharmalyte™ 3–10 in a three to one ratio gave almost the same resolution at a somewhat shorter focusing time, which could be considered when running many samples.
References
- Salas-Solano O, Kennel B, Park SS, et al. Robustness of iCIEF methodology for the analysis of monoclonal antibodies: An interlaboratory study. Journal of Separation Science. 2012;35(22):3124-3129. doi:10.1002/jssc.201200633