In downstream processes of monoclonal antibodies (mAb) it is important to remove impurities left after the capture step. In this study, we describe how we used a hydrophobic interaction chromatography (HIC) resin to effectively remove aggregates during a mAb purification process.
By using Capto™ Phenyl High Sub resin, we achieved a reduction of aggregate content to below 1% with high monomer recovery. This study demonstrated that Capto™ HIC resins are an effective tool for aggregate removal for industrial mAb purification applications.
HIC for aggregate removal in mAb purification process
In the downstream process of mAb purification, the purity of your mAb is high after the capture step. To further improve the purity, it is common to use one or two polishing steps. In the polishing resin toolbox, cation and anion exchange resins are usually considered first. However, for some mAbs, HIC offers excellent performance in effectively removing mAb aggregates, which are one of the main impurities after the capture step in a mAb purification process.
Our main goal for this study was to separate the target mAb from aggregates, so we focused on the development of a polishing step using HIC. Based on the hydrophobicity of the target mAb, we optimized the condition to retain the aggregates on the resin and collect the target mAb in the flow through (FT). After first investigating the solubility of the mAb, we used PreDictor™ plates to explore the most promising HIC resins and running conditions. In our PreDictor™ plate study, Capto™ Phenyl (High Sub) resin showed promising result for aggregates removal and was selected for the purification. We used design of experiments (DoE) to optimize the running conditions, which we ran on a prepacked column. We then verified the performance of optimized running conditions and resin on a longer column with a 20 cm bed-height.
HIC is often operated at neutral pH using phosphate buffer, but optimal conditions are case-by-case dependent. Based on previous studies, higher pH increased the risk for aggregates generated from the mAb. Therefore, we included citrate buffer in acidic conditions, which resulted in improved aggregate clearance and higher mAb yield.
Materials for mAb polishing purification
The mAb sample used in the study was obtained after being purified using the MabSelect PrismA™ resin. The aggregate content of the resulting sample was determined to be around 3.5% by size exclusion chromatography (SEC).
Results
Screening Capto™ HIC resins using PreDictor™ plates
Before the screening of resin, the solubility of protein was tested with citrate buffer in various concentrations and pHs to confirm the operational range of buffer. The results showed that the protein was stable under all tested conditions (pH 4 to 6.5 and citric buffer concentration 25 to 350 mM).
We chose to screen three resins: Capto™ Butyl, Capto™ Phenyl ImpRes, and Capto™ Phenyl (High Sub) with 6 µL of a single resin filled in a 96-well PreDictor™ plate, respectively. The collected FT fractions were analyzed with SEC to measure the aggregate content. (For experimental details see Materials and methods.)
Out of the three screened resins, Capto™ Phenyl (High Sub) showed the most promising performance in respect to the aggregate removal. Aggregate levels were reduced by all resins, but the levels were lower when using Capto™ Phenyl (High Sub). Therefore Capto™ Phenyl High Sub resin was selected for this polishing step.
The details from the plate study on this resin are shown in Figure 1. We found that the aggregate content increased with increasing yield, indicating the purification result is a balance between the level of aggregate and the yield of the mAb. In this study, we found that at the buffer condition of 200 mM sodium citrate and pH 4, the aggregate content was low and the yield was acceptable. Hence, these conditions were selected as the initial condition for further investigation.
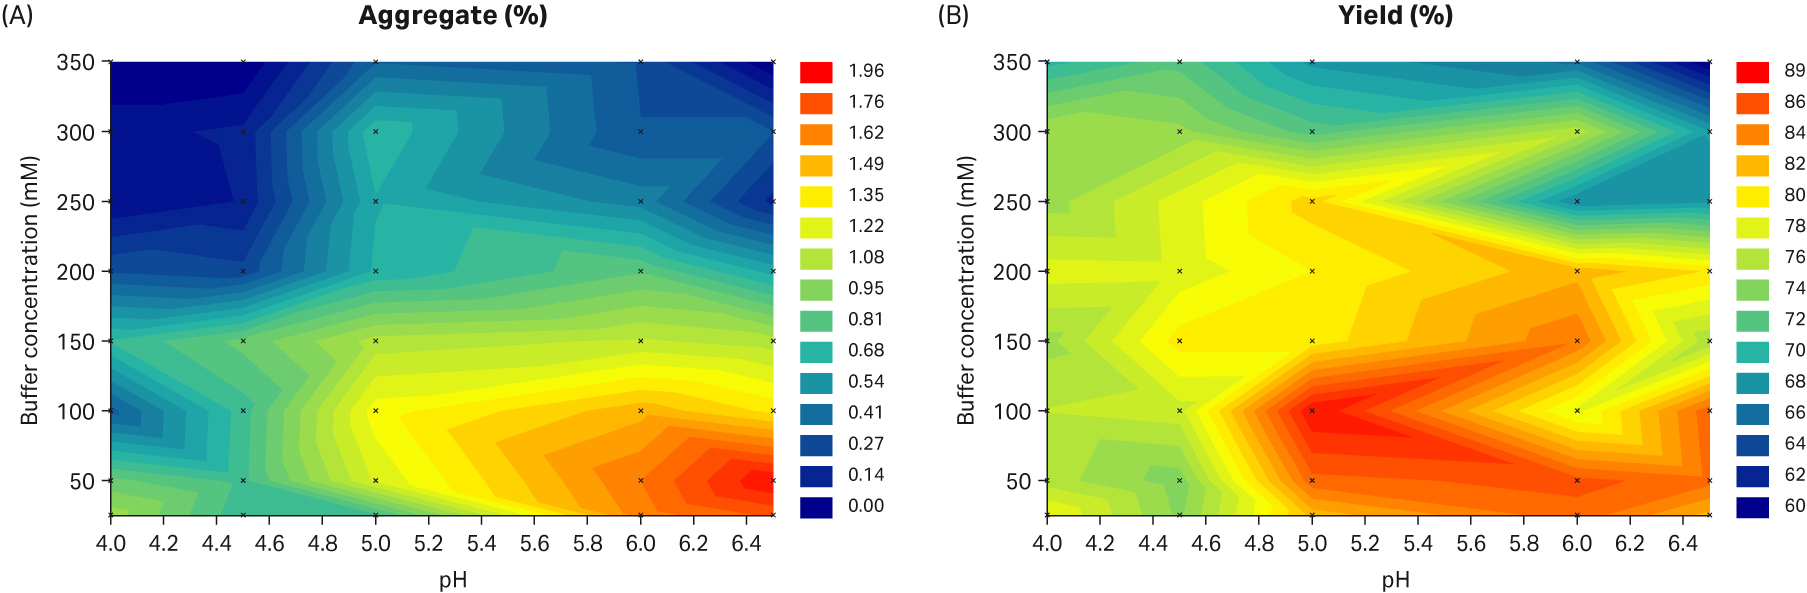
Fig 1. Contour plots of the plate study results with Capto™ Phenyl High Sub resin, where FT fraction was analyzed for A) aggregate content and B) yield of monomer.
Aggregate removal on Capto™ Phenyl High Sub resin in a packed column
As the amount of loaded sample will affect the separation of the aggregates from the target monomer on the resin, before optimizing the running condition, we needed to find a good starting point for the amount of loaded sample. In this step, an excess amount of the sample (20 mL with mAb concentration of 5 mg/mL) was loaded on a small (0.47 mL) Capto™ Phenyl High Sub column and the aggregate level was monitored in the collected FT fractions. After observing aggregate levels above 1.6%, fractions were not further analyzed (Fig 2). When calculating the cumulative results, it was found that 56 mg mAb (corresponding to 120 mg mAb/mL resin) was collected with a cumulative concentration of aggregates below 1% (Fig 3), indicating that a load of 120 mg mAb/mL of sample was a good starting point.
Column: Tricorn™ 5/24 (0.47 mL)
Resin: Capto™ Phenyl (High Sub)
Sample load: 20 mL
Sample concentration: 5 g/L
Equilibration, wash and sample buffer: 200 mM sodium citrate, pH 4
Residence time: 4 min
Flow rate: 0.123 mL/min
Fraction volume: 1 mL collected in a 96-well plate
Strip: 10 mM citrate pH 4.0, 5 CV
CIP: 1 M NaOH, 5 CV
System: ÄKTA pure™ 25
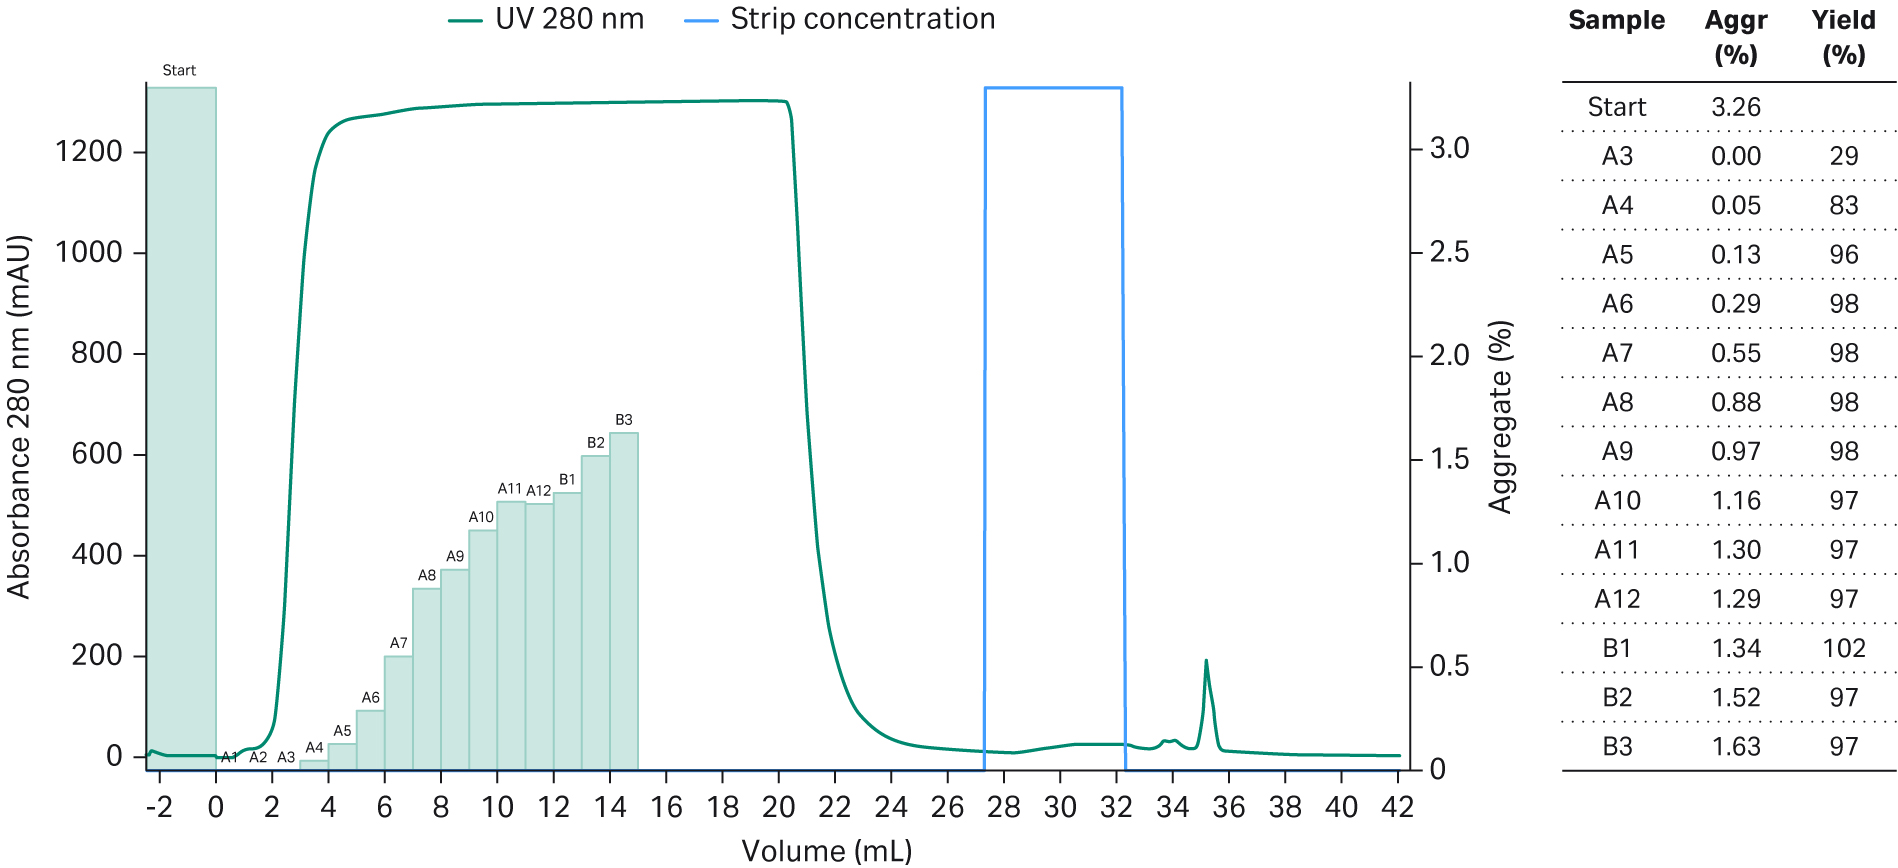
Fig 2. Chromatogram of 20 mL mAb containing sample loaded on a Tricorn™ 5/24 column packed with Capto™ Phenyl (High Sub) resin. The green bars show the aggregate content in the collected fractions.
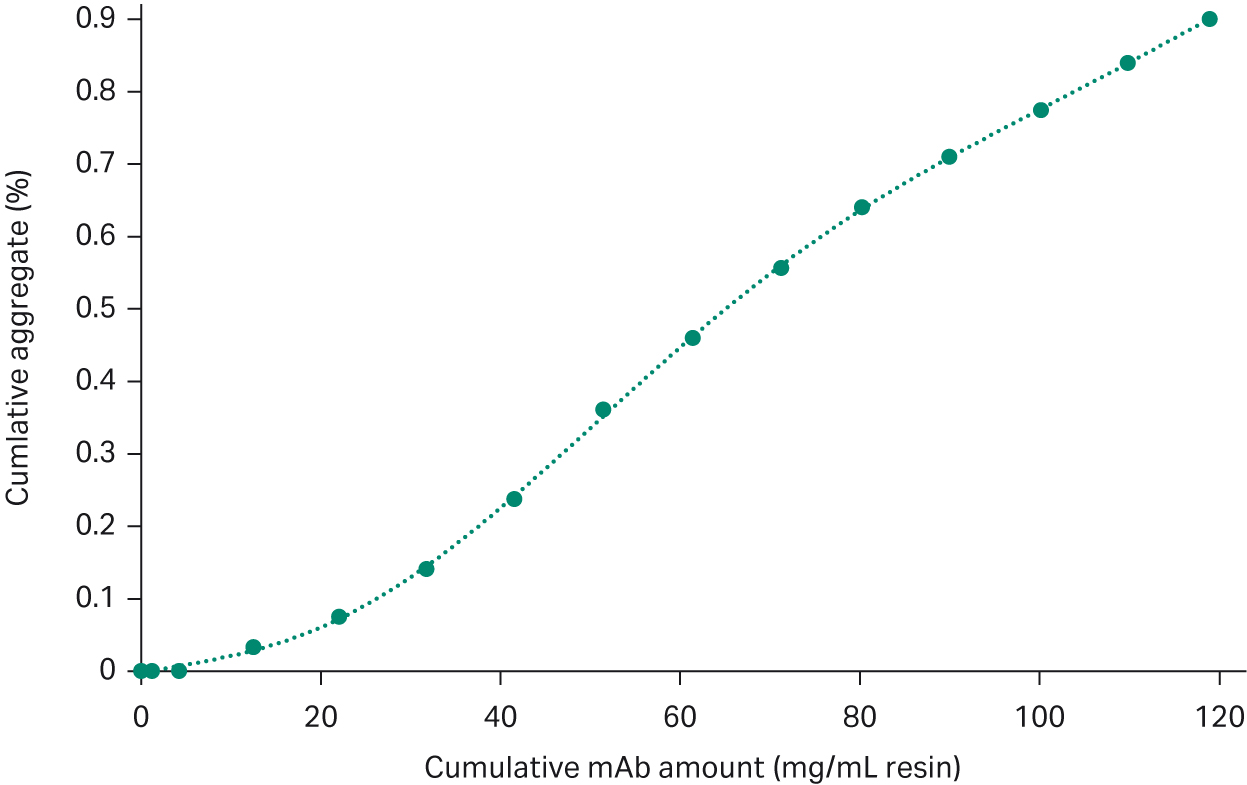
Fig 3. Plot of cumulative aggregate (%) versus cumulative mAb amount collected in FT.
Optimizing running conditions for aggregate removal using DoE
We used DoE to optimize the running conditions using a 0.47 mL Tricorn™ 5/24 column packed with Capto™ Phenyl (High Sub) resin. The screened conditions were the pH, the buffer concentration, and the amount of loaded sample. A Central Composite Orthogonal (CCO) design was chosen. The range of conditions were chosen based on the PreDictor™ experiments which showed that a low pH and an intermediate salt concentration resulted in better aggregate removal. The amount of loaded sample was set to approximately 120 mg/mL resin, based on the results from the previous column study.
We performed seventeen experiments (including three center points). Two fractions were collected during each run. The first fraction was the FT fraction with the volume equal to the load volume, the second was the wash fraction, that is, buffer pumped after each sample application. The fraction was collected until the UV-reading was below 50 mAU. In order to prepare the column for the next run, aggregates had to be removed from the column and this was done with 30% IPA in 1 M NaOH, as only 1 M sodium hydroxide was not sufficient enough to clean the column. The conditions used are listed in Table 1.
Table 1. The running conditions for DoE experiments
| Column | 0.47 mL Tricorn™ 5/24 packed with Capto™ Phenyl High Sub |
| Residence time | 4 min |
| Flow rate | 0.123 mL/min |
| Equilibration buffer | citrate buffer, 5 CV (for more details see Table 2) |
| Sample concentration | 15 mg mAb/mL |
| Wash buffer | same as equilibration buffer |
| Strip buffer | 10 mM citrate pH 4.0, 5 CV |
| CIP* | 30% IPA in 1 M NaOH, 5 CV |
*The CIP condition was 30% IPA in 1 M NaOH instead of 1M NaOH to ensure the column is sufficiently regenerated for the next runs.
The FT fraction and wash fraction from each experiment was analyzed by size exclusion chromatography (SEC) to determine the target mAb yield and the content of aggregates (Table 2). The DoE results were evaluated with MODDE® software (Sartorius AG). A statistically significant model was obtained for the aggregate removal. A Monte Carlo simulation was then performed to obtain a robust running condition to achieve yield above 88% at an aggregate level below 1%, which has the probability of failure below 1 %. From the Monte Carlo simulation, the optimum conditions were found to be 210 mM citrate, pH 4.4, and a load of 140 mg mAb/mL resin (Fig 4). Based on these conditions a verification experiment was performed again on the column. The result was in agreement with the expected result and showed that the aggregate content was reduced to 0.8% with a monomer recovery of 88%.
Table 2. Experimental conditions and results of monomer yield and aggregate obtained from experiments performed on Tricorn™ 5/24 column with Capto™ Phenyl (High Sub) resin
| Experiment number | Run order | pH | Citrate concentration (mM) | Sample loaded (mg/mL resin) | Yield (%) | Aggregate (%) |
| 1 | 7 | 4 | 150 | 100 | 84.4 | 0.65 |
| 2 | 6 | 5 | 150 | 100 | 94.7 | 0.94 |
| 3 | 1 | 4 | 250 | 100 | 80.5 | 0.46 |
| 4 | 15 | 5 | 250 | 100 | 85.0 | 0.57 |
| 5 | 16 | 4 | 150 | 200 | 87.7 | 0.96 |
| 6 | 17 | 5 | 150 | 200 | 95.3 | 1.22 |
| 7 | 10 | 4 | 250 | 200 | 87.4 | 0.82 |
| 8 | 11 | 5 | 250 | 200 | 89.4 | 0.92 |
| 9 | 4 | 3.8 | 200 | 150 | 80.2 | 0.70 |
| 10 | 8 | 5.2 | 200 | 150 | 88.4 | 1.00 |
| 11 | 14 | 4.5 | 130 | 150 | 89.0 | 0.95 |
| 12 | 9 | 4.5 | 270 | 150 | 89.7 | 0.77 |
| 13 | 2 | 4.5 | 200 | 82 | 86.4 | 0.57 |
| 14 | 3 | 4.5 | 200 | 218 | 90.6 | 1.01 |
| 15 | 13 | 4.5 | 200 | 150 | 90.7 | 0.90 |
| 16 | 5 | 4.5 | 200 | 150 | 91.2 | 0.89 |
| 17 | 12 | 4.5 | 200 | 150 | 90.4 | 0.90 |
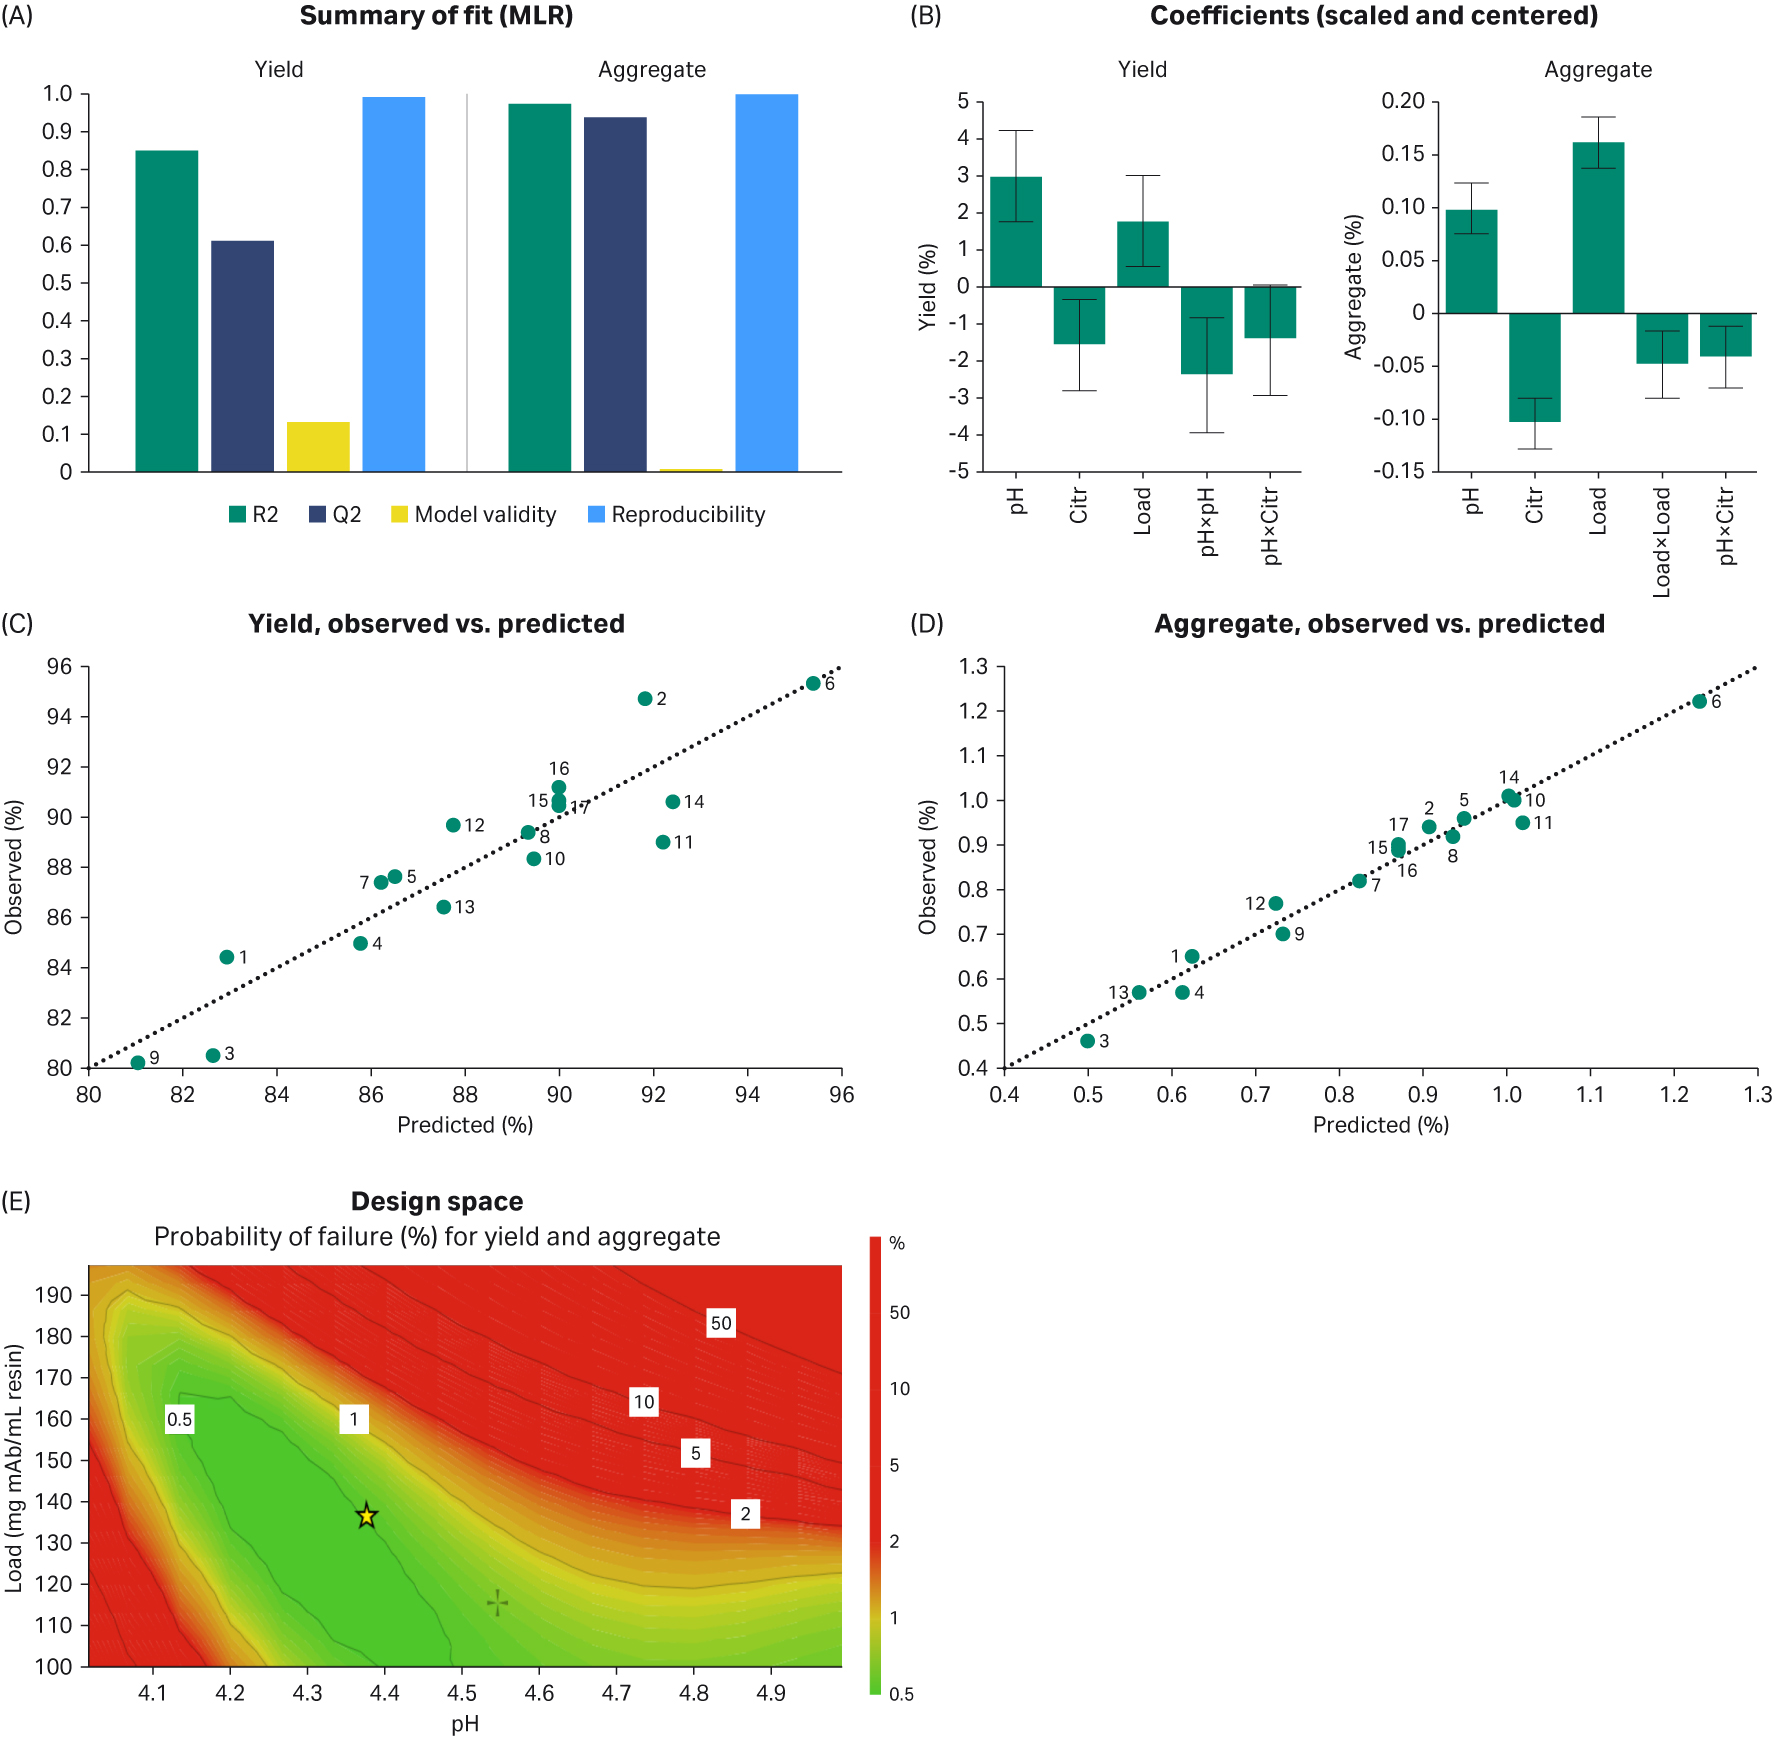
Fig 4. Evaluation of the DoE model (A to D). The obtained design space from Monte Carlo simulation is shown in E, where the goal is yield > 88% and aggregate content < 1%. The green area represents a probability of failure of < 1% when citrate concentration is set to 210 mM.
As the experiments were performed on a small column with only 2.4 cm bed height (Tricorn™ 5/24, 0.47 mL), the running conditions were also tested in a column with 20 cm bed height (Tricorn™ 5/200, 4 mL), which is more relevant for large scale purification. The residence time was kept at 4 min.
In this experiment, the aggregate content was reduced to 0.85% with a monomer recovery of 93.4%. The results were comparable with the results obtained previously in the smaller column (Fig 5 and Table 3), and in agreement with the experience that yield improves slightly when the relative system dead volume is reduced. We used the same chromatographic system for this experiment, only exchanging the column.
Table 3. Yield and aggregate data obtained from experiments performed on columns packed with Capto™ Phenyl (High Sub) 5/24 and Capto™ Phenyl (High Sub) 5/200 resins using 210 mM citrate, pH 4.4, and a load of 140 mg mAb/mL resin.
|
Column |
Observed |
Expected values from Monte Carlo simulation |
||
|
Yield % |
Aggregate (%) |
Yield (%) |
Aggregate (%) |
|
|
Tricorn™ 5/24 (0.47 mL) |
88.0 |
0.80 |
88.6 |
0.8 |
|
Tricorn™ 5/200 (4 mL) |
93.4 |
0.85 |
||
Column: 4 mL Tricorn™ 5/200 packed with Capto™ Phenyl (High Sub)
Sample load: 38.1 mL, corresponding to 140 mg mAb/mL resin loaded
Sample concentration: 14.7 mg/mL
Residence time: 4 min
Equilibration buffer: 210 mM citrate, pH 4.4, 5 CV
Wash buffer: same as equilibration buffer with max 10 CV
Flow rate: 1 mL/min
Strip: 10 mM citrate pH 4.0, 5 CV
CIP: 30% IPA in 1 M NaOH, 5 CV
Re-Equilibration: same buffer as equilibration, 5 CV
System: ÄKTA pure™ 25
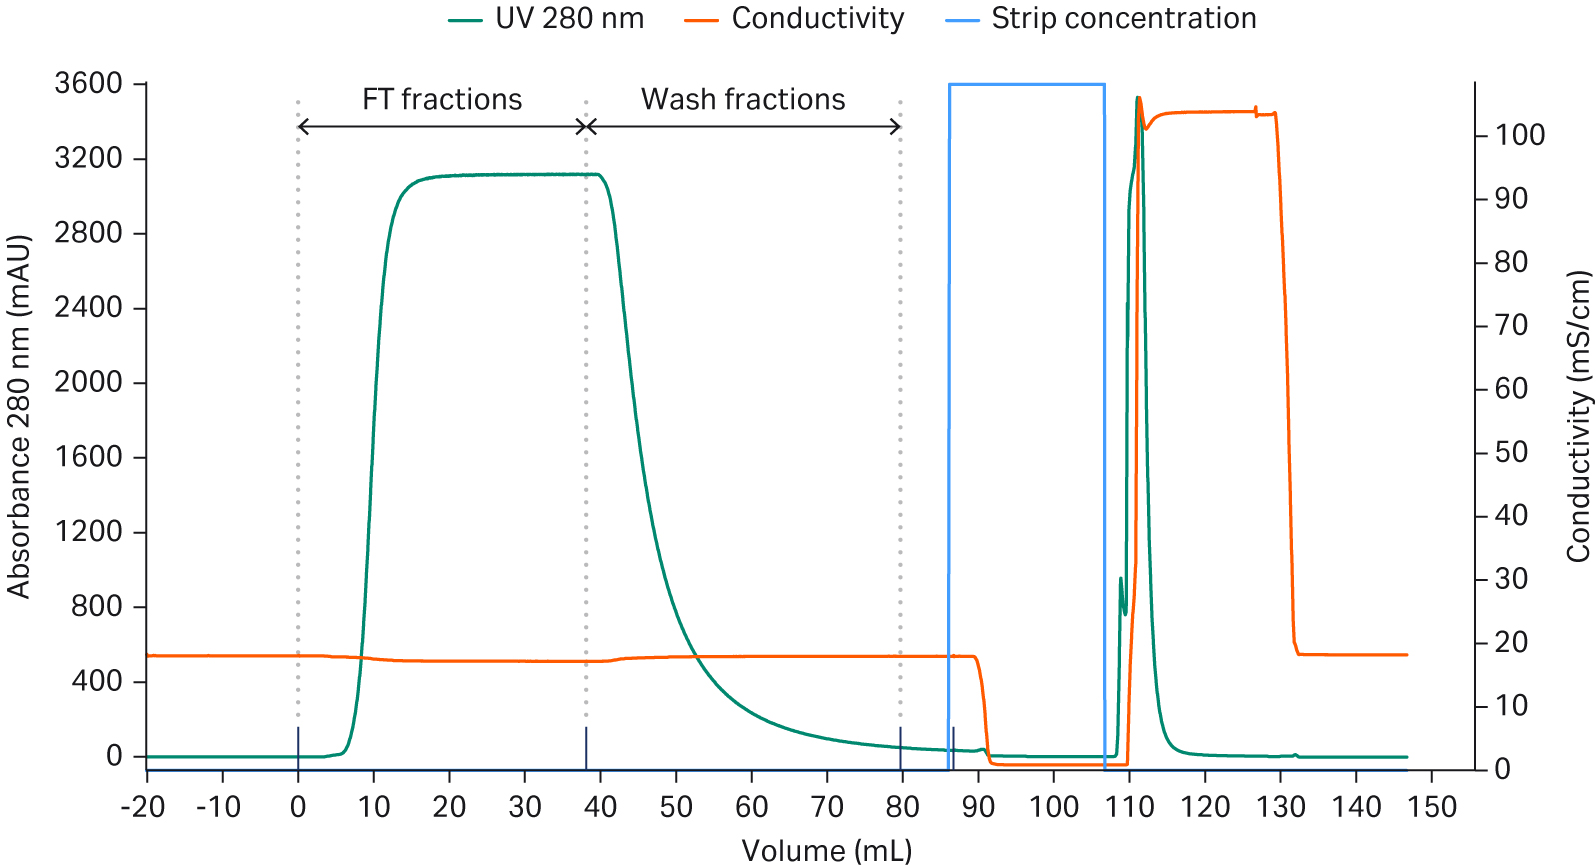
Fig 5. Chromatogram from purification of 140 mg mAb/mL resin on a Tricorn™ 5/200 column packed with Capto™ Phenyl (High Sub) resin. Both FT and wash fractions were collected and pooled before the purity analysis.
Host Cell Protein (HCP) analysis
In this study we did not optimize conditions for HCP removal but it was found that the HCP content was significantly reduced after this polishing step. The results are summarized in Table 4. A 1.7 log reduction of HCP content was observed.
Table 4. HCP concentration from the start and the pooled fractions after the HIC step
| Column | HCP concentration before HIC (ppm) | HCP concentration after HIC (ppm) | log HCP reduction |
| Tricorn™ 5/24 (0.47 mL) | 9877 | 217 | 1.66 |
| Tricorn™ 5/200 (4 mL) | 9877 | 191 | 1.71 |
Conclusions
We have demonstrated that HIC is an efficient option as a polishing step after protein A affinity to remove aggregates in a mAb purification process.
-
The aggregate removal of less than 1% was achieved with Capto™ Phenyl (High Sub) using flow-through mode.
-
The 96-well PreDictor™ plates are effective tools to select the optimal resin as well as running conditions.
-
A DoE was performed to optimize the running conditions and a Monte Carlo simulation was performed to identify the robust conditions to reach the objectives in aggregation removal and the monomer recovery.
-
The performance of resin was further verified by applying the identified running conditions to column with an increased bed height of 20 cm and comparable results were obtained.
Further reading
- HIC resource center
- HTPD resource center
- Overview of Cytiva resins
- HIC resins
- HIC prepacked columns
- A guide to polishing chromatography
Solubility study
The solubility study was performed in a 96-wells UV-plate. To each well, 12 µL of sample with a concentration of 25 mg/mL was added, followed by the addition of 188 µL of each buffer composition. Each buffer composition was tested twice, therefore, in total 48 buffer compositions were tested. The pH was varied from 4 to 6 and the concentration was varied from 25 mM to 350 mM. After the sample in buffer was incubated at room temperature for 1 hr, the UV absorbance of plate was read at wavelength at 280, 400, and 600 nm. Any increase of absorbance was considered to be precipitation.
PreDictor™ plate resin screening study
We screened three resins: Capto™ Butyl, Capto™ Phenyl ImpRes, and Capto™ Phenyl (High Sub) with 6 µL of a single resin filled in a 96-well PreDictor™ plate. The load of protein was at 60 mg mAb/mL resin with the mAb dissolved in respective buffer, that is, with a pH range of 4 to 6.5 and citrate buffer concentrations of 25 to 350 mM. For each resin, each buffer condition was tested with duplicates and therefore in total 48 buffer conditions were tested for each resin. The collected FT fractions were analyzed with SEC to measure the aggregate content and the yield of monomer in flow through.
More information on performing a PreDictor™ plate study can be found here.
Table 5. Experimental protocol for screening of each resin in PreDictor™ plate study for the removal of aggregates.
| Sample | The mAb sample was diluted to 1.5 mg/mL with the different buffers prepared in the buffer plate |
| Equilibration buffer | The plate was equilibrated three times with 200 µL of the different buffers |
| Sample Load and incubation | 200 µL of sample was added to each well, and the plate was incubated on an orbital shaker for 60 min at 1100 rpm |
| Collection of FT fraction | The plate was emptied into an UV plate using centrifugation (500 × g for 1 min) and UV at 254, 280, and 295 nm was measured using a UV plate reader. |
SEC Analysis
The mAb purity was determined by size exclusion chromatography (SEC) using Superdex™ 200 Increase columns and an ÄKTA™ chromatography system. A Superdex™ 5/150 GL column was used for the screening experiments, and a Superdex™ 10/300 GL column was used for the column experiments. The content percentage of mAb and aggregates was determined by integration of the peak area.
HCP Analysis
The HCP analysis was performed according to standard procedure on Gyrolab xP GW10224 from Gyros Technologies using Gyrolab Bioaffy CHO HCO E3G kit.