The complexity and expense associated with large-scale perfusion cell culture processes make it worthwhile to establish scaled-down models which provide a reliable prediction of behavior. Establishing an appropriate model allows for higher throughput during simultaneous operation and monitoring of several cultures at different process conditions. In this article, we discuss the development of a bench-scale (1.5 L working volume) proof of concept model for a 50 L Xcellerex™ XDR-50 bioreactor and Xcellerex™ APS perfusion system with comparable growth, volumetric productivity, and product quality.
Introduction
Scaled-down models are useful tools for increasing process understanding, through rapid determination of suitable operating conditions such as appropriate viable cell concentration, perfusion rate, and medium composition. Since performing a study at scale is not always practical, development of scaled-down models can be beneficial. No scaled-down model can be an exact copy of the large-scale process, but it can mimic them physically and biochemically.
In this study, we grew CHO cells expressing a monoclonal antibody (mAb) in HyClone ActiPro™ cell culture media with additional Cell Boost™ 1 and Cell Boost™ 3 supplements. The perfusion process was operated at a cell-specific perfusion rate (CSPR) of 20 pL/cell/d for a total of 18 days, reaching a controlled state at 70 MVC/mL for 10 days. An illustration of the set-up used is shown in Figure 1. The process showed comparable growth, volumetric productivity, and product quality to the 50 L scale perfusion process.
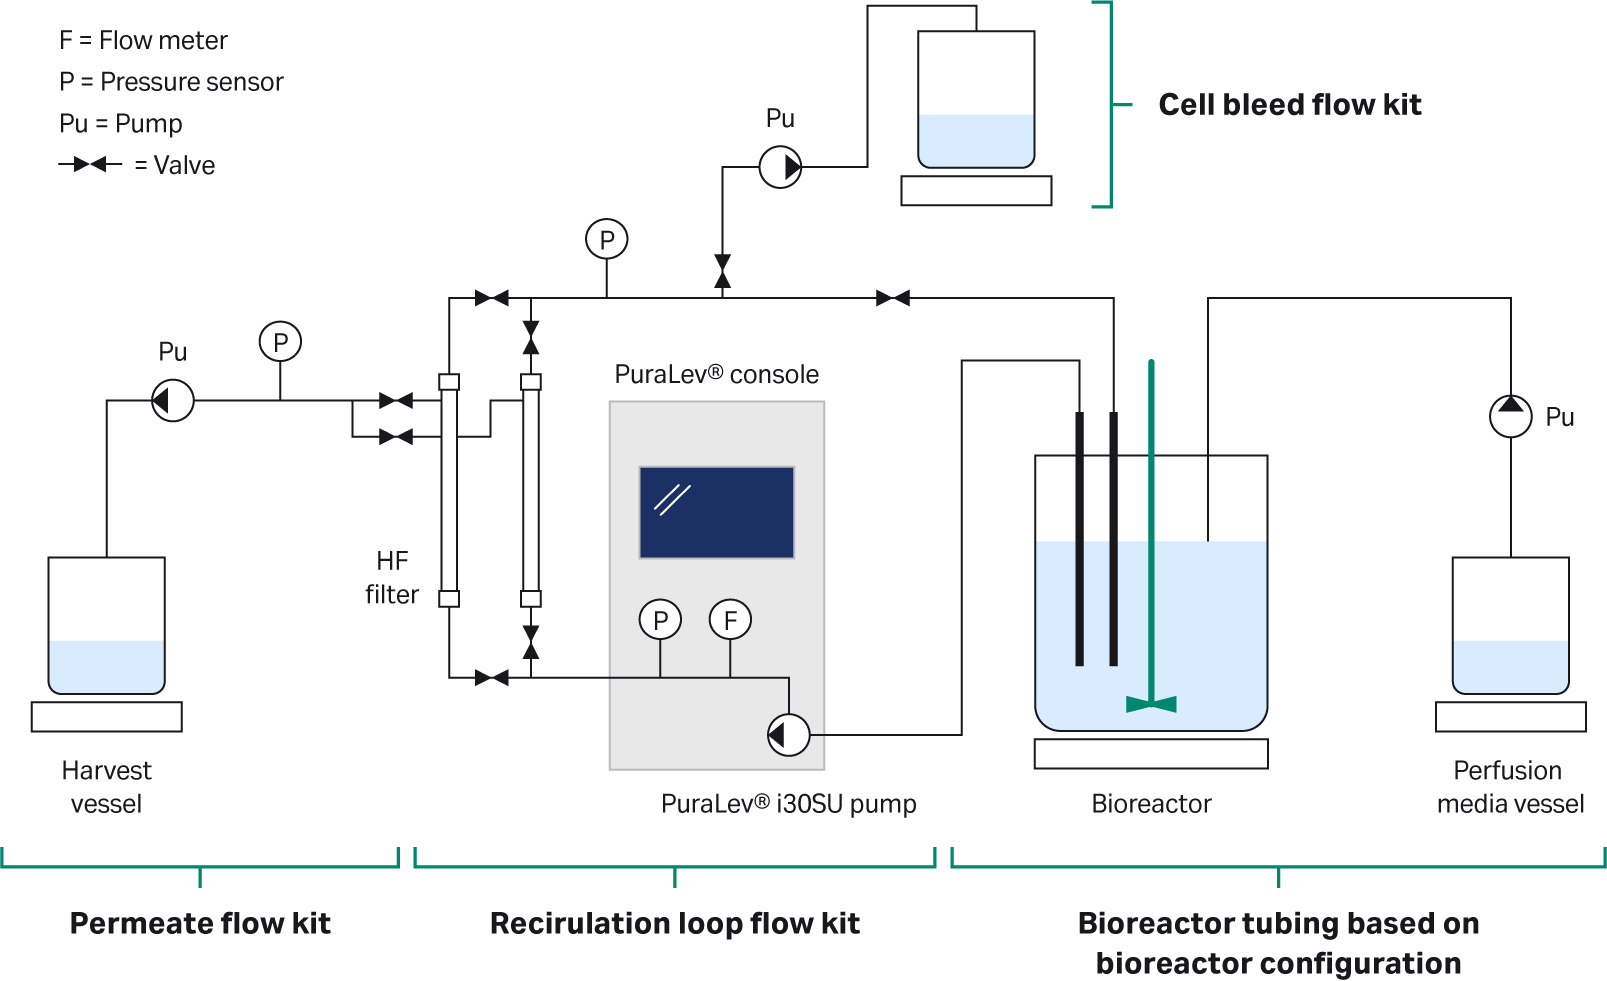
Fig 1. Illustration of the set up used.
When designing a scale-down model of a perfusion process you need to consider several important scaling factors. First, the length and fiber lumen of the hollow fiber cartridge needs to have the same path length to create similar pressure profiles across the filter at similar shear rates between the two scales. Second, the crossflow rate (shear rate) through the hollow fibers should be similar. Third, the scaled-down flow kit should try and mimic the larger scale flow kit when it comes to cell residence time in the flow kit during recirculation and volumetric dimensions, keeping similar flow characteristics between the scales. And finally, the ratio of volume to filter area or filter load should be kept similar.
Filter optimization is crucial as it improves the performance and longevity of the filter and the perfusion process as a whole. During optimization, you need to investigate the appropriate filter size, pore size, crossflow rate, and any other critical process parameters that will affect the performance of your process. This means, deciding upon several different filter sizes and pore sizes and characterizing flux versus transmembrane pressure (TMP) at various crossflow rates (shear rate).
Results and discussions
Cell growth and productivity
Cell growth and viability for the scaled-down and large-scale perfusion cell cultures are shown in Figure 2. A controlled state was reached at day 8 and maintained until day 18.
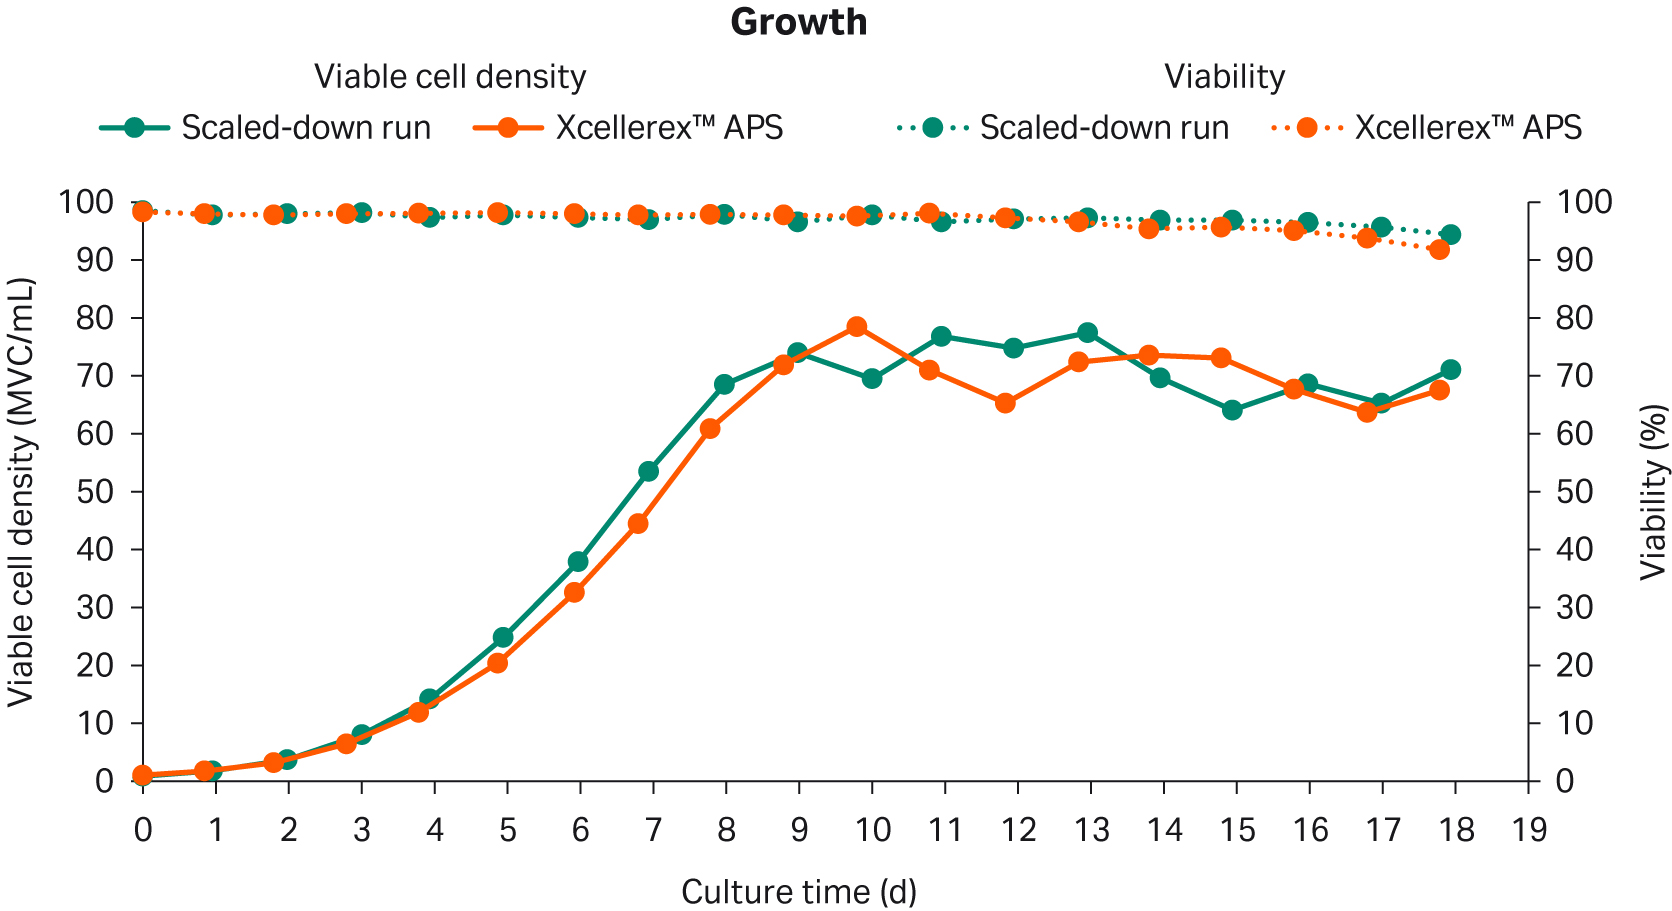
Fig 2. Cell growth and viability of the scaled-down and large-scale perfusion cell culture runs.
The volumetric productivity between the scaled-down model and the reference Xcellerex™ APS culture was comparable (Fig 3). During the controlled state both models had a volumetric productivity of approximately 0.9 g/L/d.
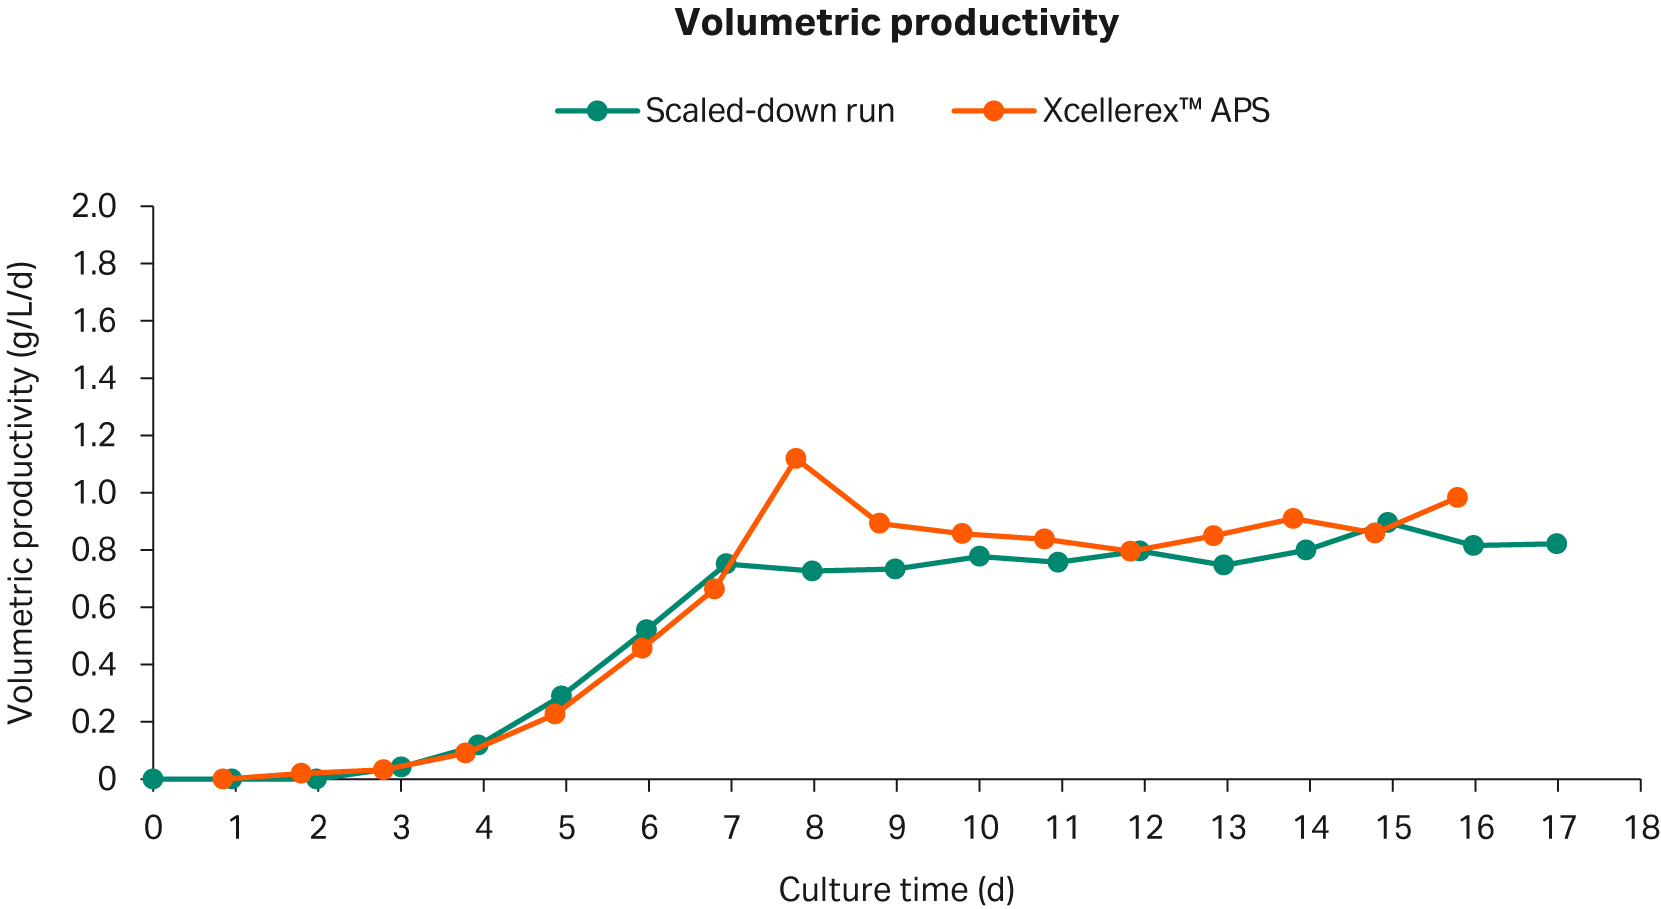
Fig 3. Volumetric productivity in the scaled-down perfusion cell culture and the titer in the Xcellerex™ APS perfusion cell culture.
Nutrient and metabolites
The glucose concentration in the scaled-down culture was slightly higher than the large-scale Xcellerex™ APS culture for the first 12 days (Fig 4). On day 13, the glucose concentration for the small-scale run reduced to similar levels as in the Xcellerex™ APS process.
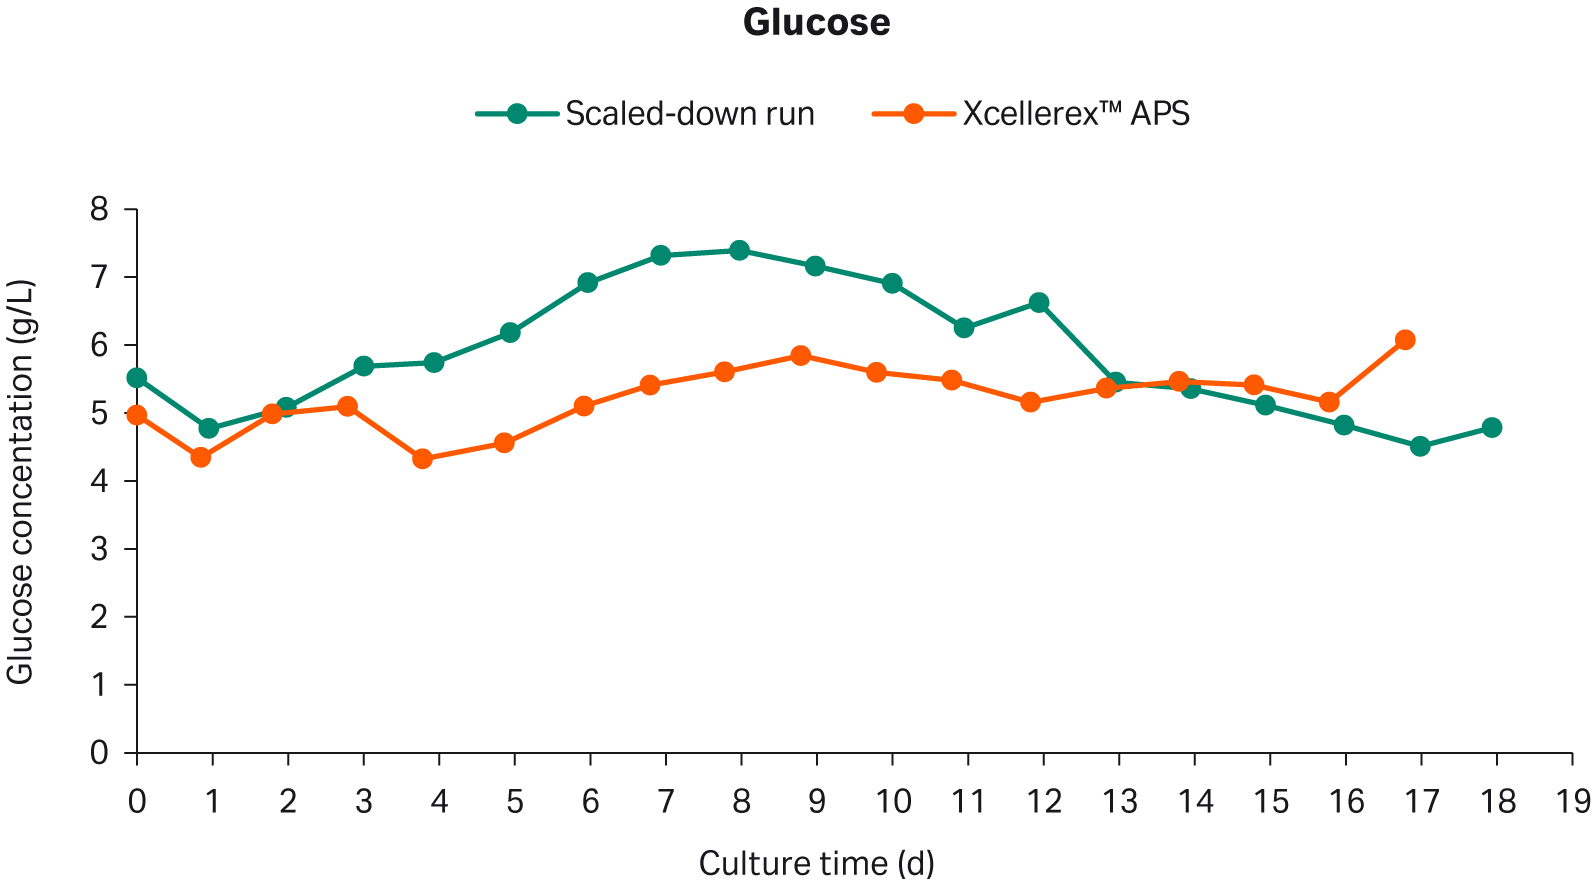
Fig 4. Glucose concentration in scaled-down perfusion cell culture and reference Xcellerex™ APS perfusion cell culture.
The lactate concentration for the scaled-down run had a similar profile to the reference Xcellerex™ APS run up to culture day 12 (Fig 5). On day 13, the lactate concentration increased for the scaled-down run which coincided with the reduction in glucose concentration (Fig 4).
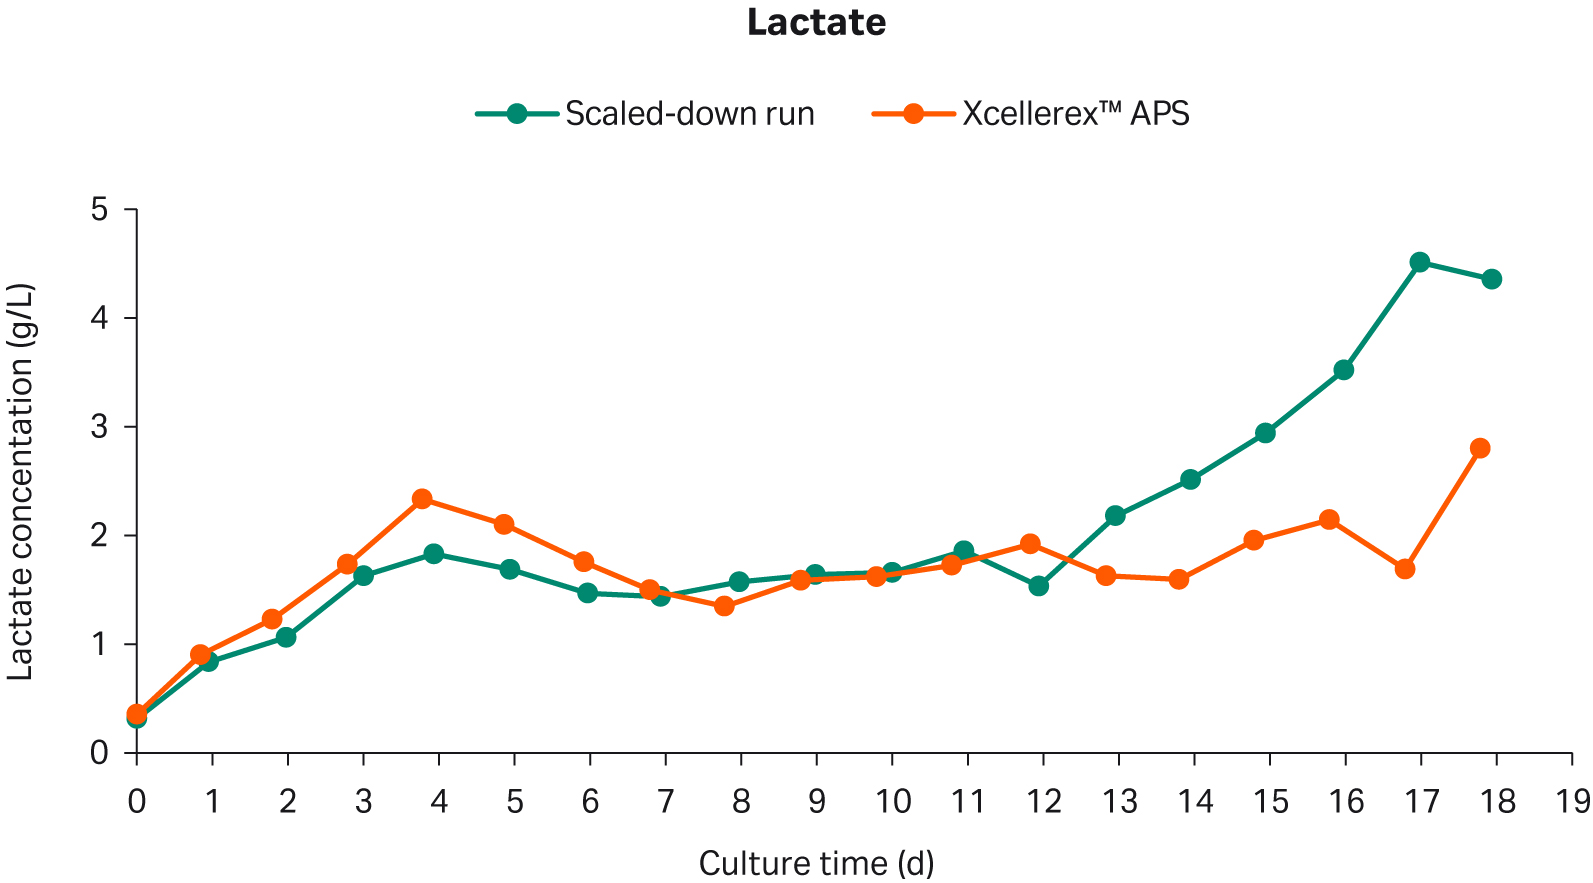
Fig 5. Lactate concentration in scaled-down perfusion cell culture and Xcellerex™ APS perfusion reference cell culture.
The glutamate concentrations had a similar profile for all runs (Fig 6). The glutamate concentrations showed an initial and rapid consumption rate during the exponential growth phase which then leveled out during the controlled state.
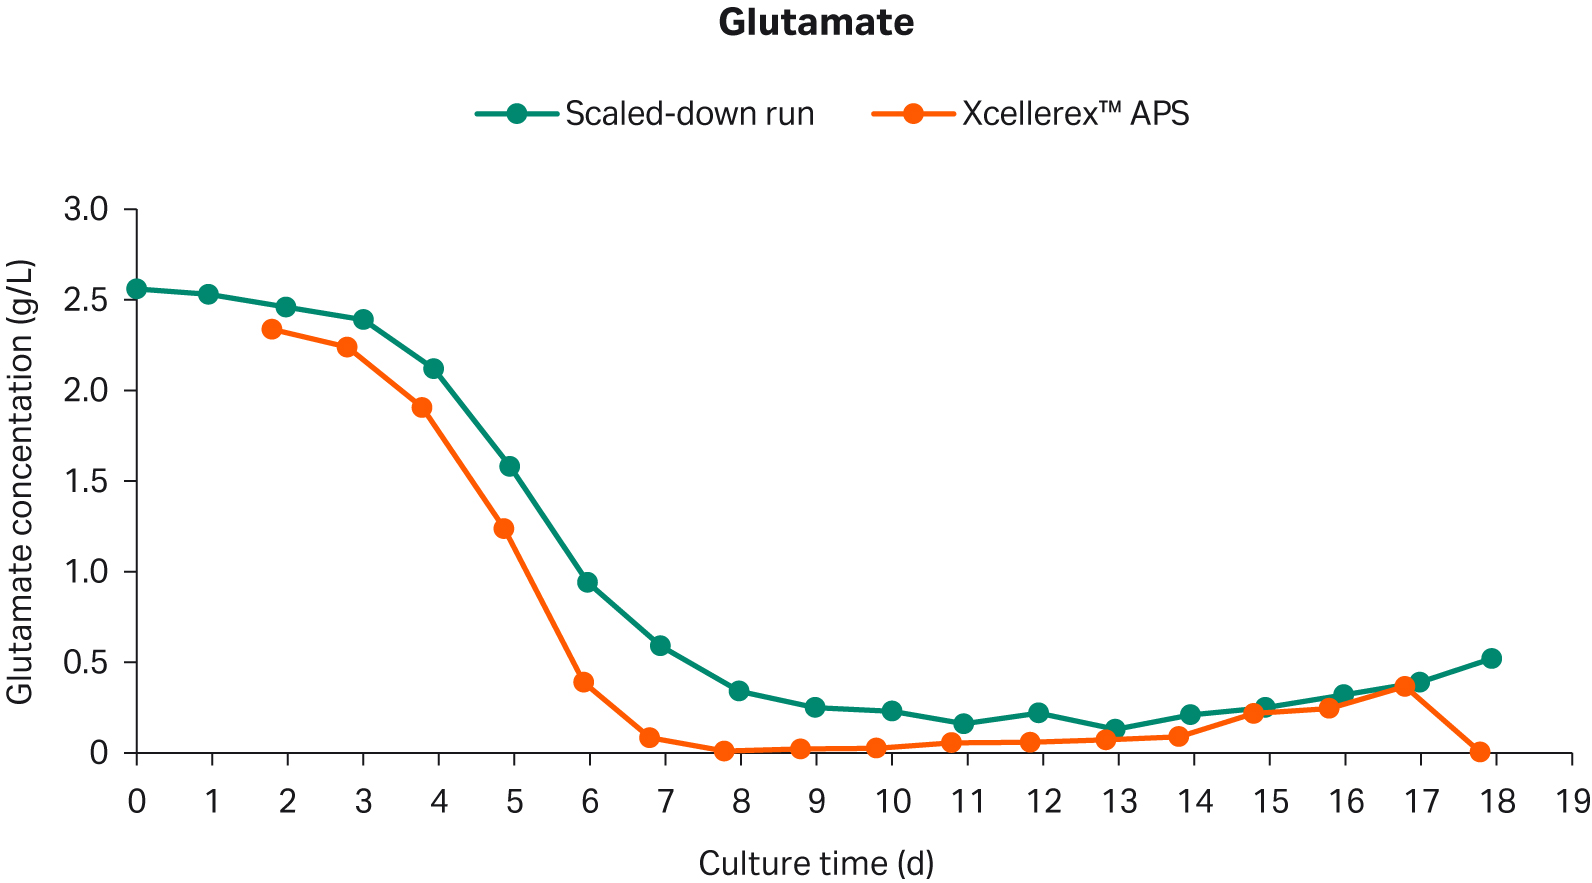
Fig 6. Glutamate concentration in scaled-down perfusion cell culture and XDR-50 perfusion reference cell culture.
Product quality
Small amounts of high molecular weight aggregate (HMW) and low molecular weight fragment (LMW) distributions were seen in the scaled-down perfusion run from the permeate pool on day 18 (Fig 7). The main peak showed a 96% distribution.
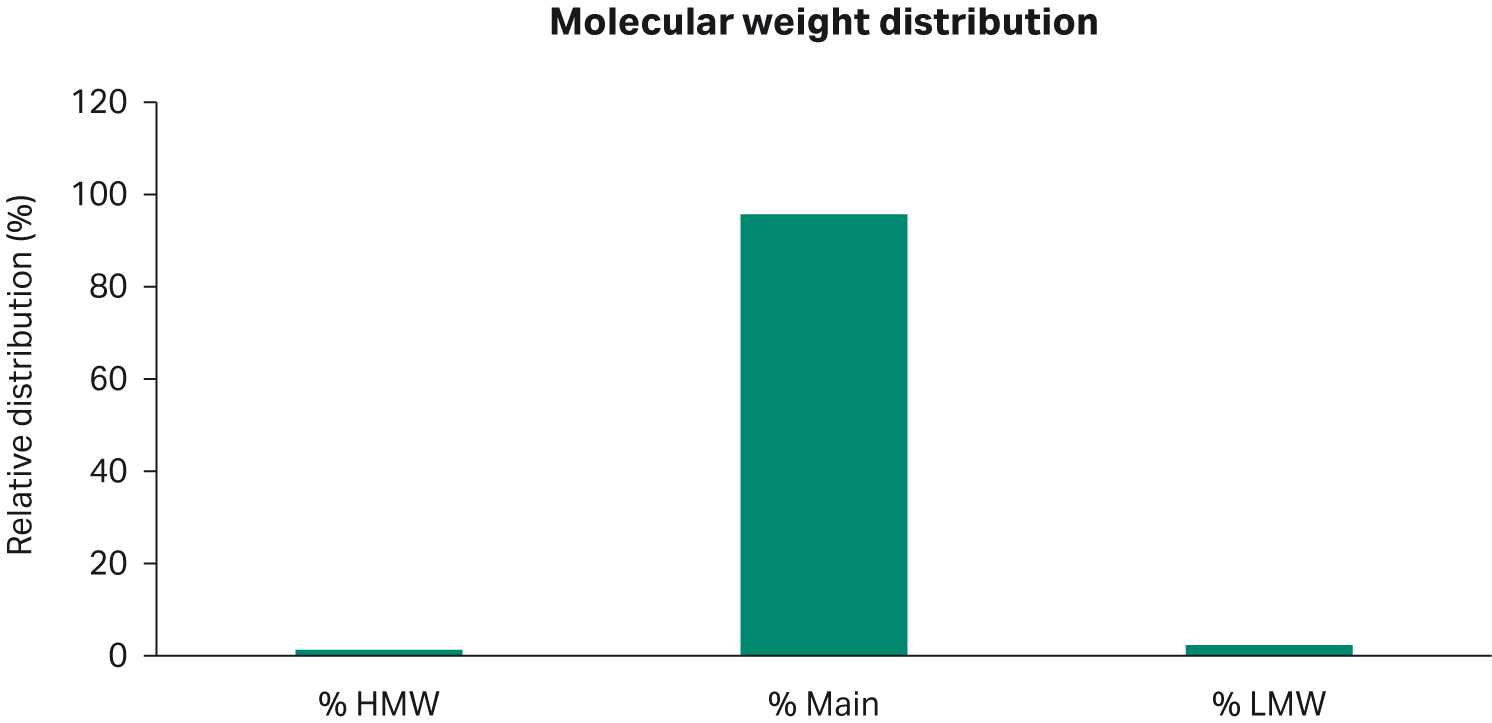
Fig 7. Molecular weight distribution of permeate on day 18 for the scaled-down run.
The mAb charge distribution from the harvest pool at day 18 had acidic peaks at 34%, main peak at 41%, and basic peaks at 26% (Fig 8).
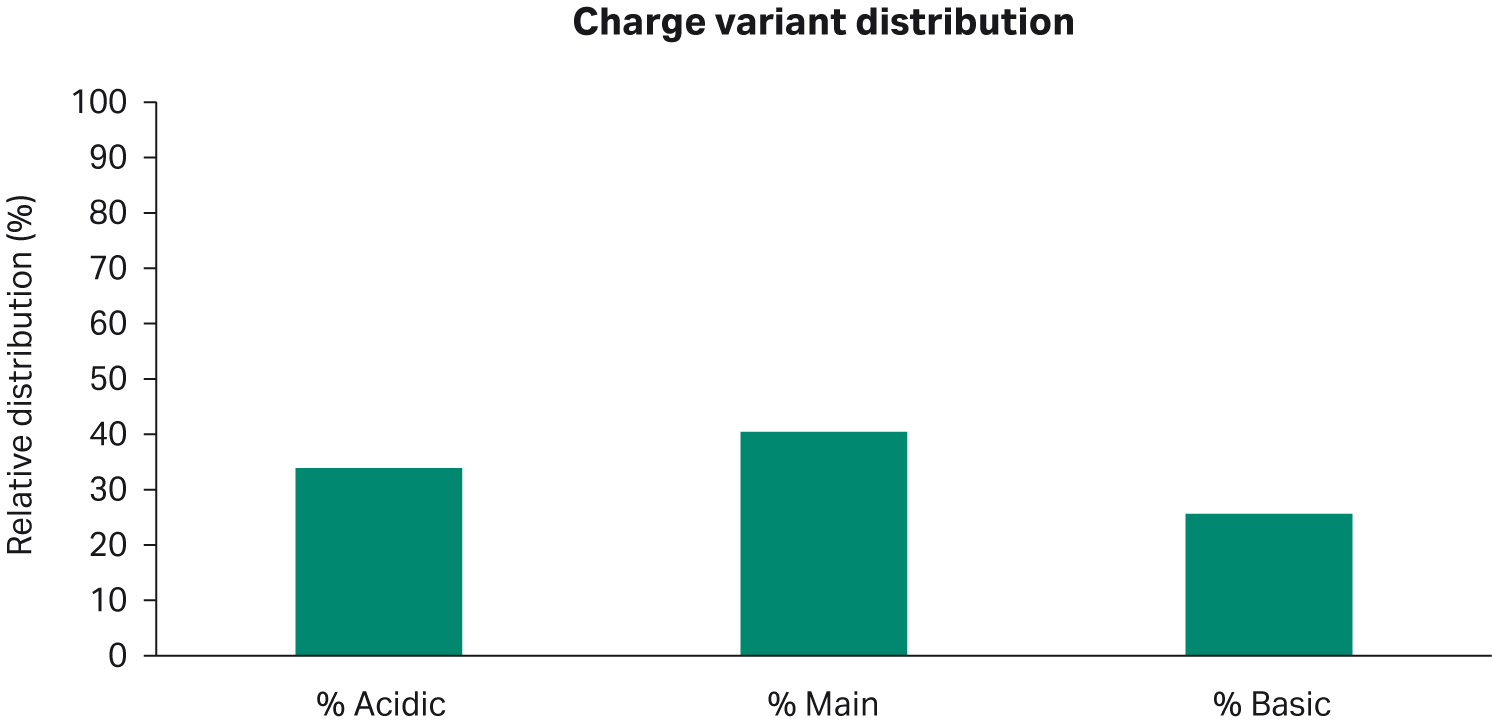
Fig 8. Charge variant distribution of the harvest pool on day 18 for the scaled-down run.
The N-glycan distribution of the mAbs from the harvest pool at day 18 had 47% F(6)A2, 31% F(6)A2[6]G(4)1, 11% F(6)A2[3]G(4)1, 6% F(6)A2G(4)2, 3% A2, and finally 3% of other glycans (Fig 9).
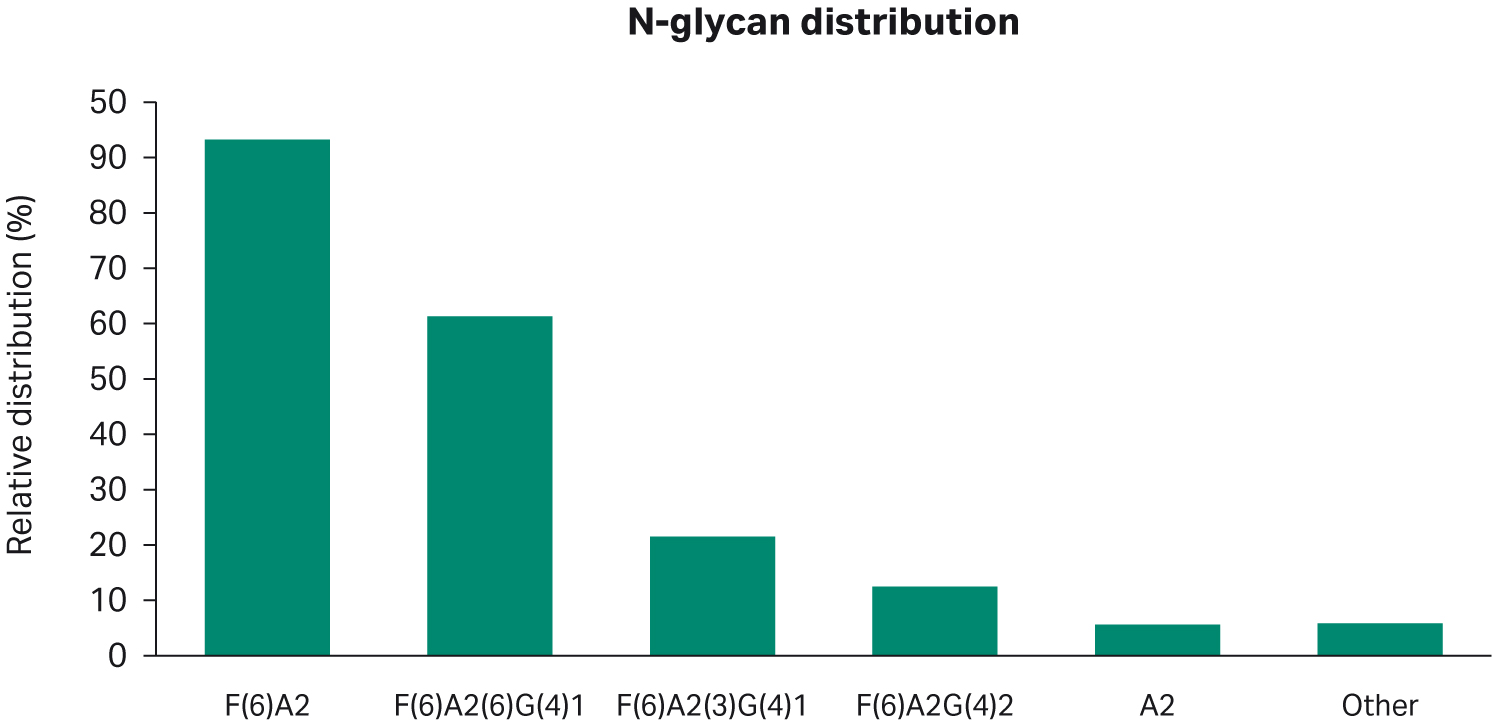
Fig 9. Relative N-glycan distribution of the harvest pool on day 18 for the scaled-down run.
Discussion
In the beginning we addressed the importance of certain scaling factors when designing a scaled-down model. In this study we maintained the length of the hollow fiber cartridge at 60 cm, the fiber lumen i.d. at 1 mm and the shear rate was kept at 2000 s-1 for the scale-down run model and the large-scale run. It is difficult to get a complete volumetrically down-sized flow path and obtain similar residence time between the two scales. For these runs, the scaled-down flow kit had a residence time of 16 s while the large-scale run had 6 s. For our large-scale model we operated at a working volume of 50 L using a 0.84 m2 filter. While for the small-scale model we used a 1.5 L and 0.023 m2 filter. The volume to area ratio for the 50 L scale was 59.5 L/m2 and 65.2 L/m2 for the 1.5 L scale mode.
Filter optimization is crucial as it improves the performance and longevity of the filter and the perfusion process as a whole. During optimization, you need to look into the appropriate filter size, pore size, and cross-flow rate, and other critical process parameters that will affect the performance of your process. This means deciding upon a number of different filter sizes and pore sizes and performing a TMP versus flux comparison.
At each shear rate, control the flux and observe TMP stability over time, that is for 10 to 30 min. Adjust the recirculation flow rate to the next shear rate and repeat the measurements. When the permeate pressure falls below 0 or when the TMP becomes unstable you will know the upper operating limit and when the filter starts to foul. The optimal process condition will be just below that upper limit threshold. Once the optimum flux rate is identified, membrane surface area may be calculated to achieve the desired media exchange rate. However, increasing shear rate might impact cell viability and to observe a significant drop in viability in cell cultures a 24 hr duration between data points might be needed.
In this study, we were able to successfully mimic the Xcellerex™ APS perfusion cell culture run maintaining a cell viability greater than 90%, while holding a controlled state at 70 MVC/mL for 10 days, and maintaining a steady CSPR of 20 pL/cell/d throughout the entire process. In addition, similar nutrient and metabolite profiles were maintained between the scaled-down model and the Xcellerex™ APS run.
In summary, we have successfully developed a 1.5 L scale perfusion process and shown that it had comparable growth and volumetric productivity to a 50 L Xcellerex™ XDR-50 stirred-tank bioreactor operated in perfusion mode with an Xcellerex™ APS.
Materials And Methods
Cell culture media and feed preparations
Cell culture media and feeds were prepared according to the manufacturer’s protocols. HyClone™ cell culture ActiPro™ media was supplemented with HyClone™ cell culture Cell Boost™ 1, Cell Boost™ 3, and Pluronic™ F-68 (BASF SE) before being sterile-filtered into a 50 L ReadyCircuit™ bag. The base for pH control was filtered using a bottle top filter and transferred to a transfer bottle. The antifoam was autoclaved using the liquid program.
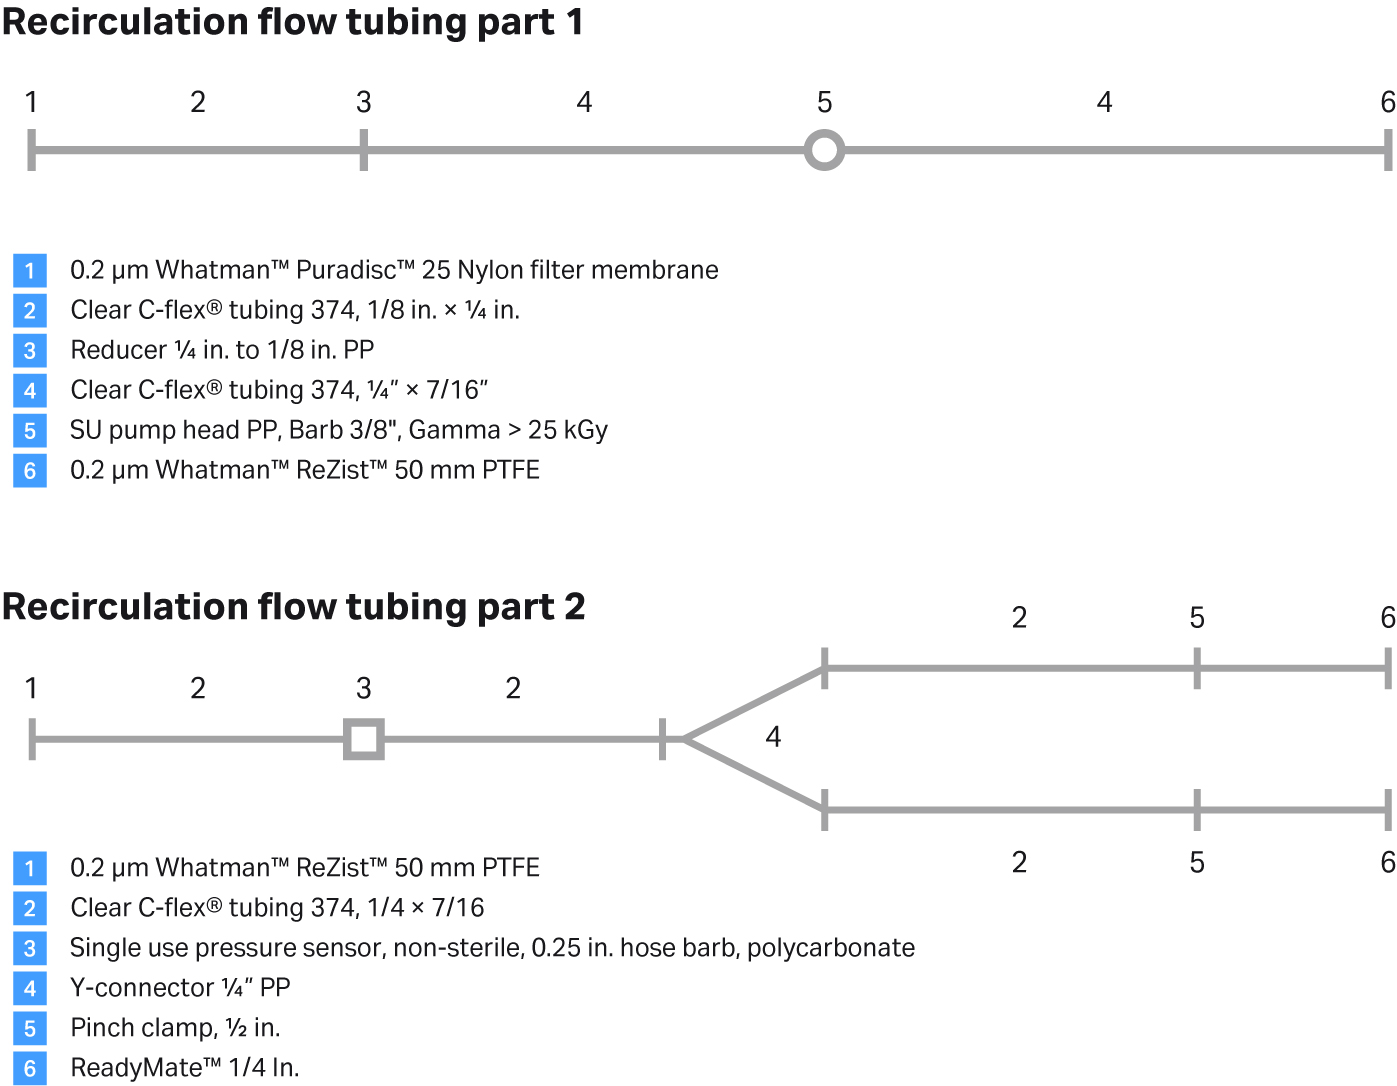
Fig 10. Recirculation flow kit assembly.
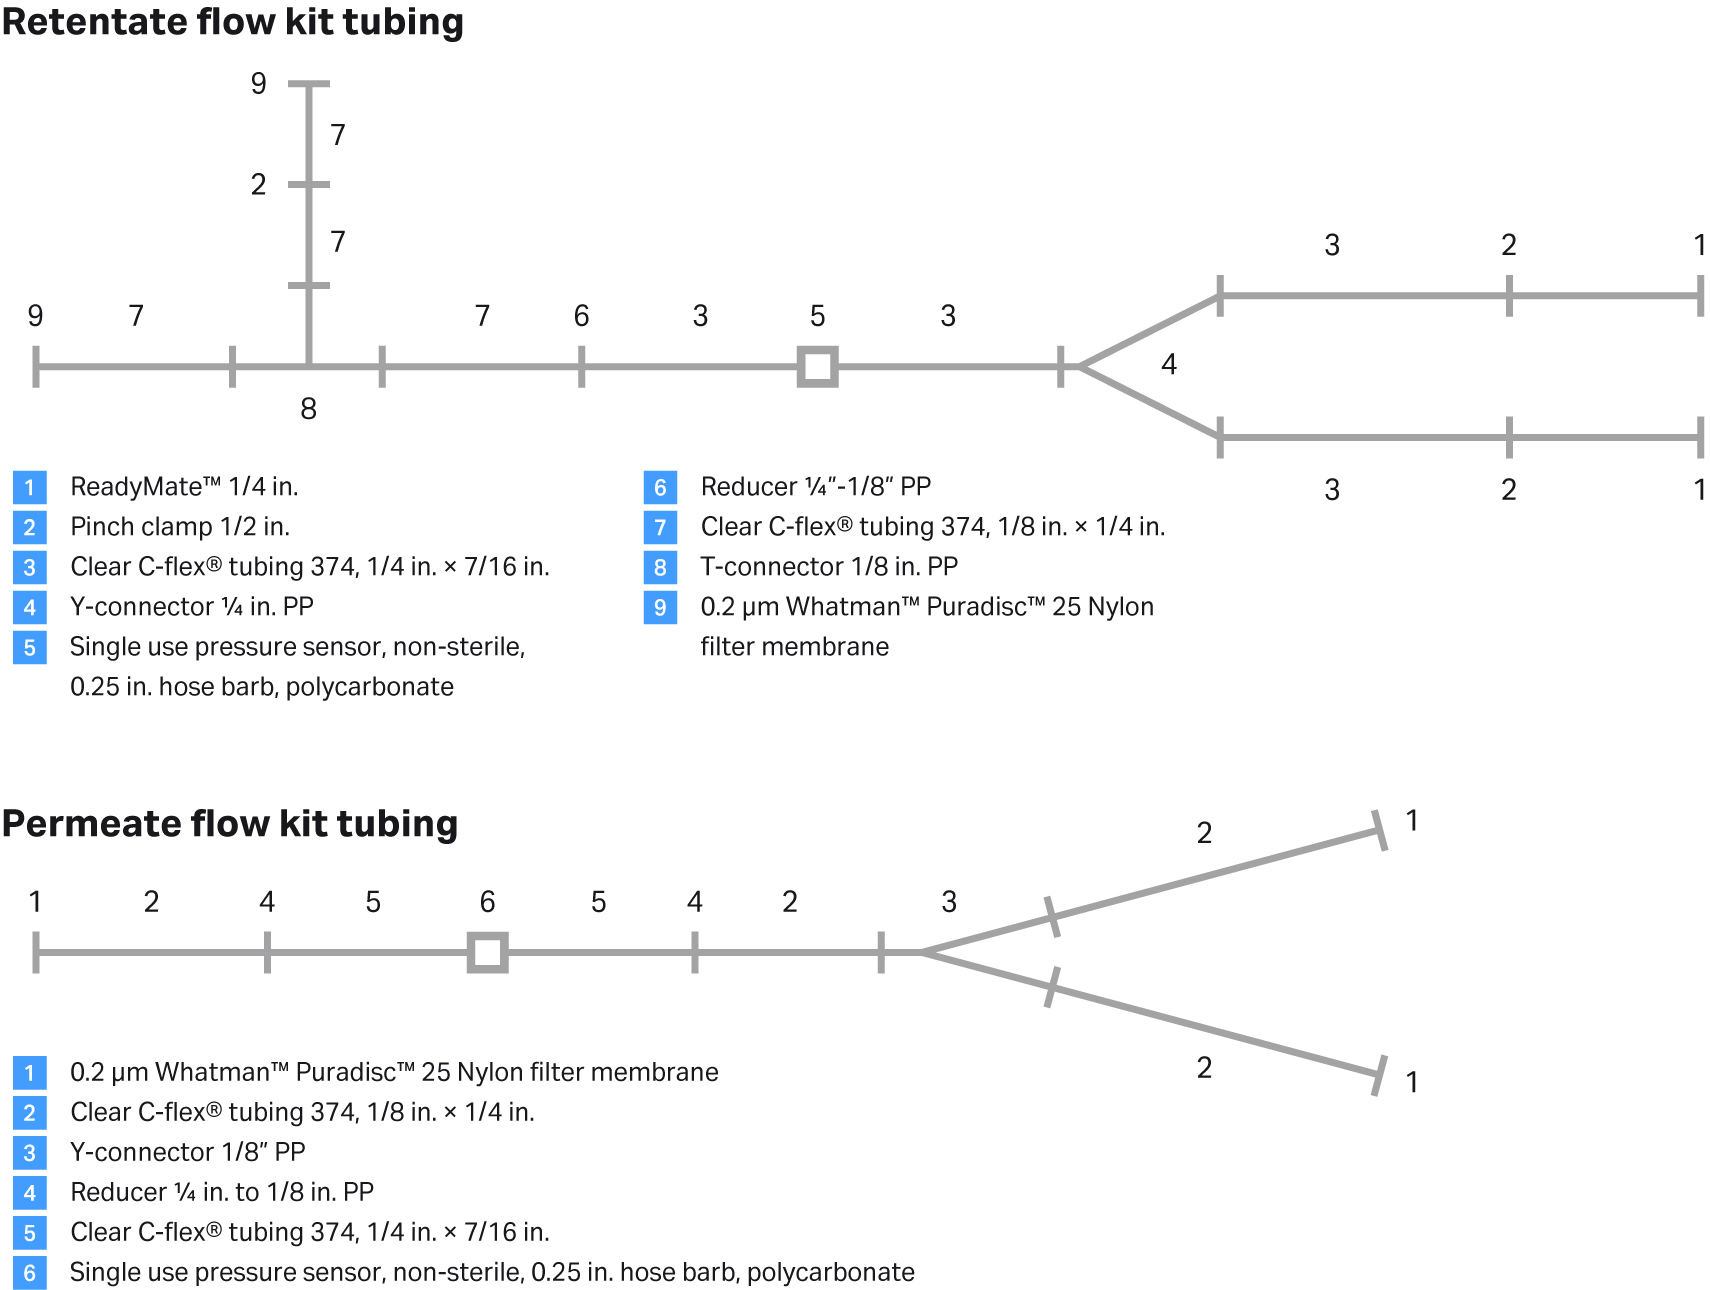
Fig 11. Retentate flow kit and permeate flow kit assemblies.
Table 6. Hardware requirements
| Description | Part number | Quantity |
Levitronix™ console +i30 SUPump
|
100-91098 | 1 |
| AC mains cable (2.5 m, Europe) AMC-1.2 | 190-10332 | 1 |
| Pressure sensor adaptor cable (3 m) LPE-1.1-30 | 190-10354 | 3 |
| Leviflow™ clamp-on sensor LFSC-i10X-001 | 100-30477 | 1 |
| IP adaptor cable single 4 wire ICS-3.1-30 (3 m, PUR, Hirose circular connector HR30 female/M8 male plug) | 190-10447 | |
| Scales 60 kg (media and harvest) | 2 | |
| Scale (bleed) | 1 | |
| Pump 120U (bleed, harvest, and media) | 3 |
Bioreactor preparation and conditioning
The bioreactor configuration is of particular importance as it needs to supply all feeds, gasses, and flows in and out of the bioreactor. An example of a top plate assembly for a 2 L bioreactor can be seen in Figure 12. The microsparger was a sintered 15 µm disk and the macrosparger was a L-sparger with seven 1 mm drilled holes. After completing the bioreactor assembly, the vessel was autoclaved and conditioned with cell culture media according to standard routines.
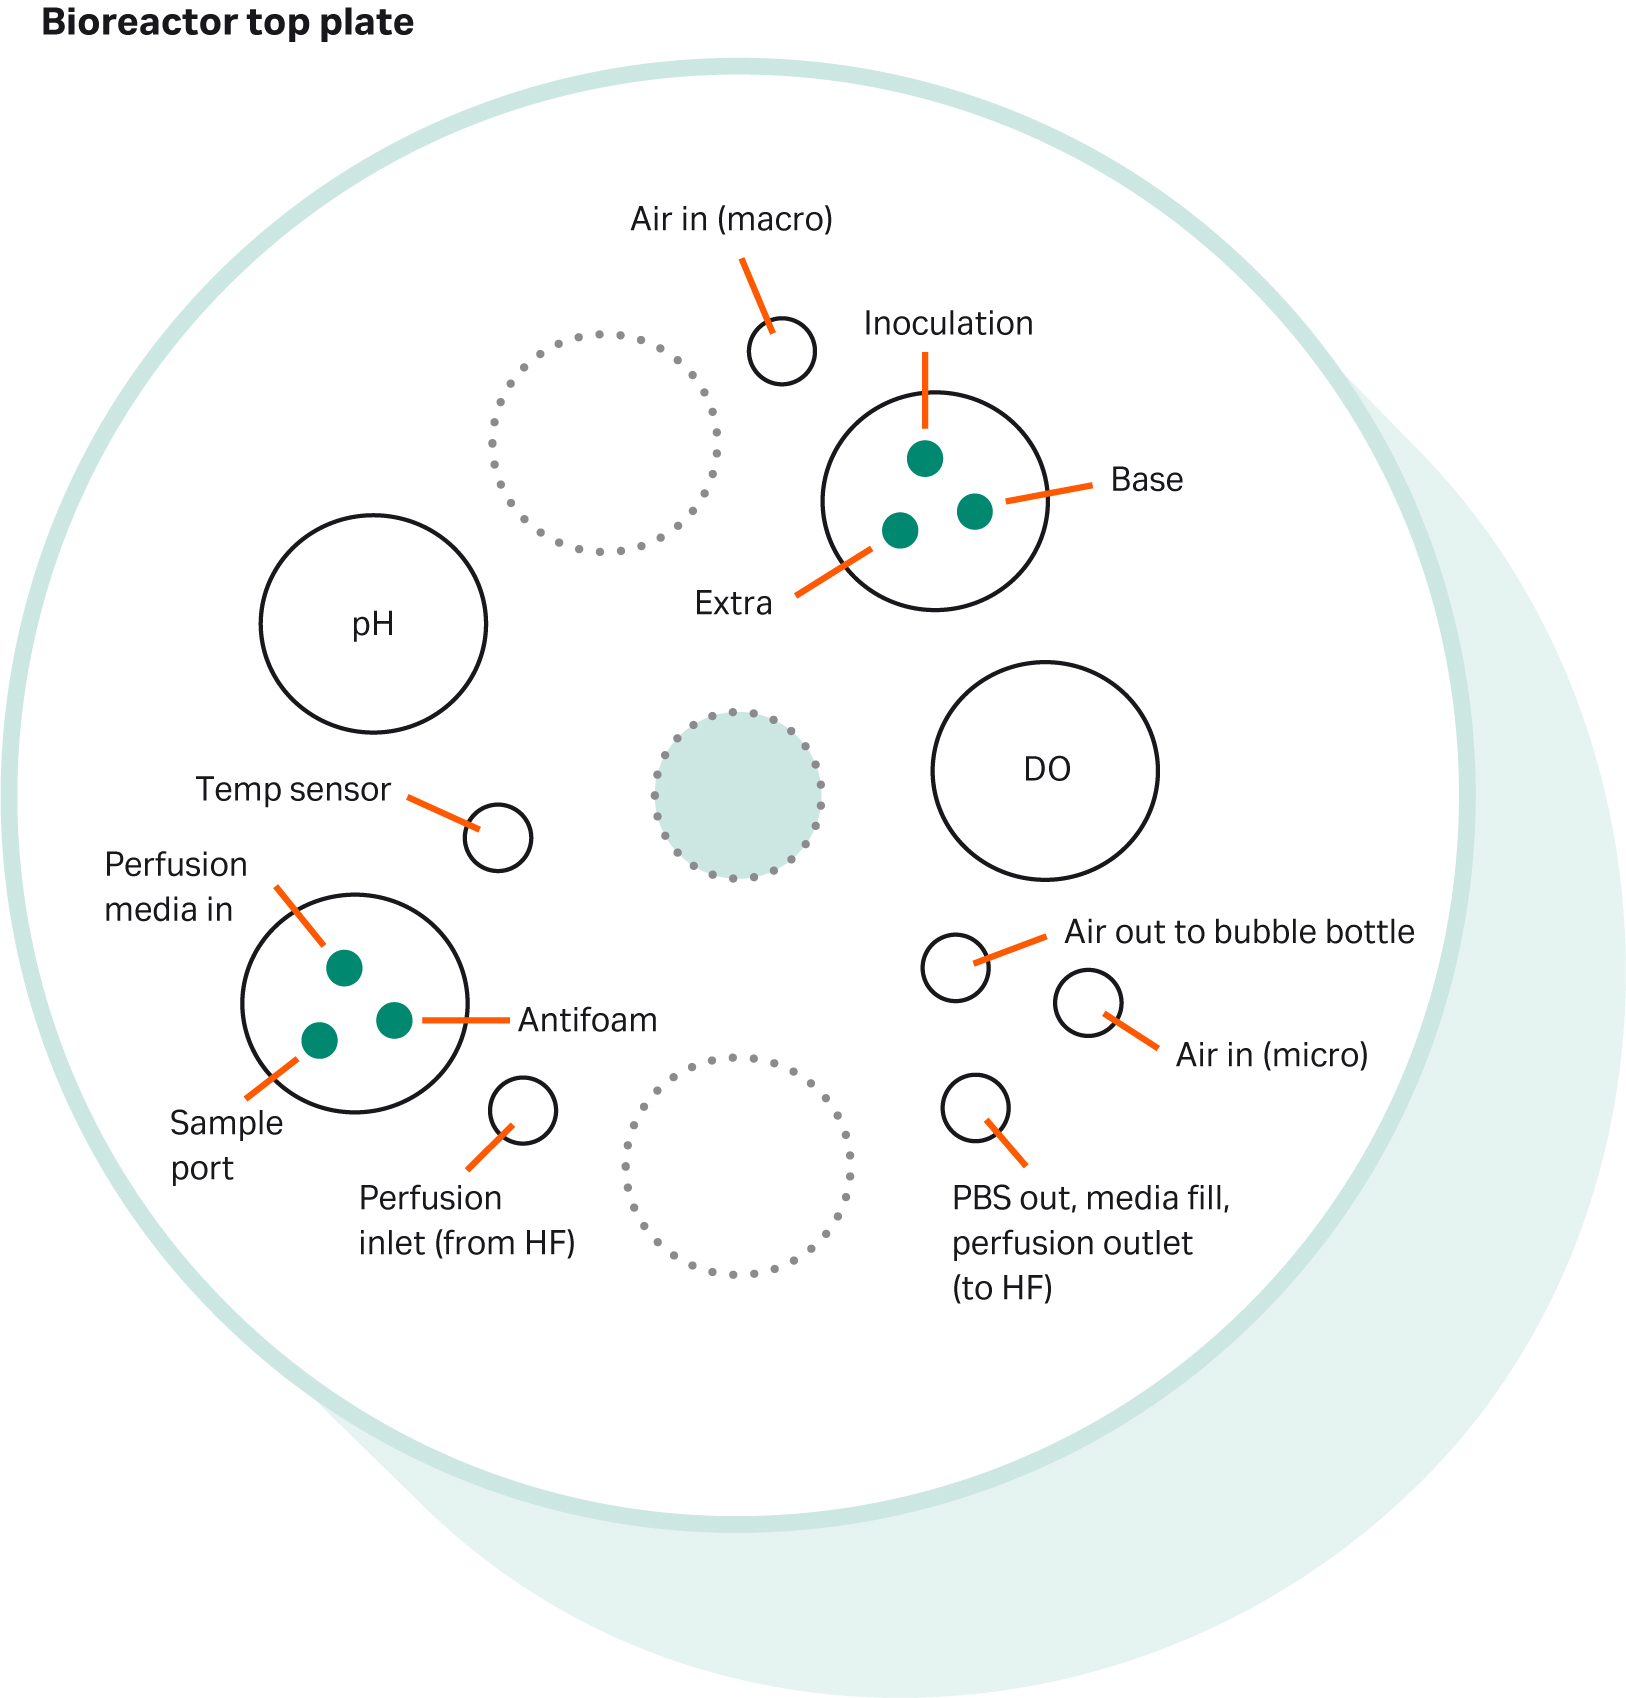
Fig 12. An example of a bioreactor top plate assembly.
Flow kit installation
The two parts of the feed flow kit were welded together just after the Levitronix™ flowmeter but before the pressure sensor. The feed flow kit was then welded to the bioreactor outlet tubing at a position to minimize bending and the distance between the bioreactor and the recirculation pump. This weld replaced the basal media bottle that was connected to that tubing earlier. The tubing was supported at the top plate so that the arc of the tubing from the outlet connector on the top plate and the section going down had a good radius. In the setup we used a 3D printed part to achieve this (Fig 13).
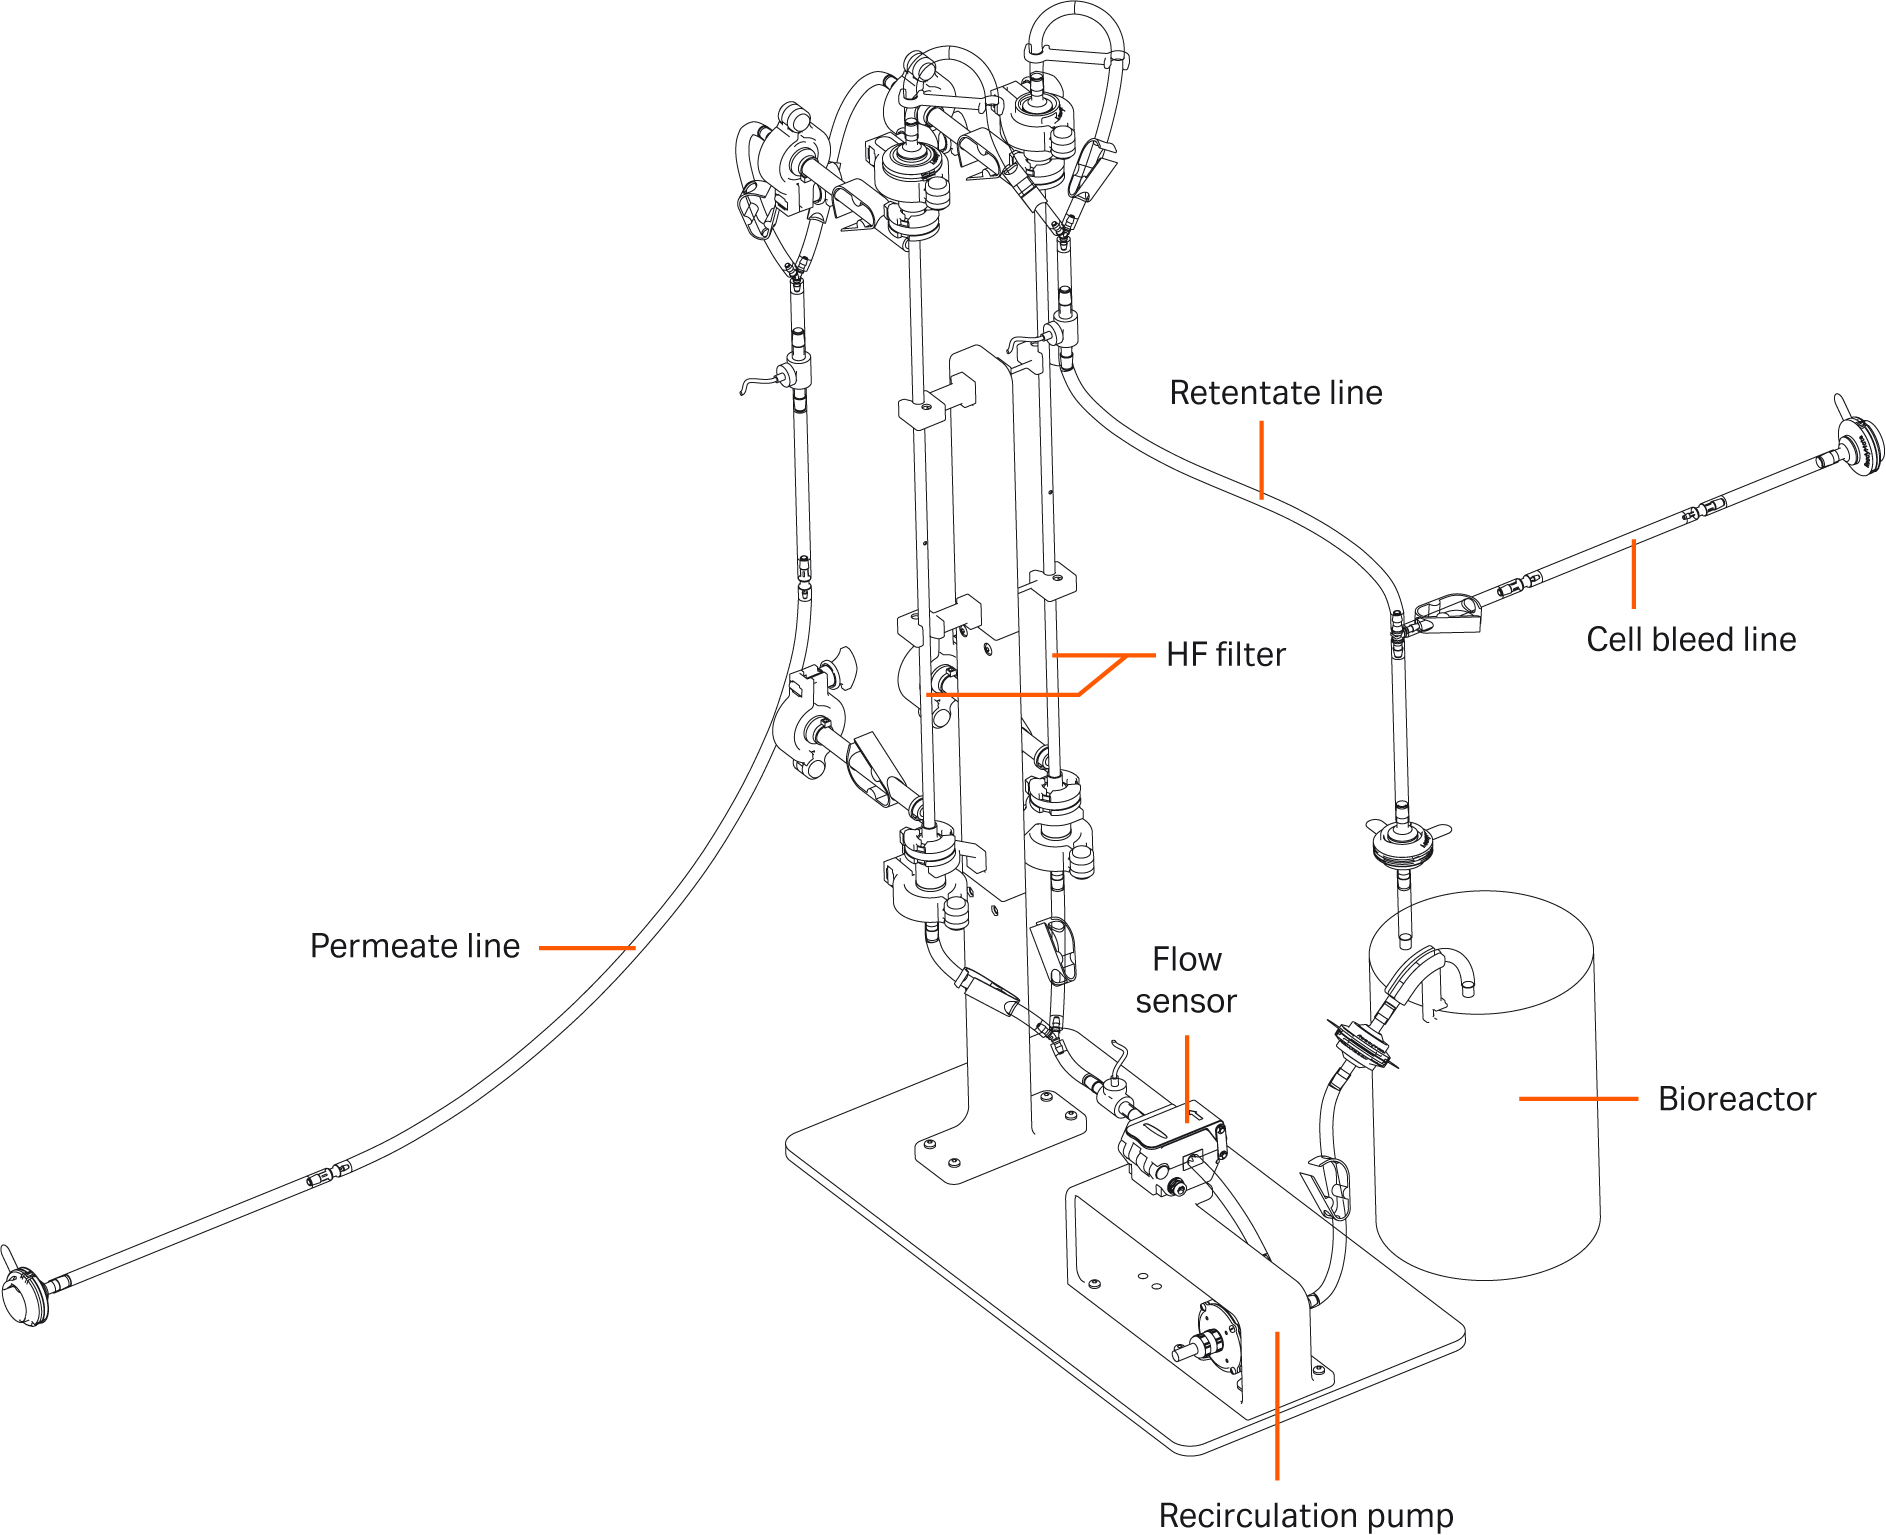
Fig 13. Experimental setup.
The ReadyMate™ DAC on the feed flow kit was connected to the ReadyMate™ DAC on the hollow fiber cartridges. The secondary flow path was clamped. We waited to connect the pump head to the pump motor and the flowmeter until after we had conditioned the flow kit. On the retentate side of the filter and ReadyMate™ DAC, the retentate flow kit ReadyMate™ DAC were connected and the secondary flow path was clamped.
If you are using a filter with ReadyMate™ DAC on the permeate line, they can be connected to the ReadyMate™ DAC on the permeate flow kit. Otherwise, the permeate lines can be welded to the permeate flow kit. The secondary flow path was clamped along with the lower permeate lines on each of the hollow fiber cartridges. The connection towards the harvest container was always at the top permeate outlet.
The other end of the permeate flow kit was welded to the harvest container using extension tubing. Between the harvest container and the permeate flow kit, a sample port for the permeate harvest line was welded on so samples could be taken of the perfusate. In our case, we placed the sample port between the harvest pump and the harvest container. The bleed line on the retentate flow kit was welded to the bleed bottle. The bleed pump, permeate pump, and perfusion media pump tubing were all mounted inside each pump head. In addition, the base tubing and bottle, and antifoam bottle were welded to the bioreactor.
Once the flow kits were installed, the bleed pump was started in order to prime the flow kits and flow path with media. As the media was filling the flow path, we made sure to tap or move the tubing in order to remove all the air bubbles. When the media reached the top of the primary filter it was clamped, and the secondary filter was opened to begin filling that filter as well. Once the liquid reached the bleed bottle, the bleed pump was stopped. The secondary filter path was clamped, and the primary filter path was opened again.
The Levitronix™ pump head was placed inside the pump motor and locked into position. The tubing was placed inside the Levitronix™ flowmeter and gently closed so the tubing did not get pinched, and the flowmeter was zero calibrated. The pressure sensors were connected to the Levitronix™ control unit and zero calibrated. The pump was then started at 153 mL/min and recirculation was left on for 1 to 2 hr to properly condition both the hollow fiber cartridges and the entire flow path.
Next the permeate pump was started to prime the permeate flow path to the harvest bag. It is important to note that the permeate flow should not be set too high otherwise the permeate pressure can become negative. The perfusion media and base tubing were then primed. The recirculation pump was turned off and the flow path was clamped. The upper rpm limit for the Levitronix™ pump was then set to 6000 rpm on the control unit to avoid any sudden high rpm peaks caused by bubble interference with the flow meter.
Perfusion process
The bioreactor was then inoculated at 1 MVC/mL and a working volume of 1.5 L. The settings for the bioreactor are shown in Table 7. On day 1 after inoculation, the perfusion process was started at 40 pL/cell/d and lowered to 20 pL/cell/d on day 3. When the cell concentration reached approximately 70 MVC/mL, the controlled state was initiated by cell bleeding. The cell culture was completed and harvested after 10 days in the controlled state.
Table 7. Bioreactor perfusion settings
| Parameter | Setpoint |
| DO | 40% air saturation |
| pH |
0 d: 6.95 ± 0.10, 1 d and onwards: 6.80 ± 0.05 |
| Temperature | 37°C |
| Stirring | 265 rpm |
| Perfusion rate (CSPR) |
1 and 2 d: 40 pL/cell/d, 3 d and onwards: 20 pL/cell/d |
| Recirculation flow rate | 153 mL/min (2000 s-1 over hollow fiber cartridge) |
| pH control |
Upward: 7.5% w/v Sodium bicarbonate Downward: CO2 |
| DO control | Oxygen on demand through 15 µm sintered sparger |
| Stripping sparger |
L-sparger with seven 1 mm drilled holes. Increase by 10 mL/min when pCO2 goes above 0.014 to 0.016 MPa. Controlled manually by second myControl tower |
| Working volume | 1500 mL |
| Inoculation cell concentration | 1 MVC/mL |
| Controlled state cell concentration | 70 MVC/mL |
| DO loop actuators |
|
| Actuator settings |
Air MFC: High limit: 10 mL/min Low limit: 1 mL/min O2 MFC:High limit: 30 mL/min Low limit: 0 mL/min CO2 MFC:High limit: 500 mL/min Low limit: 0 mL/min |
| PID settings |
DO: P=1, I=3000 D=0, cycle time 5 s pH: P=50, I=0, D=0, cycle time 5 s |
CY29774-01Dec22-AN