Achieving higher yields using mechanistic models to optimize an antibody purification process
Antibody purification processes are typically developed using a platform approach. Optimal operating conditions for single units are found by altering just a few process parameters with Design-of-Experiment (DoE) procedures or high-throughput screenings. But what if DoE fails to find robust process conditions?
Introduction
In a platform approach, only a few parameters of a chromatographic purification step are adjusted for a new molecule. The remaining design space is then explored using high-resolution screening experiments based on Design-of-Experiments (DoE). While this approach works for most platform molecules, it requires a high sample amount, extensive offline analytics and is restricted to the calibrated experimental range.
In this case study, an industrial separation problem of a polishing step using two-step elution was analyzed. The challenge was to separate an antibody from a mixture containing critical aggregates and fragments, while keeping the adsorber material as well as maintaining high yield and purity. A process development approach based on a platform process in combination with DoE failed to find any suitable process with a yield greater than 65%. In contrast, mechanistic models, that describe the transport of sample components using fluid and thermodynamic principles, allowed for efficient process optimization in silico.
Materials and methods
A high-capacity cation-exchange resin was used in the case study. The target component was an intermediately eluting antibody. One low molecular weight (LMW) and two high molecular weight (HMW) species were to be removed. All simulations, parameter estimation, and process optimization were performed using GoSilico™ Chromatography Modeling Software. While the impurities were hardly visible in the chromatogram (Fig 1), a size exclusion chromatography (SEC) fraction analysis (Fig 2) showed that the LMW impurity strongly overlapped with the target antibody such that LMW removal would result in less than 70% yield.
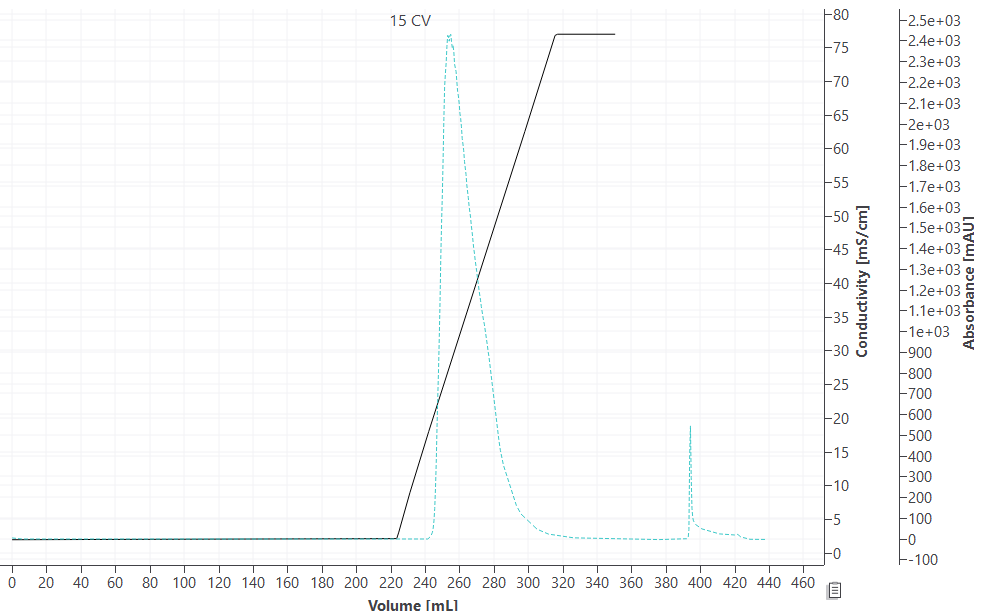
Fig 1. Cation exchange chromatography (CEX) elution profile at 15 CV gradient.
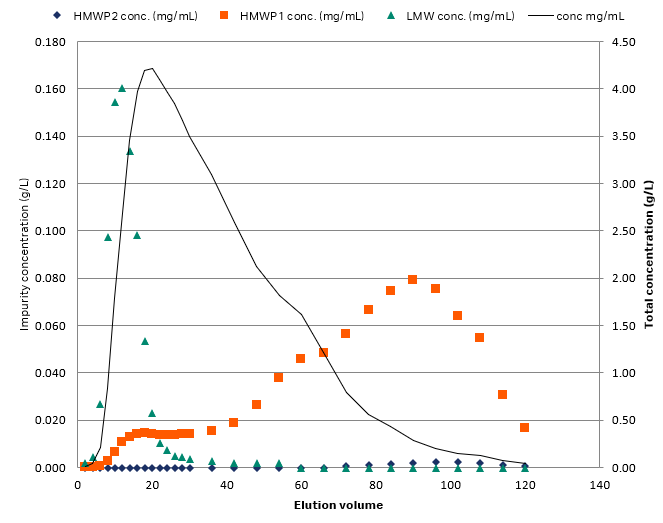
Fig 2. SEC fraction analysis reveals fragments and aggregates in the elution.
Model calibration
The model was calibrated using two tracer runs with and without the column connected and three gradient elutions in non-linear mode. Additional information was obtained by offline SEC fraction analysis. The GoSilico™ Chromatography Modeling Software automatically generated pseudo chromatograms from the relative fractions content determined by SEC, shown as dashed lines in Figures 3 and 4. All unknown model parameters were determined by curve fitting. The plots show the overall result and a close-up of the impurities.
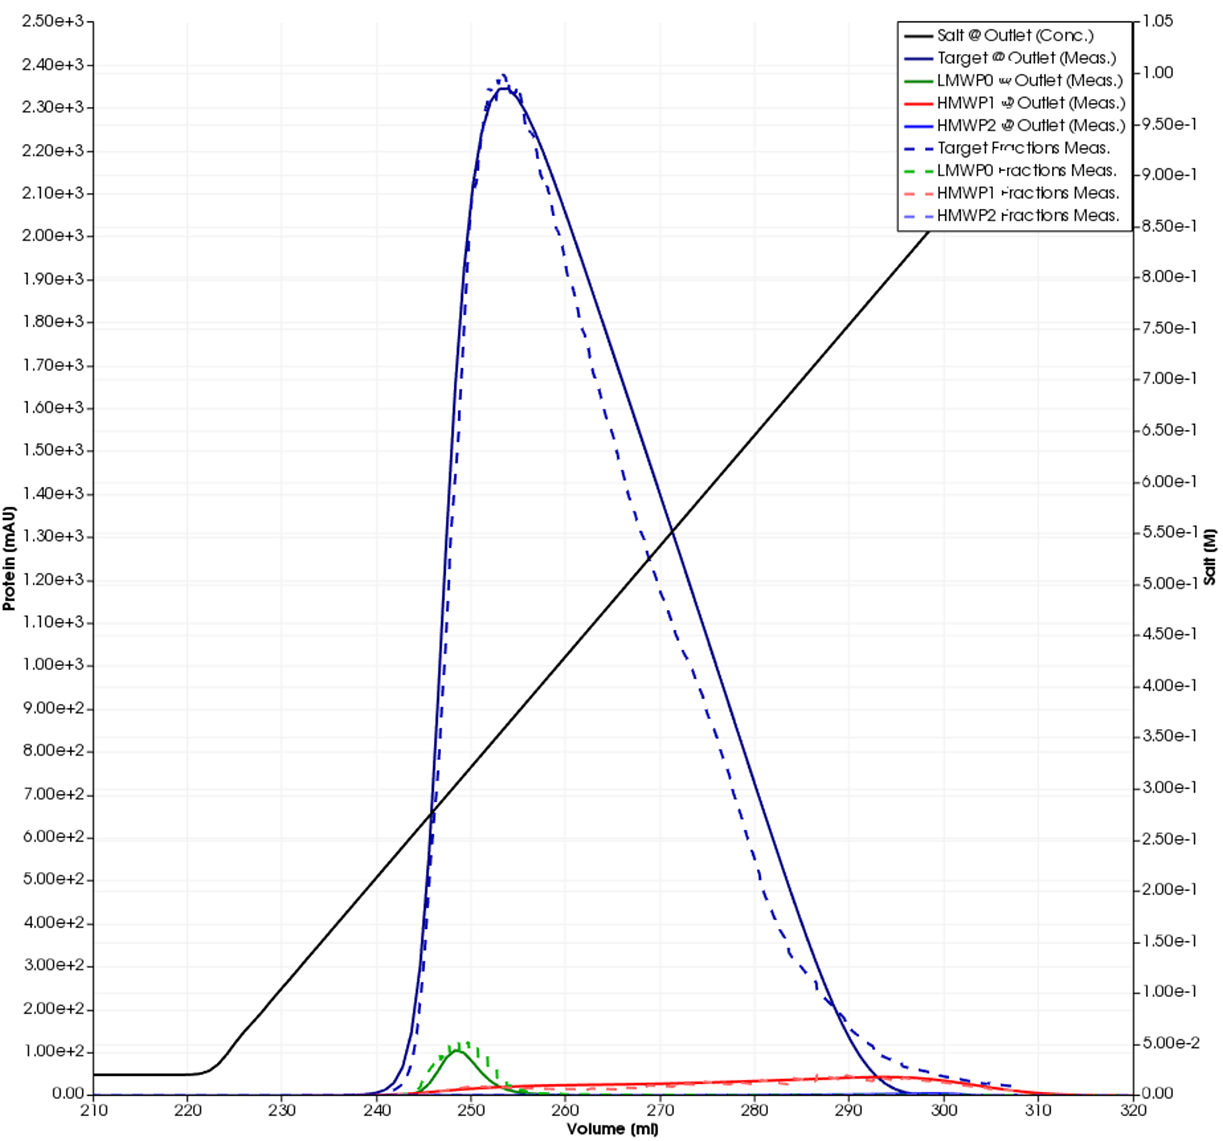
Fig 3. Simulated single-component curves (solid lines) and fraction data (dashed lines).
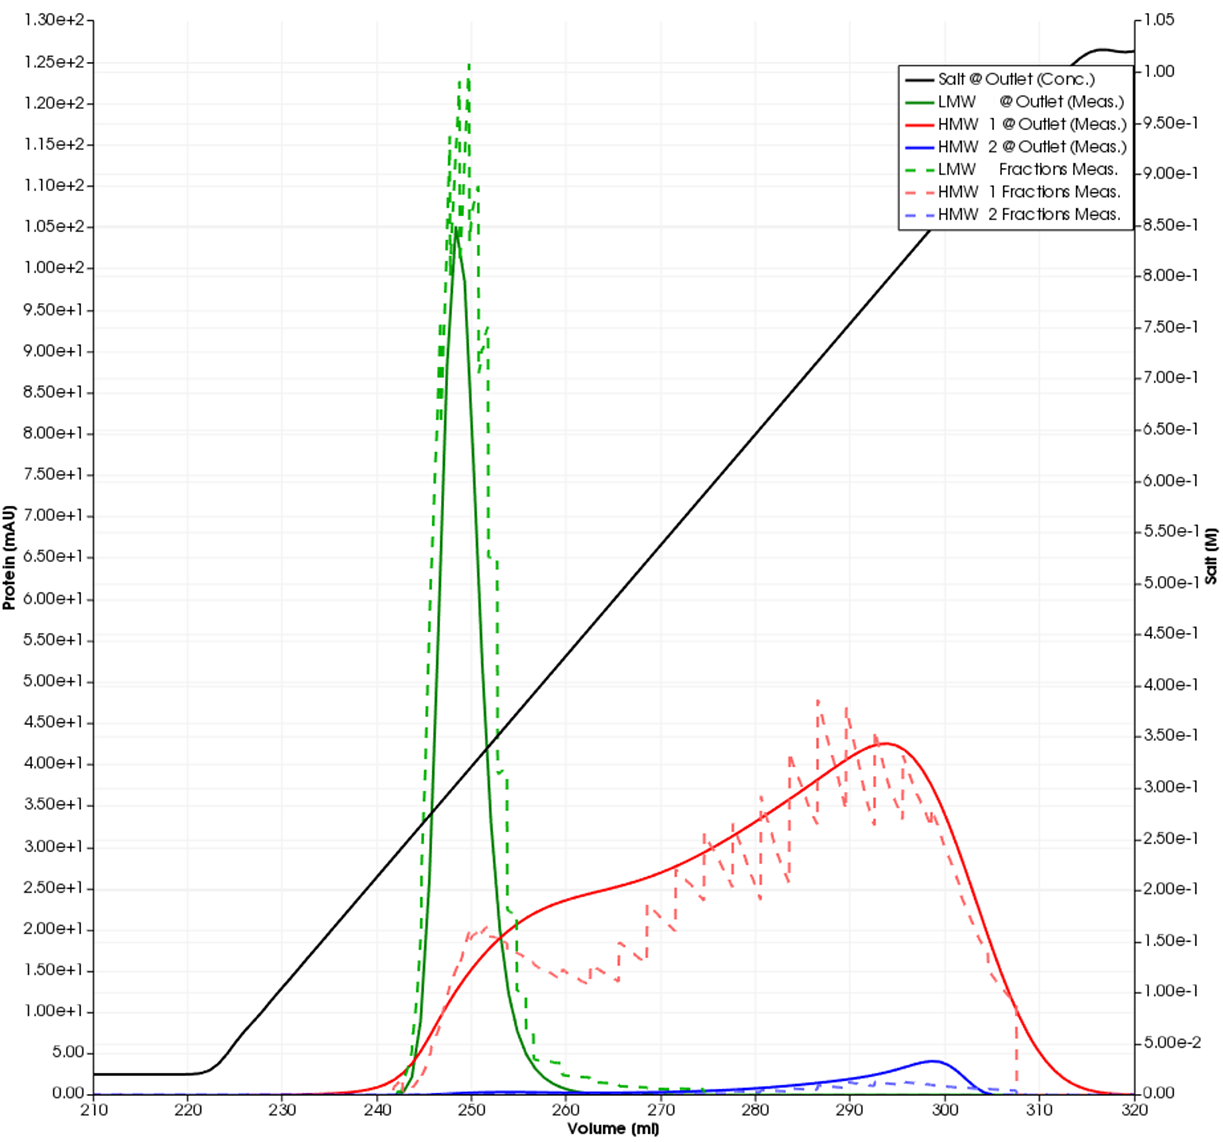
Fig 4. Magnified simulated impurity curves (solid lines) and fraction data (dashed lines) from Figure 3.
Model-based process development
Once the model is calibrated within GoSilico™ Chromatography Modeling Software, subsequent process development and optimization can be done solely on the computer. Compared to the DoE experiments, the load volume was reduced by 75% and the column length increased by 50%. Together with optimized salt elution steps, a high yield and purity could be achieved. Figure 5 shows the optimized set-up. Figure 6 shows the best process set-up when load volume and column length are kept constant. When only buffer salt concentrations and step/gradient shapes can be optimized, the target antibody and the LMWs co-elute, such that the necessary LMW removal results in a poor product yield. Even a subsequent salt gradient elution cannot avoid co-eluting HMWs (Fig 6).
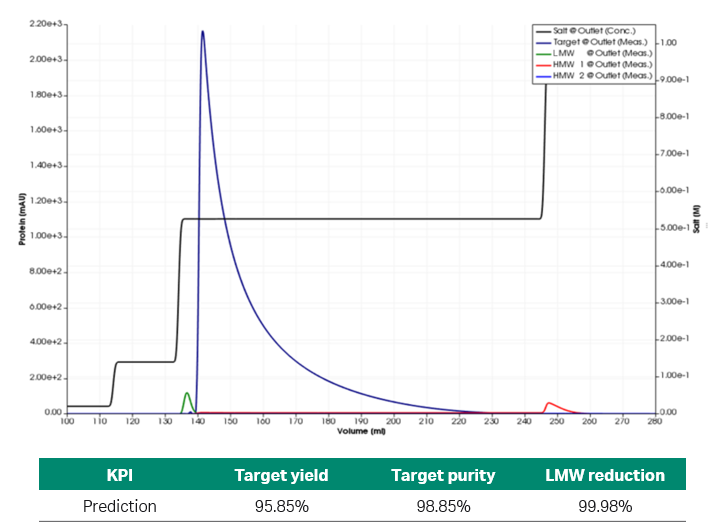
Fig 5. Simulated chromatogram and prediction of KPIs of the optimized process set-up.
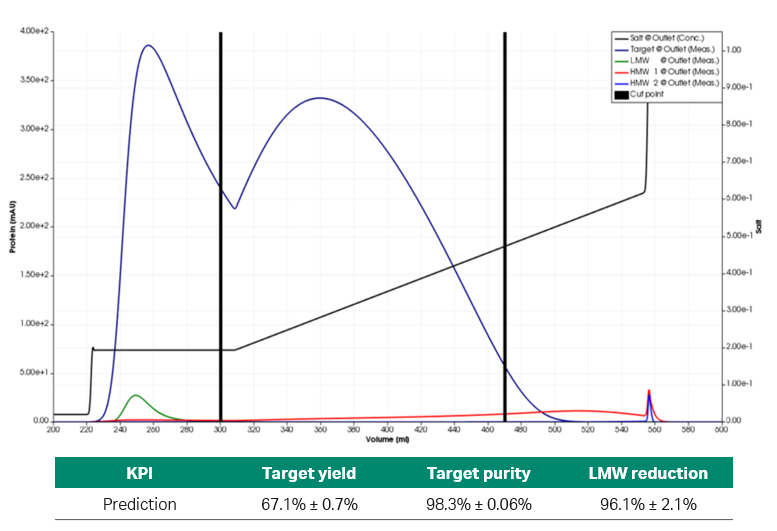
Fig 6. Simulated chromatogram and predicted KPIs of the partially optimized process set-up.
Model quality
While the model fits were very good by visual inspection, only the calculated 95% confidence intervals provide information on if the parameters are well identified. Table 1 shows the calculated 95% confidence intervals for each molecule and model parameter. For the Steric Mass Action adsorption model, all charge and equilibrium parameters have low relative confidence intervals. The kinetics have larger but still acceptable values. Only, the steric shielding parameters of the low concentrated species could not be determined and are, thus, set to zero.
| Parameter | Target | LMW | HMW 1 | HMW 2 |
|---|---|---|---|---|
| Kinetic | 4% | 22% | 9% | 78% |
| Equilibrium | 3% | 13% | 4% | 5% |
| Charge | 1% | 1% | 0% | 0% |
| Shielding | 1% | 2400% | 174% | 1992% |
Improved process understanding
The mechanistic model also explains why the DoE failed to achieve sufficient yield. The surface charge of the LMW is indeed lower than the target antibody, such that it should elute earlier. Because of the convex shape of the adsorption isotherm a higher relative amount of protein cannot bind the higher mobile phase concentration. This results in a faster moving concentration front of the highly concentrated target protein during elution. In fact, the target peak was overtaking the LMW and only a load reduction could solve this problem.